Publisher’s version / Version de l'éditeur:
Proteome Science, 7, 2, 2009-01-08
READ THESE TERMS AND CONDITIONS CAREFULLY BEFORE USING THIS WEBSITE. https://nrc-publications.canada.ca/eng/copyright
Vous avez des questions? Nous pouvons vous aider. Pour communiquer directement avec un auteur, consultez la
première page de la revue dans laquelle son article a été publié afin de trouver ses coordonnées. Si vous n’arrivez pas à les repérer, communiquez avec nous à PublicationsArchive-ArchivesPublications@nrc-cnrc.gc.ca.
Questions? Contact the NRC Publications Archive team at
PublicationsArchive-ArchivesPublications@nrc-cnrc.gc.ca. If you wish to email the authors directly, please see the first page of the publication for their contact information.
This publication could be one of several versions: author’s original, accepted manuscript or the publisher’s version. / La version de cette publication peut être l’une des suivantes : la version prépublication de l’auteur, la version acceptée du manuscrit ou la version de l’éditeur.
For the publisher’s version, please access the DOI link below./ Pour consulter la version de l’éditeur, utilisez le lien DOI ci-dessous.
https://doi.org/10.1186/1477-5956-7-2
Access and use of this website and the material on it are subject to the Terms and Conditions set forth at
Glycoproteomic analysis of two mouse mammary cell lines during
transforming growth factor (TGF)-Beta induced epithelial to
mesenchymal transition
Hill, Jennifer J.; Tremblay, Tammy-Lynn; Cantin, Christiane;
O'Connor-McCourt, Maureen; Kelly, John F.; Lenferink, Anne E. G.
https://publications-cnrc.canada.ca/fra/droits
L’accès à ce site Web et l’utilisation de son contenu sont assujettis aux conditions présentées dans le site LISEZ CES CONDITIONS ATTENTIVEMENT AVANT D’UTILISER CE SITE WEB.
NRC Publications Record / Notice d'Archives des publications de CNRC:
https://nrc-publications.canada.ca/eng/view/object/?id=4356987c-22ad-4830-9c39-393194fa3305 https://publications-cnrc.canada.ca/fra/voir/objet/?id=4356987c-22ad-4830-9c39-393194fa3305Open Access
Research
Glycoproteomic analysis of two mouse mammary cell lines during
transforming growth factor (TGF)-β induced epithelial to
mesenchymal transition
Jennifer J Hill*
1, Tammy-Lynn Tremblay
1, Christiane Cantin
2,
Maureen O'Connor-McCourt
2, John F Kelly
1and Anne EG Lenferink
2Address: 1Institute for Biological Sciences, National Research Council Canada, 100 Sussex Drive, Ottawa, ON K1A 0R6, Canada and 2Biotechnology Research Institute, National Research Council Canada, 6100 Royalmount Ave., Montreal, QC H4P 2R2, Canada
Email: Jennifer J Hill* - Jennifer.Hill@nrc-cnrc.gc.ca; Tammy-Lynn Tremblay - Tammy-Lynn.Tremblay@nrc-cnrc.gc.ca; Christiane Cantin - Christiane.Cantin@nrc-cnrc.gc.ca; Maureen O'Connor-McCourt - Maureen.O'Connor@nrc-cnrc.gc.ca; John F Kelly - John.Kelly@nrc-cnrc.gc.ca; Anne EG Lenferink - Anne.Lenferink@nrc-cnrc.gc.ca
* Corresponding author
Abstract
Background: TGF-β acts as an antiproliferative factor in normal epithelial cells and at early stages
of oncogenesis. However, later in tumor development TGF-β can become tumor promoting through mechanisms including the induction of epithelial-to-mesenchymal transition (EMT), a process that is thought to contribute to tumor progression, invasion and metastasis. To identify EMT-related breast cancer therapeutic targets and biomarkers, we have used two proteomic approaches to find proteins that change in abundance upon the induction of EMT by TGF-β in two mouse mammary epithelial cell lines, NMuMG and BRI-JM01.
Results: Preliminary experiments based on two-dimensional electrophoresis of a hydrophobic cell
fraction identified only 5 differentially expressed proteins from BRI-JM01 cells. Since 3 of these proteins were glycoproteins, we next used the lectin, wheat germ agglutinin (WGA), to enrich for glycoproteins, followed by relative quantification of tryptic peptides using a label-free LC-MS based method. Using these approaches, we identified several proteins that are modulated during the EMT process, including cell adhesion molecules (several members of the Integrin family, Fibronectin, Activated leukocyte cell adhesion molecule, and Neural cell adhesion molecule 1) and regulators of cellular signaling (Tumor-associated calcium signal transducer 2, Basigin).
Conclusion: Interestingly, despite the fact that TGF-β induces similar EMT phenotypes in NMuMG
and BRI-JM01 cells, the proteomic results for the two cell lines showed only minimal overlap. These differences likely result in part from the conservative cut-off values used to define differentially-expressed proteins in these experiments. Alternatively, it is possible that the two cell lines may use different mechanisms to achieve an EMT transition.
Published: 8 January 2009
Proteome Science 2009, 7:2 doi:10.1186/1477-5956-7-2
Received: 21 August 2008 Accepted: 8 January 2009 This article is available from: http://www.proteomesci.com/content/7/1/2
© 2009 Hill et al; licensee BioMed Central Ltd.
This is an Open Access article distributed under the terms of the Creative Commons Attribution License (http://creativecommons.org/licenses/by/2.0), which permits unrestricted use, distribution, and reproduction in any medium, provided the original work is properly cited.
Background
Transforming growth factor beta (TGF-β) can act as both a tumor-suppressor and a tumor-promoter, depending on the cellular state and environment [1]. The tumor promot-ing role of TGF-β is linked to its ability to induce an epi-thelial-to-mesenchymal transition (EMT) in late stage cancers. EMT is characterized by a decrease in cell-cell adhesion, an increase in cell motility, and the activation of proteolysis, properties that are associated with tumor cell invasion and metastasis [2-5]. EMT also occurs throughout normal embryonic development and is criti-cal for the formation of mesoderm during gastrulation [6]. However, due to the poorly regulated, stochastic nature of the EMT process during tumor development, cancer cells undergoing EMT often only use a subset of the molecular mechanisms utilized during EMT in embryo-genesis [3].
The mouse mammary epithelial cell lines, BRI-JM01 and NMuMG, are independently derived cell lines that both undergo EMT upon exposure to TGF-β. NMuMG is a non-transformed cell line that is a well-established EMT model system, whereas the BRI-JM01 cell line was recently pre-sented as an alternative for studying TGF-β-induced EMT [7,8]. In both cell lines, treatment with TGF-β induces similar changes in phenotype, including the loss or relo-calization of epithelial markers (e.g. ZO-1 and E-cad-herin), the rearrangement of actin and vimentin filaments, and an increase in motility.
Very few studies have explored the molecular mechanism of EMT in cancer cells by using proteomics to identify pro-tein expression changes that are associated with this proc-ess [9,10]. Keshamouni et al. used iTRAQ to quantify protein expression changes in A549 lung cancer cells upon the induction of EMT by TGF-β [10]. Other pro-teomic studies on EMT have generally focused on a small number of selected proteins of interest [11,12].
Due to the wide dynamic range of protein expression, pro-teomic studies are generally limited to the analysis of the most abundant proteins in a complex mixture. Although cell surface and secreted proteins play an important role in mediating the invasive and metastatic properties of tumor cells, these proteins are often difficult to analyze by tradi-tional proteomics methods such as two-dimensional gel electrophoresis (2DE), due to their hydrophobicity and relatively low abundance. Recently, inclusion of ASB-14 detergent has been reported to increase the number of hydrophobic proteins visible by 2DE, but this subset of proteins continues to be underrepresented in many pro-teomic studies.
Glycoproteins play an important role in the regulation and progression of many human diseases, including
can-cer [13,14]. Glycosylation is a post-translational modifi-cation that is particularly prevalent on secreted and membrane proteins, a subset of proteins that play an important role in the regulation of cell adhesion, motility, and EMT. Glycoproteins also make promising therapeutic and diagnostic targets for disease. In fact, most protein-based drugs on the market target glycoproteins, such as the blockbuster drugs Enbrel (TNF-α receptor-Fc fusion for rheumatoid arthritis/psoriasis) and Avastin (anti-VEGF monoclonal antibody for metastatic colon cancer). Glycoproteins also comprise the majority of clinical can-cer biomarkers, including carcinoembryonic antigen (CEA), prostate-specific antigen (PSA), CA-125 antigen, and CA 15-3 antigen [15].
Since most cell surface and secreted proteins are glyco-sylated, it is possible to focus proteomic experiments on these proteins by enrichment using lectins, a family of proteins that bind specifically to glycans [16]. Many pro-teomic studies have exploited lectins for their ability to enrich glycoproteins and glycopeptides [17,18]. The majority of lectin studies are focused on the analysis of serum and plasma proteins in biomarker studies [17,19-21]. Other studies have highlighted the use of lectins with different glycan binding specificities as a means of simpli-fying complex protein samples before proteomic analysis, or to explore alterations in glycan structure that occur in many disease processes, including cancer [22,23]. These glycan variations may pin-point the disease stage and can be helpful for diagnosis [24,25].
To our knowledge, no proteomic studies have focused on glycoproteins in the context of EMT in a tumor cell model. Here, we have applied two proteomic analytical methods, 2DE and gel-free quantification of wheat germ agglutinin (WGA)-enriched fractions to identify proteins that change in abundance upon the induction of EMT. WGA is a well-characterized lectin that recognizes sialic acid and N-acetylglucosamine, a sugar present in the core structure of mammalian N-linked glycans. For comparison, protein changes were explored in both the BRI-JM01 and NMuMG cell lines.
Methods
Cell culture
BRI-JM01 cells were isolated, characterized and cultured as described [7]. Namru murine mammary gland (NMuMG) cells were obtained from ATCC and cultured as recommended. Human recombinant TGF-β1 (R&D Systems) was reconstituted according to the manufac-turer's instructions. Cells were grown to 70% confluency in 150 mm dishes, after which TGF-β1 was added at a final concentration of 100 pM. After 24 hrs cells were washed 3 times with ice-cold Tris-buffered saline (TBS), collected in TBS using a rubber policeman, and pelleted by
centrifuga-tion (1500 rpm). Control (CTL) and TGF-β treated cells for each biological repetition were prepared in parallel. Cells for each of the three biological replications (BR1, BR2, and BR3) were prepared on three separate occasions, months apart.
Two-dimensional electrophoresis
Cell pellets were lysed in 10 mM Tris-HCl, pH 7.4, 150 mM NaCl, and 1% Triton X-114 and hydrophobic pro-teins were enriched by phase separation at 30°C. Propro-teins in the detergent phase were acetone precipitated and resuspended in standard IEF buffer (7 M Urea, 2 M thiou-rea, 4% CHAPS, 1% DTT) with 1% ASB-14. Protein con-centration was obtained by Bio-rad Protein Assay and 250 – 375 μg of protein was used to passively rehydrate IPG Strips pH 3–6 or 5–8 (Bio-rad) for 16–18 hrs. The strips were then submitted to isoelectric focusing (IEF) in the Protean IEF Cell (Bio-Rad). Prior to SDS-PAGE separa-tion, proteins immobilized on the IPG strips were reduced (1% DTT) and alkylated (4% iodoacetamide) in SDS equilibration buffer (6 M urea, 30% glycerol, 2% SDS, 50 mM tris-HCl, pH 8.8). Separated proteins were visualized with Sypro Ruby for quantitative analysis followed by a silver nitrate staining for spot cutting. Gels were scanned with a Fluor-S imager (Bio-Rad) and analyzed using PDQuest (Bio-Rad). Protein ratios were calculated by averaging the ratio from all biological repeats in which the spot was quantified. Spots were selected for sequencing if they changed in intensity by ≥ 2 fold in at least 2 biologi-cal repetitions. Selected spots were excised manually, destained with a solution containing 15 mM potassium ferricyanide and 50 mM sodium thiosulfate, rinsed three times with water, and shrunk with acetonitrile. The gel pieces were swelled with 20 μl of trypsin solution (Promega, 0.01 μg/μl in 50 mM ammonium bicarbo-nate), and incubated overnight at 37°C.
Enrichment of WGA binding proteins
Cell pellets were lysed by sonication in WGA binding buffer (WGA-BB: 50 mM Tris pH 6.5, 150 mM NaCl, 0.1 mM MnCl2, 0.5% Triton X-100) supplemented at 1:200 with a mammalian protease inhibitor cocktail (Sigma). Insoluble debris was pelleted by centrifugation at 11000 g for 20 minutes and the protein concentration of the cleared lysate was determined by the Bio-rad Protein Assay, using BSA as a standard. Lysates were adjusted to 0.75–1.0 mg/ml protein and 800 μg of protein was run through a spin column containing 150 μl packed volume of pre-washed WGA-conjugated agarose beads (4%, Sigma) 3 times by gravity and then saved as the 'flow-through' fraction. The beads were then washed 3 times with 500 μl WGA-BB, briefly spinning the column at 100 g for 1 minute after each wash. Bound glycoproteins were eluted with 4 × 125 μl of WGA elute buffer (50 mM Tris
pH 6.5, 500 mM NaCl, 0.1 mM MnCl2, 0.5% Triton
X-100, 0.3 M N-acetylglycosamine). Elution fractions were combined, precipitated with acetone, and resuspended in 50 mM Tris pH 7.4, 150 mM NaCl, 0.5% SDS, before being subjected to a tube-gel digest with trypsin, essen-tially as described [26]. Cysteines were reduced with 10 mM DTT and alkylated with 55 mM iodoacetamide. Pep-tides were extracted from the gel with 2 × 50 ul of 50% ACN/5% AcOH. Organic solvent was removed under vac-uum before analysis by LC-MS(MS).
SDS-PAGE and western blots
Proteins from whole cell lysates (input), WGA flow-through fraction (FT), and WGA elution (EL) fraction were separated by standard SDS-PAGE and visualized with ProQ-Emerald (Invitrogen) glycosylation specific stain, followed by Sypro Ruby total protein stain (Invitro-gen). For western blots, SDS-PAGE separated proteins were transferred to nitrocellulose, blocked with 5% milk in Tris-buffered saline, and blotted by standard protocols with primary and HRP-labeled secondary antibodies. Pro-teins were visualized by fluorography with the ECL Plus Western Blotting Detection System (GE Healthcare). Pri-mary antibodies used were anti-β-actin (clone AC-15, 1:5000 dilution) from Sigma-Aldrich; anti-Integrin-β4 (C-20, 1:200), EMMPRIN (Basigin, B-5, 1:200), anti-Integrin-β2 (N-19, 1:200), anti-Integrin-β5 (H-104, 1:300 an H-96, 1:200), Integrin-α3 (C-18, 1:200), anti-ALCAM (H-108, 1:200), anti-Tropomodulin-3 (C-13, 1:200), and anti-14-3-3σ (C-18, 1:200), all from Santa Cruz Biotechnology.
Immunofluorescence microscopy
Cells were seeded in glass chamber slides (Nunc), grown to 70% confluency, and then maintained in the absence or presence of 100 pM TGF-β1 for 24 hrs. Cells were fixed with 4% para-formaldehyde in PBS (10 min, RT), perme-abilized with 0.1% Triton X-100 (2 min, RT), and blocked with 10% FBS in PBS (30 min, RT). Cells were then incu-bated for 1 hr (RT) with a 1:100 dilution (in 10% FBS in PBS) of the following antibodies (all from Santa Cruz Bio-technology): anti-Clusterin (C-18, 1:100), anti-Integrin-α6 (H-87, 1:100), anti-Fibronectin (C-20, 1:100) and anti-NCAM (1.BB.495). After rinsing three times with PBS (RT) cells were incubated with either Alexa 488-conju-gated donkey anti-goat IgGs, Alexa 488-conju488-conju-gated don-key anti-rat IgG, or Alexa 488-conjugated dondon-key anti-rat IgG (all diluted 1:200, Invitrogen) for 30 minutes. Cells were then washed three times (PBS, RT), nuclei were counterstained with 4,6-diamidino-2-phenylindole (DAPI, 0.4 μg/mL), and then mounted using ProLong Gold anti-fade (Invitrogen). F-actin filaments were stained using rhodamine-labeled phalloidin (1:200) obtained from Invitrogen. Finally, fluorescent images were captured using a QImaging Retiga-2000R CCD cam-era mounted on a Leitz Aristoplan microscope. Images
were processed using QCapture software (Meyer Instru-ments) and pseudo-colored using Photoshop CS3 (Adobe) software.
Quantification by nano-LC-MS
For each BR, tryptic digests of the WGA elution fractions from CTL and TGF-β treated cells were analyzed 3 times by nano-LC-MS by subsequent, alternating injections on a Q-TOF Ultima coupled to a CapLC capillary LC system (Waters, Milford, MA). Samples were separated on a 5 cm
× 75 μm BioBasic® C18, 5 μm particle, PicoFrit® column
(New Objective, Inc., Woburn, MA) with a flow rate of ~250 nL/minute using a 42 minute gradient: 0–40% B (100% ACN/0.2% formic acid) over 37 minutes, 40–95% B over 5 minutes. Five minute washes in 50% B were fol-lowed by 20 minute blank gradients between each sample to minimize possible carryover effects. Continuum MS spectra were acquired every 2 seconds in the TOF-MS mode between m/z 400–2000. Under these conditions, the average peptide elutes over a time period of ~30–40 seconds, allowing 15–20 spectra to be collected per chro-matographic peptide peak. Multiply charged ions were quantified and matched across different LC-MS runs by MatchRx [27], a software package developed in house that calculates the relative peptide abundance between subse-quent LC-MS runs based on area under the chromato-graphic peak.
Statistical analysis
For each biological repetition, individual MS runs were normalized so that the median peptide abundance of pep-tides matched and quantified in all MS runs is equal. Next, the following values were calculated in Microsoft Excel for every peptide quantified by MatchRx in ≥ 2 technical rep-etitions: the average and standard deviation of the peptide abundance in each of two samples (CTL and TGF-β) over
the 3 triplicate LC-MS runs; log2 of the ratio of the
abun-dance of the TGF-β sample relative to the abunabun-dance of the CTL sample (propagating the error from the standard deviations calculated above); the p value as calculated by a student's t-test comparing the 3 CTL abundance values to the 3 TGF-β abundance values. Peptides were designated as changed in abundance if they had a p value < 0.05 and a |log2ratio| > 0.75 (Filter A) or a p value < 0.05 and a |log2ratio| > 0.35 (Filter B).
Proteins were designated as differentially-expressed by grouping all peptides assigned to the protein and then cal-culating the probability of finding the number of 'chang-ing' peptides, relative to the total number of peptides using the false positive rate calculated from the CTL1 ver-sus CTL2 experiment (see text; 0.1 for Filter A and 0.25 for Filter B) and assuming a binomial distribution for a series of independent Bernoulli trials. Proteins with probabili-ties < 0.05 were considered to be changing in abundance, assuming it met all other criteria shown in our decision
tree. Final protein ratios were calculated by summing the abundance of all peptides belonging to a given protein for each LC-MS repeat in a given biological repetition for both the CTL and TGF-β samples.
Peptide identification by LC-MS/MS and database searching
Peptides were identified by LC-MS/MS on either a Q-TOF Ultima (Waters) or LTQ XL (Thermo) mass spectrometer. The Q-TOF Ultima was run using the LC setup described above with one of two instrument methods: (1) auto-matic switching to trigger MS/MS on the top 2 ions with a dynamic exclusion window of 40 seconds, or (2) inclu-sion list-MS/MS to specifically target differentially expressed peptide ions. Q-TOF data was searched against the NCBI nr database (04/05/2008; 6405498 entries) using Mascot with the following parameters (trypsin, 1 missed cleavage, peptide tolerance: 1.5 Da, MS/MS toler-ance: 0.8 Da, modifications: carbamidomethyl (Cys, fixed), oxidized Met (variable). In auto-MS/MS files, only peptides with Mascot scores > 30 and a delta mass < 0.25 Da were considered. For inclusion list data, lower scores were considered after manual assessment. All Q-TOF spec-tra for differentially expressed peptides were manually verified. All 2DE spots were analyzed on the Q-TOF and required a minimum of 2 verified peptides to be identi-fied. The LTQ XL mass spectrometer (Thermo) was cou-pled to a MDLC chromatography system (GE Healthcare). Samples were separated on a 5 cm × 75 μm BioBasic C18, 5 μm particle, PicoFrit column (New Objective) with a flow rate of ~300 nL/minute using a 30 minute gradient: 0–30% B over 14 minutes, 30–50% B over 14 minutes, 50–90% over 2 minutes. MS and MS/MS data were col-lected in enhanced profile and normal centroid mode, respectively. MS/MS was triggered by automatic switching on the top 2 peptides with a 40 second dynamic exclusion window and exclusion mass width of 0.1 (low) and 1.5 (high). CID settings were: isolation width = 1.0, normal-ized collision energy = 35, activation Q = 0.25, activation time = 30 ms. LTQ MSMS spectra were searched using Bio-worksBrowser 3.3.1 Build 7 against the ipi.mouse.v3.18 database (53788 entries, 06/23/2006) with the following parameters (trypsin; 2 missed cleavages; peptide tolerance = 2.0 Da; fragment tolerance = 1.0 Da; modifications: car-bamidomethyl cysteine (fixed), oxidized methionine
(variable)) and filtered to require Xcorr > 2.9 (2+), 3.4 (3+)
and peptide probability < 1.0. A comparison of forward and reversed database search results from 10 LTQ auto-MS/MS files of WGA lectin fractions suggests a false posi-tive identification rate of ~1% with these parameters (3 unique hits to reversed database versus 326 unique hits to forward database).
Due to the low redundancy and rich annotation detail, proteins in Table 1 and 2 were reassigned to mouse pro-teins from the Swiss-Prot database when an exact match
for each peptide could be found using the pBLAST algo-rithm for short/nearly exact sequence [28,29]. All Swiss-Prot accession numbers from mouse and cow that contain the assigned peptide sequences are shown.
MS/MS alignment with LC-MS data
Identifications from the MS/MS runs were aligned with the Q-TOF quantification nanoLC-MS data visually using MSight[30]. First, 6–10 peptides that were clearly identical were used as landmark alignments. Peptide identifica-tions were imported onto the MS image produced from the MS/MS run and the equivalent peptide in the aligned nanoLC-MS quantification image was found manually. For a candidate ion in the quantification data to be assigned a MS/MS identification, the following criteria had to be met: (1) the charge state determined from Sequest or Mascot is identical to the candidate quantifica-tion peptide, (2) the theoretical monoisotopic m/z of the identified peptide and the monoisotopic m/z in the quan-tification Q-TOF data agree within 0.25 Da, (3) the candi-date peptide is found within 2 minutes of its expected location based on the aligned images, (4) the relative positions of neighboring peptides are consistent between the identified peptide and the candidate quantification peptide, (5) no additional peptides fit the above descrip-tion.
Multiple Reaction Monitoring (selected ion monitoring)
Trypsin digested WGA elution fractions from a fourth bio-logical repetition were analyzed on an LTQ using the chromatography conditions described above. For each injection, three MSMS daughter ions from each of two parent ions were monitored. Parent ions were subjected to CID (collision energy = 35%, Q = 0.25, time = 30 ms, isolation width = 3) and a limited range of m/z data, from -0.5 Da to +1.5 Da of the theoretical monoisotopic m/z of the daughter ion, was collected. Peptides were quantified by determining the area (total ion current) under the chromatographic peak for each transition in QualBrowser (Thermo), after baseline subtraction (polynomial order: 2; 10% below curve; tolerance: 0.01), smoothing (boxcar; 5 points), and peak identification (baseline window: 40; area noise factor: 3; peak noise factor: 10;). All analyses were performed in duplicate and peak areas for each tran-sition were averaged. Peptide abundance ratios were cal-culated by dividing the peak area of each transition in the TGF-β sample by that from the CTL sample. Average ratios and standard deviations were calculated using all 3 transi-tions originating from the same parent ion.
Results and discussion
Phenotypic effects of TGF- treatment on BRI-JM01 and NMuMG cells
Both the BRI-JM01 and NMuMG cells adopt a spindle-shape fibroblast-like morphology after 24 hrs in the
pres-ence of TGF-β1, as shown by phase contrast microscopy (Figure 1). This morphological change is accompanied by the down-regulation of various epithelial proteins (e.g. E-cadherin, tight junction protein ZO-1, and specific kerat-ins), and the up-regulation of mesenchymal proteins (e.g. fibronectin, fibroblast-specific protein 1, α-smooth mus-cle actin and vimentin) [31]. The acquisition of this fibroblast-like phenotype correlates with increased cell motility in these cell lines [7,8], and in general allows epi-thelial cells to escape the structural limitations imposed by the existing tissue architecture. Motility and the ability to degrade the extracellular matrix are common features of invasive cells. Currently, the EMT process is thought to be directly linked to the invasive potential of a cancer cell.
Two-dimensional gel electrophoresis studies: BRI-JM01 cells
To identify EMT-related changes in protein expression in BRI-JM01 cells, our preliminary experiments utilized a tra-ditional proteomics workflow: two dimensional gel elec-trophoresis followed by identification of differentially expressed protein spots by ESI-LC-MS/MS. Initial experi-ments using standard 2DE to separate BRI-JM01 whole cell lysates produced very complex 2-dimensional spot patterns that did not allow us to identify any consistent spot intensity changes after 24 hours of TGF-β treatment. Thus, we performed a phase separation in Triton X-114 to enrich for hydrophobic proteins and added ASB-14, a zwitterionic detergent, to the IEF buffer. We found that ASB-14 helped to solubilize high molecular weight trans-membrane proteins and small trans-membrane-associated pro-teins, such as the lipid-modified monomeric G-proteins (data not shown). Examples of the 2D-gels analyzed in these experiments are shown in Supplementary Figure 1 (see Additional File 1). Even after hydrophobic protein enrichment, only five proteins showed a consistent change in spot intensity after analysis of gels spanning two pH ranges (3–6 and 5–8) from three biological repeti-tions. All five differentially expressed proteins were up-regulated upon TGF-β treatment and included Integrin α2, Integrin α5, activated leukocyte cell adhesion mole-cule (ALCAM), Tropomodulin-3, and 14-3-3σ. All of the changes identified in this 2DE study were subsequently validated by western blotting of BRI-JM01 whole cell lysates, as shown in Figure 2. Of the five proteins identi-fied, three are cell surface glycoproteins, suggesting that this subset of proteins may undergo more changes in pro-tein expression than soluble, cytoplasmic propro-teins.
Enrichment of glycoproteins from mouse breast epithelial cells undergoing EMT
Based on the results of our 2DE study, we chose to focus our analysis on glycoproteins, many of which are present on the cell surface or in the extracellular milieu. To do this, we enriched for glycoproteins using the lectin, wheat
germ agglutinin (WGA). To eliminate the difficulties of separating hydrophobic membrane proteins by 2DE, we chose to quantify proteins by using a gel-free mass spec-trometry-based method. We also expanded our experi-ments to include NMuMG cells to allow for comparison between two independently-derived cell lines that both undergo EMT in response to TGF-β. The workflow used in this analysis is summarized in Figure 3. Briefly, we com-pared peptide intensities in the WGA enriched fraction from both control and TGF-β treated cells (24 hour treat-ment) using a label-free approach to quantify individual peptide ions, i.e. the MS signal was integrated under the chromatographic peak in separate, subsequent LC-MS runs. Label-free quantification has many advantages over isotope labels, including minimal sample handling, the ability to compare multiple samples, increased protein coverage, and lower cost.
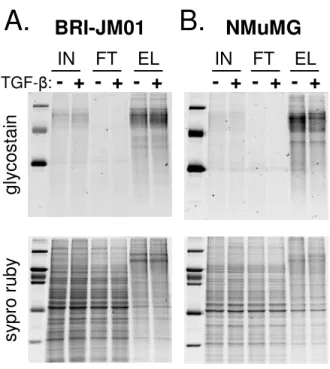
To confirm the efficient enrichment of glycoproteins from cell lysates of BRI-JM01 and NMuMG cells, we visualized proteins in the unfractionated cell lysate (input), WGA flow-through, and WGA elution fraction using a glyco-sylation-specific staining procedure (Figure 4). As expected, glycoproteins were depleted in the flow-through fractions and enriched in the elution fractions. Subse-quent staining of the same gel with Sypro Ruby to visual-ize the total protein content of each fraction showed that each lane contained a similar amount of total protein. The overall protein banding pattern in the WGA eluant frac-tion was distinct from the banding pattern in the input and flow-through, confirming that a unique subpopula-tion of proteins is enriched by WGA. Interestingly, the majority of proteins appear to be unchanged in abun-dance after treatment with TGF-β.
BRI-JM01 and NMuMG cells undergo epithelial-to-mesenchymal transition upon treatment with 100 pM TGF-β1 for 24 hours
Figure 1
BRI-JM01 and NMuMG cells undergo epithelial-to-mesenchymal transition upon treatment with 100 pM
TGF-β1 for 24 hours. After TGF-TGF-β1 treatment, both cell lines acquire a spindle-shape morphology, as shown by phase contrast microscopy.
BRI-JM01
NMuMG
Control
TGF-β
(100 pM)
Following digestion with trypsin, the WGA eluant frac-tions were analyzed in triplicate by LC-MS. A portion of the LC-MS data for each sample is shown in two-dimen-sional representation in Supplementary Figure 2 (see Additional File 1). The peptide maps from the control and TGF-β-treated samples derived from the same cell line dis-played a high degree of similarity to each other, consistent with the gel protein staining patterns (Figure 4). However, the overall peptide elution patterns from the BRI-JM01 and NMuMG cells were quite different, indicating signifi-cant differences in WGA-binding glycoprotein content and abundance between these two cell lines.
Quantitative analysis: statistical analysis of matched peptide sets
To estimate the quantitative error associated with the WGA workflow, we processed two cell pellets harvested from the same batch of control treated NMuMG cells (referred to as 'CTL-1' and 'CTL-2') in parallel with a TGF-β-treated sample. Theoretically, since CTL-1 and CTL-2 are derived from identically-prepared cells, all proteins should have the same abundance in both samples. Thus, any differences in peptide abundance presumably result from experimental error originating from the lectin affin-ity step or the LC-MS quantification. In contrast, abun-dance differences between the TGF-β-treated sample and the CTL samples would result from a combination of
experimental error and true changes in protein abundance induced by the TGF-β treatment.
In this experiment, 2733 multiply-charged ions were matched and quantified in all three samples (CTL1, CTL2, and TGF-β). Of these, 273 ions were differentially-expressed between the CTL-1 and CTL-2 samples with a fold change greater than 68% (|log2 ratio| > 0.75) and a p value of < 0.05. With these same fold change and p-value cut-offs, 737 ions were differentially expressed between the CTL-1 and TGF-β samples. The results from the CTL-1/ CTL-2 comparison, where no peptide ions are expected to be truly differentially expressed, suggest that 273 of the 737 differentially expressed ions identified in the TGF-β/ CTL-1 comparison are probably false positives and, there-fore, are not truly differentially expressed. On the other hand, 464 of these ions (737 minus 273) likely represent true changes in peptide abundance induced by TGF-β. Fig-Protein expression changes associated with TGF-β mediated
EMT in BRI-JM01 cells, identified by 2DE
Figure 2
Protein expression changes associated with TGF-β mediated EMT in BRI-JM01 cells, identified by 2DE.
2DE studies identified 5 proteins that changed in expression after 24 hours of TGF-β treatment. Protein ratios (TGF-β/ CTL) calculated from the 2DE data is shown in the left-hand column. All protein changes were subsequently verified by western blotting of BRI-JM01 cell lysates from 2 biological repeats, as shown. β-actin was used as a loading control (LC).
Int-α2 Int-α5 ALCAM Tropo3 14-3-3σ β-Actin CTL Tβ CTL Tβ Biological repetitions Fold-change (2DE) 2.1 1.8 2.9 5.1 3 (LC)
Schematic of the lectin affinity workflow
Figure 3
Schematic of the lectin affinity workflow. Immobilized
wheat germ agglutinin was used to enrich glycosylated pro-teins from BRI-JM01 and NMuMg cells with or without the induction of EMT by TGF-β. Peptides in the WGA eluant were then quantified from nano-LC-MS data using a software package developed in-house, MatchRx, to identify differen-tially-expressed peptides. lectin affinity enrichment (WGA) BRI-JM01/ NMuMG cells Control (CTL) +TGF-β trypsin nano-LC-MS analysis (Q-TOF) (3 MS replicates/sample) Quantitation of peptide elution profiles Quantitation of peptide elution profiles
Matching of peptides across data files
Determination of differentially expressed peptide peaks
Identification of differentially-expressed peptides by MSMS
(1) include list (Q-TOF) (2) auto-MSMS (LTQ/Q-TOF) x 3 bi ol o g ical repet it ions trypsin M a tc hR x s of tw are
ure 5A shows the number of ions that pass 13 different cri-teria for differential expression, each cricri-teria using a different set of fold change and p-value cut-offs. Impor-tantly, the number of ions found to be differentially expressed between the CTL-1 and TGF-β sample is consist-ently higher than the number of ions found to be differ-entially expressed between CTL-1 and CTL-2, demonstrating that peptide expression changes induced by treatment with TGF-β can be detected. The estimated number of truly differentially expressed ions identified by each set of cut-off values is shown above the data bars in Figure 5A. In general, when stringent cut-off values are used, such as a lower p-value or a higher fold change, the estimated number of false positives is lower. However, more forgiving cut-off values identified a larger number of ions that are potentially differentially expressed in response to TGF-β treatment. This trade-off between
sen-sitivity (the ability to detect differentially expressed pep-tides) and selectivity (minimizing false positive findings) is a common issue in proteomic studies.
To identify glycoproteins that are differentially expressed upon TGF-β treatment, WGA enriched fractions from three separate biological repetitions (BR1, BR2, and BR3) in both the BRI-JM01 and NMuMG cell lines were ana-lyzed and the decision tree shown in Figure 5B was applied. To maximize our sensitivity, we applied two sets of cut-off values to identify differentially-expressed pep-tides. The use of 2 filters at the peptide level allowed for the identification of proteins that are more strongly regu-lated, but represented by only a few peptides (Filter A), as well as proteins that are more weakly regulated, but repre-sented by larger number of peptides that lend statistical weight to the findings (Filter B). To minimize false posi-tive findings, we took advantage of the additional infor-mation provided by quantification of multiple peptides from a single protein, as well as quantification of the same peptide in multiple biological repetitions. At the protein level, we required the presence of statistically significant differentially-expressed peptides in at least 2 biological repetitions, with the third biological repeat showing the same upward or downward trend (see Figure 5B).
Identification and validation of WGA binding proteins that are differentially expressed after induction of EMT by
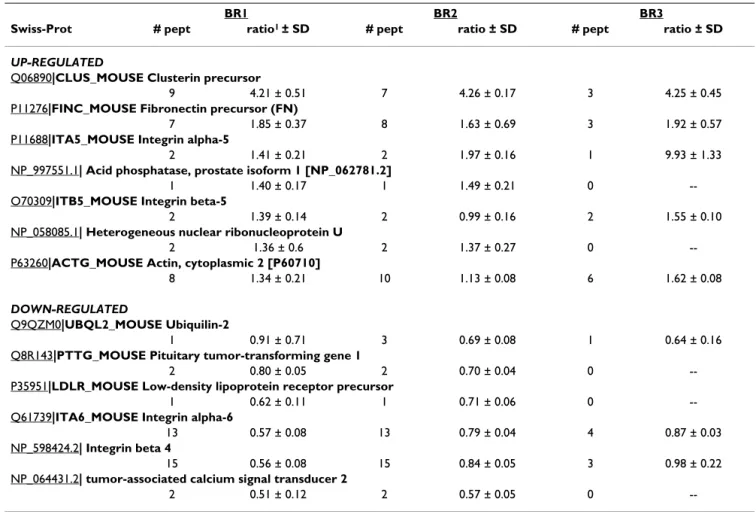
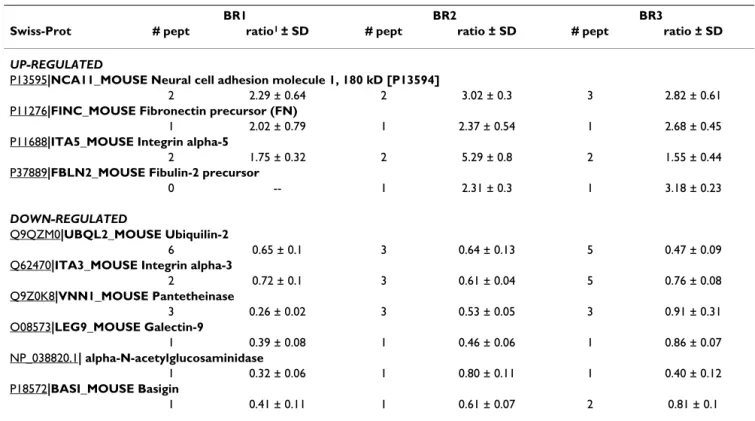
TGF-Overall, 144 proteins were quantified from the WGA elu-tion fracelu-tion of the BRI-JM01 cell line and 97 proteins were quantified from the NMuMG cell line, in a mini-mum of 2 biological repetitions. Application of the deci-sion tree described above led to the identification of several proteins as being regulated by TGF-β treatment in BRI-JM01 and NMuMG cells, as shown in Table 1 and Table 2 respectively. Details on the individual peptides that were identified, including database searching scores and peptide-level quantitative information, are available in Additional File 2. Interestingly, relatively few proteins were found to be differentially expressed in these experi-ments. This finding is likely the result of a combination of factors, including our decision to make conservative choices in the decision tree, as well as the fact that the observed fold-changes are small for most of the differen-tially expressed proteins.
Figure 6 shows representative LC-MS quantitative data for two down-regulated proteins that were identified by a sin-gle peptide: low-density lipoprotein receptor (LDLR) in BRI-JM01 cells and α-N-acetylglucosaminidase in NMuMG cells. For each of these peptides, the MS signal is consistently lower in the TGF-β sample than the control sample in multiple biological repetitions. The LDLR pep-tide was not visible in the third biological repetition, pos-Effective enrichment of glycoproteins by WGA lectin affinity
workflow
Figure 4
Effective enrichment of glycoproteins by WGA lectin affinity workflow. Immobilized wheat germ agglutinin was
used to enrich glycosylated proteins from BRI-JM01 and NMuMG cells with or without the induction of EMT by TGF-β. Proteins from control and TGF-β treated BRI-JM01 (A) and NMuMG (B) cells were fractionated on a WGA affinity column. To determine the efficiency of glycoprotein enrich-ment by WGA, proteins from the unfractionated cellular lysate (input, 'IN'), the WGA flow-through ('FT') fraction, and WGA elution ('EL') fraction were separated by SDS-PAGE and visualized by both a glycoprotein-specific stain and Sypro Ruby, a total protein stain.
NMuMG
BRI-JM01
gly
c
o
s
tai
n
sy
pr
o
ru
b
y
TGF-β:
- + - + - + - + - + - +
IN FT EL IN FT EL
A.
B.
Statistical analysis and decision-making tree used to identify protein expression changes in glycoprotein enriched fractions by a label-free LC-MS approach
Figure 5
Statistical analysis and decision-making tree used to identify protein expression changes in glycoprotein enriched fractions by a label-free LC-MS approach. (A) Comparison of the number of differentially-expressed
multiply-charged ions identified when different cut-off values for fold change (displayed as |log2(TGF-β/CTL)|) and p value are used (gray
bars). As an estimate of the number of false positives identified with each set of cutoff values, two separately prepared control samples (CTL-1 and CTL-2) were analyzed in a similar fashion (black bars). The difference between the number of differen-tially-expressed ions identified in the TGF-β/CTL comparison and the CTL-2/CTL-1 comparison is shown above each set of bars and represents the number of real, truly differentially expressed ions. (B) The decision tree used to determine whether a given protein is differentially-expressed is shown. Briefly, all peptides that were identified in any given biological repeats were used to determine initial statistical significance. Subsequent filtering then required that differentially-expressed peptides were identified in at least 2 biological repeats and that the remaining biological repeat showed a consistent trend towards up- or down-regulation.
Is p<0.05 and |log2ratio| > 0.75 (filter A) or 0.35 (filter B)?
Group all peptides derived from the same protein
What is the likelihood of seeing the # of changing peptides (relative to the # of unchanging peptides) for each protein? Choose cut-off values (‘filters’)
>0.05 <0.05
Protein not differentially expressed Are there changing peptides in
at least 2 biological repeats
no yes
Do biological repeats show a consistent
trend (up or down-regulated) no
Protein is differentially expressed
yes no
changing peptide unchanging peptide
Estimate false positive rate
In CTL1 vs. CTL2 experiment, what proportion of peptides would be considered changing?
Estimate false positive rates for filter: Apply Filter to all identified peptides:
yes 168 175 176 302 315 312 348 375 368 464 516 490 0 200 400 600 800 1000 1200 1400 0.0 01/0.7 5 0.0 01/0.5 0.0 01/0.3 5 0.0 05/0.7 5 0.0 05/0.5 0.0 05/0.3 5 0.0 1/0.75 0.01/0.5 0.0 1/0.35 0.0 5/0.750.05/0.5 0.0 5/0.35 0.0 8/0.35 # di ff e re nt ia ll y expr essed pe pt id es CTL1 vs. TGF-β CTL1 vs. CTL2 507
A.
B.
sibly due to poorer chromatographic resolution for this repetition, relative to the others.
Approximately 70% of the proteins in Table 1 and Table 2 are known to be glycoproteins containing N-linked glyco-sylation sites. The remaining proteins consist of proteins that physically bind to glycoproteins, such as Galectin-9 and Ubiquilin 2, or abundant cytoskeletal proteins, such as actin, which may also form complexes with glyco-sylated proteins. Alternatively, the presence of these abun-dant proteins may also result from non-specific binding to the WGA resin.
To further validate the findings from this study, we used four different methods: comparison to microarray data, multiple reaction monitoring (MRM), western blotting, and immunofluorescence microscopy. First, we deter-mined whether microarray experiments which had previ-ously been performed on the BRI-JM01 cell system revealed up- or down-regulation of the mRNA transcripts that encode for the proteins in Table 1. In the microarray study, we evaluated the transcriptional changes in BRI-JM01 cells exposed for 0.5, 1, 2, 4, 6, 12, and 24 hrs to
TGF-β1 using cDNA microarrays containing 15,264 sequence verified mouse ESTs (University Health Network Microarray Centre in Toronto; http://www.microar rays.ca/). Data was normalized (Lowess algorithm) and 328 significantly modulated genes were identified (False Discovery Rate < 10%) with minimally a 1.3 fold-varia-tion in at least one of the time points, using the SAM one class algorithm (GeneSpring, Agilent Technologies). We found that 4 of the proteins found to be differentially expressed in this WGA study showed analogous statisti-cally-significant changes in mRNA transcript levels (Len-ferink et al., manuscript in preparation). These proteins include Clusterin, Fibronectin, Integrin α5, and Integrin α6, whose mRNA levels were modulated 6.5, 1.35, 3.74, and 0.52-fold, respectively.
Since microarray data was not available in house for the conditions used in this study with the NMuMG cells, we chose to validate some of the proteins in Table 2 using a mass spectrometry-based multiple reaction monitoring (MRM) approach. For these experiments, glycoproteins from CTL and TGF-β-treated NMuMG cells from a fourth biological repetition were enriched using WGA and three
Table 1: Protein expression changes induced by TGF-β (24 hour treatment) in BRI-JM01 cells, identified by WGA affinity workflow.
BR1 BR2 BR3
Swiss-Prot # pept ratio1 ± SD # pept ratio ± SD # pept ratio ± SD
UP-REGULATED
Q06890|CLUS_MOUSE Clusterin precursor
9 4.21 ± 0.51 7 4.26 ± 0.17 3 4.25 ± 0.45
P11276|FINC_MOUSE Fibronectin precursor (FN)
7 1.85 ± 0.37 8 1.63 ± 0.69 3 1.92 ± 0.57
P11688|ITA5_MOUSE Integrin alpha-5
2 1.41 ± 0.21 2 1.97 ± 0.16 1 9.93 ± 1.33
NP_997551.1| Acid phosphatase, prostate isoform 1 [NP_062781.2]
1 1.40 ± 0.17 1 1.49 ± 0.21 0
--O70309|ITB5_MOUSE Integrin beta-5
2 1.39 ± 0.14 2 0.99 ± 0.16 2 1.55 ± 0.10
NP_058085.1| Heterogeneous nuclear ribonucleoprotein U
2 1.36 ± 0.6 2 1.37 ± 0.27 0
--P63260|ACTG_MOUSE Actin, cytoplasmic 2 [P60710]
8 1.34 ± 0.21 10 1.13 ± 0.08 6 1.62 ± 0.08
DOWN-REGULATED
Q9QZM0|UBQL2_MOUSE Ubiquilin-2
1 0.91 ± 0.71 3 0.69 ± 0.08 1 0.64 ± 0.16
Q8R143|PTTG_MOUSE Pituitary tumor-transforming gene 1
2 0.80 ± 0.05 2 0.70 ± 0.04 0
--P35951|LDLR_MOUSE Low-density lipoprotein receptor precursor
1 0.62 ± 0.11 1 0.71 ± 0.06 0
--Q61739|ITA6_MOUSE Integrin alpha-6
13 0.57 ± 0.08 13 0.79 ± 0.04 4 0.87 ± 0.03
NP_598424.2| Integrin beta 4
15 0.56 ± 0.08 15 0.84 ± 0.05 3 0.98 ± 0.22
NP_064431.2| tumor-associated calcium signal transducer 2
2 0.51 ± 0.12 2 0.57 ± 0.05 0
fragment-ions from peptides derived from Neural cell adhesion molecule (NCAM), Fibronectin, Fibulin-2, Pan-thetheinase, Galectin-9, and alpha-N-glycosaminidase were selectively monitored. In each case, the MRM analy-sis agreed very well with the LC-MS quantification from the first 3 biological repetitions, as shown in Figure 7A. In
this figure, log2 of the ratio of peptide abundance in
TGF-β-treated NMuMG cells, relative to CTL cells, is plotted.
Thus, peptides with a positive log2 ratio are up-regulated
and peptides with a negative log2 ratio are
down-regu-lated. Attempts to monitor these same ions in the unfrac-tionated NMuMG cell lysate were not successful due to high background noise levels that swamped out the signal from the specific transition being monitored. The high noise level is likely due to the nature of the ion trap mass selection, which first fills the trap with all ions being pro-duced before selectively isolating the ion of interest. Thus, unlike a triple quadrupole instrument, the sensitivity is limited by both the complexity of the total ions being pro-duced and the number of ions that can be contained in the trap. Nonetheless, we found that MRM in an ion trap instrument worked well to confirm findings in our WGA elution fractions.
Four proteins were validated by western blot analysis. In JM01 cells, the protein levels of Integrin β4 were con-firmed to be down-regulated whereas those of Integrin β5 were up-regulated. In NMuMG cells, both Basigin and Integrin α3, were confirmed to be down-regulated (Figure
7B). Importantly, Integrin β5, Basigin, and Integrin α3 are modulated in the unfractionated cellular lysate ('input'). This finding demonstrates that the expression level of these proteins is regulated upon the induction of EMT. In contrast, Integrin β4 appears to be selectively down-regu-lated in the lectin-enriched fraction, suggestive of a modi-fication in glycan structure that affects the affinity of Integrin β4 binding to WGA. Without this validation data from the cell lysate, we can not definitively distinguish between changes in protein expression levels and changes in glycosylation status. A change in a protein's binding affinity for WGA could change if the glycosylation of a protein is modified, either by a change in glycan site occu-pancy or by a change in glycan structure. Glycosylation modifications such as these would result in a change in abundance in the WGA elution fraction, but would not affect the total protein expression level in the cell lysate. We believe that most of the proteins found to be regulated using this experimental approach are observed due to overall changes in protein expression levels, rather than changes in glycosylation status, since we were able to val-idate the majority by microarray or western blot analysis as having their expression level changed. However, we can not eliminate modifications in glycosylation for some of the proteins listed in Tables 1 and 2.
Immunofluorescence microscopy was also used to vali-date expression changes in several of the proteins identi-fied by the WGA workflow. Since the reorganization of
Table 2: Protein expression changes induced by TGF-β (24 hour treatment) in NMuMG cells, identified by WGA affinity workflow.
BR1 BR2 BR3
Swiss-Prot # pept ratio1 ± SD # pept ratio ± SD # pept ratio ± SD
UP-REGULATED
P13595|NCA11_MOUSE Neural cell adhesion molecule 1, 180 kD [P13594]
2 2.29 ± 0.64 2 3.02 ± 0.3 3 2.82 ± 0.61
P11276|FINC_MOUSE Fibronectin precursor (FN)
1 2.02 ± 0.79 1 2.37 ± 0.54 1 2.68 ± 0.45
P11688|ITA5_MOUSE Integrin alpha-5
2 1.75 ± 0.32 2 5.29 ± 0.8 2 1.55 ± 0.44
P37889|FBLN2_MOUSE Fibulin-2 precursor
0 -- 1 2.31 ± 0.3 1 3.18 ± 0.23
DOWN-REGULATED
Q9QZM0|UBQL2_MOUSE Ubiquilin-2
6 0.65 ± 0.1 3 0.64 ± 0.13 5 0.47 ± 0.09
Q62470|ITA3_MOUSE Integrin alpha-3
2 0.72 ± 0.1 3 0.61 ± 0.04 5 0.76 ± 0.08 Q9Z0K8|VNN1_MOUSE Pantetheinase 3 0.26 ± 0.02 3 0.53 ± 0.05 3 0.91 ± 0.31 O08573|LEG9_MOUSE Galectin-9 1 0.39 ± 0.08 1 0.46 ± 0.06 1 0.86 ± 0.07 NP_038820.1| alpha-N-acetylglucosaminidase 1 0.32 ± 0.06 1 0.80 ± 0.11 1 0.40 ± 0.12 P18572|BASI_MOUSE Basigin 1 0.41 ± 0.11 1 0.61 ± 0.07 2 0.81 ± 0.1 1abundance in TGF-β/abundance in CTL
filamentous actin (F-actin) is one of the hallmarks of a TGF-β induced EMT, we visualized F-actin using rhodam-ine-conjugated phalloidin. Figure 7C (JM01, top panel) and 7D (NMuMG, top panel) show the rearrangement of F-actin in both the JM01 and NMuMG cells upon the treatment with TGF-β (24 hrs), confirming that EMT has occurred. We then demonstrated increased Clusterin and Integrin β5 protein levels and decreased levels of Integrin α6 in JM01 cells (Figure 7C) and the up-regulation of Fibronectin and NCAM and down-regulation of Integrin α3 in NMuMG cells (Figure 7D) upon treatment with TGF-β.
A largely distinct list of protein changes was found in the 2DE study and in the lectin study. With the exception of Integrin α5, there was no overlap in the proteins identi-fied. As is becoming increasingly apparent, use of a differ-ent workflow for sample preparation and analysis for proteomic studies tends to identify different subsets of proteins. Thus, there is a clear advantage to using comple-mentary techniques to identify protein expression changes.
Both the 2DE and lectin experiments suggest that the abundance of the vast majority of proteins is not affected by TGF-β treatment. As a whole, TGF-β-induced changes in protein expression were relatively subtle in these cell systems. These subtle changes are consistent with microar-ray studies on the BRI-JM01 cell line. In this study, only 8 out of 328 regulated genes had their transcripts up-regu-lated by more than 2-fold (Lenferink et al., manuscript in preparation). It is also consistent with a proteomic study that used iTRAQ to quantify protein changes in the TGF-β-induced EMT in A549 human lung cancer cells [10]. In this study, only 2 of the 51 regulated proteins identified had a greater than 2-fold change. It seems somewhat sur-prising that the dramatic phenotypic change associated with EMT is able to occur in the presence of only subtle changes in protein abundance. These findings point to the possibility that changes in post-translational modifica-tions, such as glycosylation or phosphorylation, may play a more important role in mediating these phenotypic changes. In fact, glycosylation has been shown to affect cell migration, tumor invasion, and many other cellular processes [32]. The lectin used for enrichment in these experiments, WGA, has a relatively broad binding specifi-city for N-linked glycans and is therefore not particularly well-suited for teasing out modifications to glycan struc-ture. In experiments similar to those presented here, it would be informative to use a variety of lectins that recog-nize more specific glycan structures as an extension of our experimental paradigm. In particular, it would prove interesting to focus on lectins which recognize glycan structures that are known to be altered in cancer.
Biological implications of selected protein expression changes that occur during TGF- induced EMT
Tumors are known to be highly heterogenous at the molecular level, even between tumors with the same his-topathological classification. Accordingly, different cancer cells may utilize distinct molecular mechanisms to achieve similar phenotypic changes characteristic of EMT. Thus, the identification of EMT-associated changes in pro-tein expression that are common among different cell lines should focus on the events that play more central roles in the regulation of tumor cell invasion and metas-tasis. Despite similarities in cell type and phenotypic response to TGF-β, only three proteins were found to be Representative LC-MS quantification data
Figure 6
Representative LC-MS quantification data.
Three-dimensional extracted ion chromatograms, produced by MSight [30] are shown for two peptides that are down-regu-lated upon the induction of EMT by TGF-β. (A) In BRI-JM01 cells, a doubly-charged peptide from the low-density lipopro-tein receptor was identified with m/z of 970.0 m/z, repre-senting the peptide sequence NIYWTDSVPGSVSVADTK. LC-MS data from the first 2 biological repetitions show con-sistently lower MS signal for this peptide upon TGF-β treat-ment. However, the peptide was not found in the third biological repeat. (B) In NMuMG cells, a doubly-charged pep-tide from alpha-N-acetylglucosaminidase was identified with m/z 1167.1, representing the sequence ALADESGLDTYS-LSGGGGVPVLVR. The MS signal corresponding to this pep-tide is consistently lower after induction of EMT by TGF-β than in control cells.
CTL TGF-β CTL TGF-β BR1 BR2 BR3 970.0 2+ 1167.1 2+
Low-density lipoprotein receptor – BRI-JM01 cells
alpha-N-acetylglucosaminidase – NMuMG cells
A.
Validation of TGF-β induced changes in protein expression levels identified by WGA affinity workflow
Figure 7
Validation of TGF-β induced changes in protein expression levels identified by WGA affinity workflow. (A) The
ratio of peptide abundance identified by selectively monitoring three transitions from a peptide by multiple-reaction monitoring (MRM, shown as black bars) derived from each of six proteins is compared to the results from the original analysis of the first three biological repetitions (BR1, white bars; BR2, gray bars, and BR3, hashed bars). Protein ratios are shown as log2 of the ratio of abundance in TGF-β treated NMuMG cells relative to non-treated CTL cells. MRM results are as follows when pre-sented as fold-change ± standard deviation, similar to those shown in Table 2: Neural cell adhesion molecule 1 (NCAM; 2.82 ± 0.22), Fibronectin (3.74 ± 0.51), Fibulin-2 (1.86 ± 0.10), Pantetheinase (0.38 ± 0.03), Galectin-9 (0.33 ± 0.10), and α-N acetylglucosaminidase (0.46 ± 0.04). (B) Western blot analysis of unfractionated cell lysate (IN), WGA flow-through (FT) and elution (EL) fractions of JM01 and NMuMG cells cultured in the absence (-) or presence (+) of TGF-β1 for 24 hrs. The protein levels of Integrin β4 (JM01), Basigin, and Integrin α3 all reduced upon treatment of the cells with TGF-β1, whereas those of Integrin β5 (JM01) increased. Using immunofluorescence microscopy (C, D) the occurrence of EMT in the JM01 and NMuMG was confirmed by the reorganization of the F-actin filaments (red, top panels), and is accompanied by the TGF-β induced upregulation of Clusterin and down-regulation of Integrin α6 in the JM01 cell line (C), and the up-regulation of Fibronectin and NCAM in the NMuMG cell line (D).
A. B. -2 -1 0 1 2 NCAM Fi bro nec ti n F ib u lin -2 P ante thei na se Ga le c tin -9 α -N -ac e ty l-gl ucosam in idase protein log 2 rati o (T GF -β /C T L ) BR1 BR2 BR3 MRM Integrin α6 NCAM Fibronectin F-actin Control TGF-β D. Control TGF-β Clusterin F-actin C. JM01 NMuMG TGF-β: - + - + - + IN FT EL Basigin Integrin α3 JM01 NMuMG Integrin β4 Integrin β5
regulated in a similar manner in both BRI-JM01 and NMuMG cells. This may reflect some biological variation in the mechanisms used to induce EMT by TGF-β in the two cell lines. However, the dissimilarity between the results may also be due to technical reasons. Many pro-teins that were quantified in one cell line were not quan-tified in the other. Also, the conservative choices that we used to define differentially expressed proteins will mean that some differentially-expressed proteins are likely to be missed (were false negatives). This is especially true if fewer peptides belonging to that protein were identified, as would result from differences in the abundance or post-translational modification of a particular protein between the two cell lines. As in the vast majority of proteomic studies, it is possible to list what was observed as changing in these experiments, but more difficult to say what was missed. Thus, additional proteins may be similarly regu-lated in both cell lines, even though they were not found in these experiments.
The three protein changes that were identified in both the BRI-JM01 and NMuMG cell lines are the up-regulation of Fibronectin, the up-regulation of Integrin α5, and the down-regulation of Ubiquilin-2. Fibronectin is a known marker for mesenchymal cells, so its up-regulation during epithelial-to-mesenchymal transition is expected [33]. The expression of Integrin α5 has previously been shown to increase during the TGF-β-induced EMT in Ras-trans-formed EpH4 mammary epithelial cells. Furthermore, blocking the function of Integrin α5 in these cells with an antibody was shown to prevent the induction of EMT upon TGF-β treatment, demonstrating a key role for this protein in EMT progression [34]. Unlike Fibronectin and Integrin α5, Ubiquilin-2 does not have any known ties to EMT or cancer. Little is known about Ubiquilin-2, but it is thought to play a role in regulating protein degradation by physically linking the ubiquitination machinery with the proteasome [35].
In BRI-JM01 cells, the induction of EMT led to protein level expression changes in several members of the Integrin family. Integrins are single-pass type I membrane proteins that function as heteromeric dimers, consisting of an α and β subunit, that play an important role in the regulation of tumor cell invasion by linking the extracel-lular matrix to the cytoskeleton [36,37]. Integrins have previously been shown be involved in the EMT process during murine lens development [38], trophoblast differ-entiation [39], prostate cancer cell migration [40], and tumor stem cell development [41]. In BRI-JM01 cells, TGF-β up-regulated the expression of Integrin α5, Integrin α2, and Integrin β5. To date, one N-linked glycosylation site has been characterized on each of the α chains [42,43] and many reports have demonstrated that N-glycosyla-tion of Integrins affects their biological activity, especially the binding towards ECM macromolecules [44,45].
Inter-estingly, the Integrin heterodimer α5/β1 is associated with the deposition of and adhesion to Fibronectin, a charac-teristic of invasive breast carcinoma cells [34]. Thus, the up-regulation of these Integrin subunits may directly con-tribute to the increased expression of Fibronectin seen in these experiments. In contrast, TGF-β lowered the expres-sion of both Integrin α6 and Integrin β4. Together, these integrins form one of the major cellular receptors for Lam-inin [46]. Interestingly, the level of down-regulation of Integrin α6 and Integrin β4 correlated well with each other in the three biological repeats analyzed possibly indicating a common mechanism regulating their expres-sion. Knock-out mouse studies have shown that the Integrin α6/β4 heterodimer maintains the structural integrity of the epidermis by linking epithelial cells to the basement membrane [47,48]. Thus, lowering expression of α6/β4 may be partially responsible for the lowered cell-cell adhesion seen after EMT. The role of α6/β4 in cancer is more complex – in many cases this integrin is up-regu-lated carcinoma cells, where it may contribute to invasion and motility by regulating intracellular signaling events [49].
One of the largest protein expression changes we observed in the BRI-JM01 cell line is that of Clusterin, a 70–80 kDa glycoprotein that has been implicated in several mecha-nisms that drive carcinogenesis and tumor progression [50]. Clusterin is expressed in a variety of cancers and is associated with broad-spectrum treatment resistance. Custirsen (OGX-011), a 2'-methoxyethyl modified phos-phorothioate antisense oligonucleotide that is comple-mentary to clusterin mRNA, is currently in clinical trails. Despite similarities in the phenotypic changes induced by TGF-β, most protein changes in NMuMG cells appear to be largely distinct from those in BRI-JM01 cells. One of the largest protein expression changes in NMuMG cells is the up-regulation of Neural Cell Adhesion Molecule 1 (NCAM-1). Although NCAM-1 is known to be overex-pressed in many brain cancers, small cell lung cancer, and multiple myeloma, is has not generally been discussed as a marker for breast cancer [51]. Interestingly, many can-cers are known to overexpress a different cell adhesion molecule, called L1, which has been shown to regulate EMT-like events in transformed MCF7 breast carcinoma cells [52]. Intriguingly, NCAM has been shown to enhance the homophilic interaction between L1 mole-cules, suggesting that these 2 cell adhesion molecules may work together to regulate cell-cell interactions [53]. Recently, the up-regulation of NCAM was shown to be the direct result of the loss of adherens junctions. The
cluster-ing of NCAM with p59Fyn in lipid rafts resulted in the
phosphorylation of FAK and the assembly of focal adhe-sions, both of which are required for EMT and cell motil-ity [54].
The WGA workflow also revealed that Fibulin-2 is up-reg-ulated after EMT in NMuMG cells. Fibulin-2 is a member of a family of secreted glycoproteins that interact with extracellular matrix proteins to form intramolecular bridges [55]. Fibulin proteins have been associated with both tumor progression and tumor suppression, a para-dox that may be the result of alternative splicing events, which lead to Fibulin variants with different functional roles [55]. Recently, the loss of Fibulin-2 has been shown to be associated with breast cancer progression [56]. Con-versely, a recent proteomics-based study identified Fibu-lin-2 as a marker for breast cancer in a conditional HER2/ Neu-driven mouse model [57]. The authors of this study were further able to show that Fibulin-2 has promise, not only as a tissue biomarker of cancer, but also as a plasma biomarker.
Although many of the proteins identified as associated with EMT in these experiments have been previously linked to cancer, several have not previously been associ-ated with cancer progression or the EMT process. For example, using 2DE, we found that Tropomodulin 3 is overexpressed upon TGF-β treatment of JM01 cells. Tro-pomodulin 3 (Tmod 3) is a widely expressed protein that caps the pointed ends of actin filaments, as well as bind-ing and sequesterbind-ing actin monomers [58]. Through these interactions, Tmod 3 regulates dynamic actin networks, such as those in the lamellipodia of motile endothelial cells. Interestingly, Tmod 3 is generally thought to act as a negative regulator of cell migration [59]. The fact that TGF-β treatment increases Tmod 3 expression while also increasing cell motility in JM01 cells suggests that cell motility may be regulated by a different mechanism dur-ing the EMT. Another protein that has not been previously linked to cancer progression or EMT is alpha-N-acetylgly-cosaminidase (Naglu), which is down-regulated in NMuMG cells upon the induction of EMT. Naglu is a lys-osomal enzyme required for the degradation of the polysaccharide, heparan sulfate. Mutations in the gene for Naglu are the cause of mucopolysaccharidosis IIIB, a lyso-somal storage disease characterized by buildup of gly-cosaminoglycan[60]. Interestingly, the degradation of extracellular heparan sulfate by another enzyme, hepara-nase, has been strongly linked to breast cancer invasion and progression[61]. Thus, the down-regulation of Naglu may also contribute to cancer progression through the regulation of heparan sulfate metabolism inside the cell.
Conclusion
Using a combination of 2DE and a lectin affinity-MS quantification workflow, we have identified 13 proteins that are up-regulated and 11 proteins that are down-regu-lated in two mouse mammary epithelial cell lines, BRI-JM01 and NMuMG, upon the induction of EMT by TGF-β. Tumors are known to be highly heterogenous, even
between tumors with the same histopathological classifi-cation. By studying the EMT process in two independently isolated cell lines, we aimed at focusing on proteins that are centrally involved in mediating cancer cell motility and invasiveness. Surprisingly, despite strong similarities in phenotypic response to TGF-β (i.e. the acquisition of a fibroblast-like morphology), BRI-JM01 and NMuMG cells undergo largely distinct protein expression changes upon EMT induction. This lack of overlap is likely due in part to the conservative cutoff values used in these experiments, as well as the limitations of analyzing only the subset of proteins that bind to WGA. It is also possible that the two cell lines use somewhat different mechanisms to achieve an EMT transition. This finding highlights the need for analyzing multiple cell lines and systems to find common protein changes in order to identify more useful diagnos-tic markers and therapeudiagnos-tic targets for cancer treatment. To conclude, the study described here demonstrates the use of glycoproteomics to define potential glycoprotein biomarkers and therapeutic targets. The discovery and subsequent validation of such glycoproteins will allow for the development of drug candidates that neutralize their function, as well as diagnostic tools that can be used to monitor disease progression, recurrence, and response to treatment.
Competing interests
The authors declare that they have no competing interests.
Authors' contributions
JJH conceived, designed, and performed the lectin affinity and mass spectrometry work, performed the statistical analysis, participated in the biological discussion, and drafted the manuscript. TLT performed the two-dimen-sional gel studies and participated in the western blot analysis. CC performed the immunofluorescence micros-copy. MO initiated the TGF-beta work and participated in the coordination of the study. JK conceived the focus on glycoproteomics and participated in the coordination of the study. AEL conceived, designed, and performed west-ern blot analysis and cell culture, designed the immun-ofluorescence validation, and participated in the biological discussion. All authors edited the manuscript and approved the final version.
Additional material
Additional file 1
Supplementary Figures 1 and 2. As described in the text, Supplementary
Figure 1 and Supplementary Figure 2 and their corresponding legends are provided in this file.
Click here for file
[http://www.biomedcentral.com/content/supplementary/1477-5956-7-2-S1.pdf]