Publisher’s version / Version de l'éditeur:
ISPRS - International Archives of the Photogrammetry, Remote Sensing and
Spatial Information Sciences, XLI-B5, pp. 99-105, 2016-06-15
READ THESE TERMS AND CONDITIONS CAREFULLY BEFORE USING THIS WEBSITE. https://nrc-publications.canada.ca/eng/copyright
Vous avez des questions? Nous pouvons vous aider. Pour communiquer directement avec un auteur, consultez la première page de la revue dans laquelle son article a été publié afin de trouver ses coordonnées. Si vous n’arrivez pas à les repérer, communiquez avec nous à [email protected].
Questions? Contact the NRC Publications Archive team at
[email protected]. If you wish to email the authors directly, please see the first page of the publication for their contact information.
NRC Publications Archive
Archives des publications du CNRC
This publication could be one of several versions: author’s original, accepted manuscript or the publisher’s version. / La version de cette publication peut être l’une des suivantes : la version prépublication de l’auteur, la version acceptée du manuscrit ou la version de l’éditeur.
For the publisher’s version, please access the DOI link below./ Pour consulter la version de l’éditeur, utilisez le lien DOI ci-dessous.
https://doi.org/10.5194/isprs-archives-XLI-B5-99-2016
Access and use of this website and the material on it are subject to the Terms and Conditions set forth at
Experiments on calibrating tilt-shift lenses for close-range
photogrammetry
Nocerino, E.; Menna, F.; Remondino, F.; Beraldin, J.-A.; Cournoyer, L.;
Reain, G.
https://publications-cnrc.canada.ca/fra/droits
L’accès à ce site Web et l’utilisation de son contenu sont assujettis aux conditions présentées dans le site
LISEZ CES CONDITIONS ATTENTIVEMENT AVANT D’UTILISER CE SITE WEB.
NRC Publications Record / Notice d'Archives des publications de CNRC:
https://nrc-publications.canada.ca/eng/view/object/?id=6f196209-8a6d-4076-b1b9-a5ad6dd48a9d
https://publications-cnrc.canada.ca/fra/voir/objet/?id=6f196209-8a6d-4076-b1b9-a5ad6dd48a9d
EXPERIMENTS ON CALIBRATING TILT-SHIFT LENSES FOR CLOSE-RANGE
PHOTOGRAMMETRY
E. Nocerino a, *, F. Menna a, F. Remondino a, J.-A. Beraldin b, L. Cournoyer b, G. Reain b
a 3D Optical Metrology (3DOM) unit, Bruno Kessler Foundation (FBK), Trento, Italy – Email: (nocerino, fmenna, remondino)@fbk.eu, Web: http://3dom.fbk.eu
b National Research Council, Ottawa, K1A 0R6, Canada – Email: (Angelo.Beraldin, Luc.Cournoyer, Greg.Reain)@nrc-cnrc.gc.ca
Commission V, WG 1
KEY WORDS: Tilt-shift lens, Scheimpflug principle, Close range photogrammetry, Brown model, Pinhole camera, Calibration, Accuracy, Precision, Relative accuracy
ABSTRACT:
One of the strongest limiting factors in close range photogrammetry (CRP) is the depth of field (DOF), especially at very small object distance. When using standard digital cameras and lens, for a specific camera – lens combination, the only way to control the extent of the zone of sharp focus in object space is to reduce the aperture of the lens. However, this strategy is often not sufficient; moreover, in many cases it is not fully advisable. In fact, when the aperture is closed down, images lose sharpness because of diffraction. Furthermore, the exposure time must be lowered (susceptibility to vibrations) and the ISO increased (electronic noise may increase). In order to adapt the shape of the DOF to the subject of interest, the Scheimpflug rule is to be applied, requiring that the optical axis must be no longer perpendicular to the image plane. Nowadays, specific lenses exist that allow inclining the optical axis to modify the DOF: they are called tilt-shift lenses. In this paper, an investigation on the applicability of the classic photogrammetric model (pinhole camera coupled with Brown’s distortion model) to these lenses is presented. Tests were carried out in an environmentally controlled metrology laboratory at the National Research Council (NRC) Canada and the results are hereafter described in detail.
1. INTRODUCTION
Close-range photogrammetry (CRP) is a powerful technology because of its flexibility for speedy reconfiguration and the possibility to accomplish very demanding tasks while keeping the costs reasonable. It is an established technology worldwide for 3D recording in industrial/engineering as well as in cultural heritage applications. Nevertheless, when the imaging distance is small (less than 2 m), the depth of field (DOF), i.e. the axial (longitudinal) resolving power of the employed optical system, becomes a strong limiting factor. DOF extends in front of the camera and can be visualized as a prism with two faces parallel to the sensor plane. The portion of object that falls into the solid will be rendered adequately sharp, or in other words with enough detail in the image.
A way for controlling and adapting the DOF to the scene of interest is to use the so called camera movements (Ray, 2002), i.e. translational and rotational movements both of the lens and
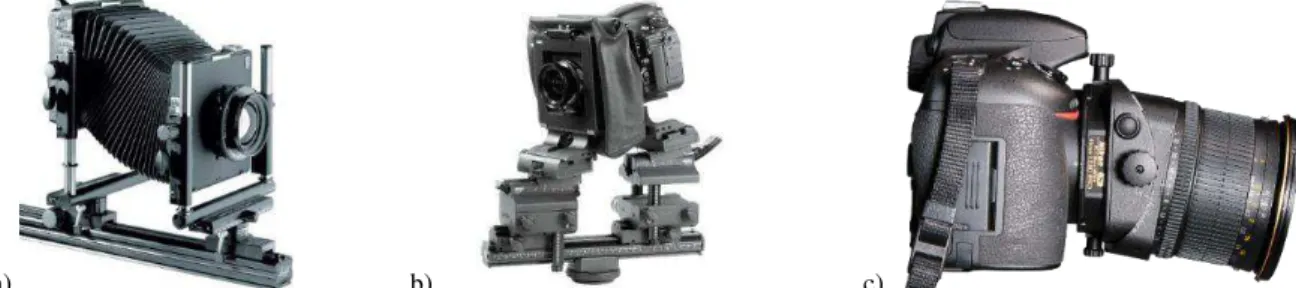
image plane. Camera movements are possible when using view or technical cameras, which are large format cameras where the lens, usually mounted on a folding baseboard or a monorail (Figure 1a), projects the image on a ground glass to allow for focusing. Once the focus is set, the ground glass is replaced by the film holder. View cameras are mainly used by professional photographers in studio or for architectural photography. Even if adapters are now available for digital single-lens reflex (DSLR) cameras (Figure 1b), these systems are not very suitable for photogrammetry due to their low flexibility and portability. A more practicable solution is represented by tilt-shift lenses (Figure 1c), also called perspective control (PC) lenses, which are available for smaller camera format (e.g., 35 mm or full frame) and allow for some of the view camera movements. In particular, by rotating the tilt-shift lens of a proper angle, an inclined subject may be fitted within the optical system DOF, according to the Scheimpflug rule.
a) b) c)
Figure 1. a) Linhof Kardan E view camera (http://www.fotografie-boerse.de/angebote_30_4/). b) Cambo Ultima 35: adapter for DSLR cameras (https://cambouk.wordpress.com/2013/09/26/cambo-special-offer-ultima-35-camera-bundles/). c) DSRL camera (Nikon D750) with a tilt-shift lens
(PC-E Micro NIKKOR 45mm f/2.8D ED).
* Corresponding author
The International Archives of the Photogrammetry, Remote Sensing and Spatial Information Sciences, Volume XLI-B5, 2016 XXIII ISPRS Congress, 12–19 July 2016, Prague, Czech Republic
This paper presents the first results of a wide experimental study conducted in an environmentally controlled metrology laboratory at the National Research Council (NRC) Canada to investigate the metric capability and benefits of tilt-shift lenses. Several experiments evaluated the overall performance of a DSLR camera equipped with a tilt-shift lens, using quality parameters for measurement uncertainties, i.e. accuracy and precision. To rigorously model the image formation when the Scheimpflug principle is employed, the actual angle between the optical axis and the image plane should be included in the mathematical formulation. Neglecting this angle would certainly introduce systematic errors in the photogrammetric measurement process. Nevertheless, if this angle is bounded to a range of ±4 degrees for most practical uses, the error introduced might be limited and compensated by calibration parameters. Such evaluation has not been done until now and therefore the present investigation aims at evaluating if the most popular photogrammetric model, i.e. the pinhole camera coupled with Brown’s formulation for lens distortion, can be considered still valid for tilt-shift lenses and to which extent.
The rest of the paper is structured as follows. Section 2 reports the motivations behind the study, along with a discussion on DOF, Scheimpflug condition and tilt-shift lenses. Section 3 presents the experiments, with particular emphasis on the photographic equipment, the calibration fixture specifically designed for the tests and the acquisition protocol adopted. Finally (Section 4), the results of the experimental investigation are presented and discussed.
2. MOTIVATION AND BACKGROUND
The aim of the collaborative research between FBK and NRC is to explore the use of Scheimpflug rule, a well-known principle commonly exploited in “artistic” and professional photography (Merklinger, 1996; Evens, 2008) as well as active triangulation scanning technique (Dremel et al., 1986; Rioux et al., 1987; Albers et al., 2015) and particle image velocimetry – PIV (Fournel et al., 2004; Louhichi et al., 2007; Astarita, 2012; Hamrouni et al., 2012), but not yet adequately investigated in CRP.
2.1 DOF and Scheimpflug rule
DOF is the distance between the nearest and farthest object planes still in focus, i.e. the distance between the nearest and farthest objects in a scene that appear acceptably sharp in an image. Sharpness can be defined as the quality for which adequate resolved details and, hence, information content, are provided by the image. In absence of other degrading factors (aberrations, camera shake, etc.) sharpness only depends on correctly focusing the subject of interest. From a physical point of view, a lens can precisely focus at only one distance: there exists only one specific distance where a point in object space is imaged in the image plane as a sharp point. At any other distances, an object point produces a blur circular spot, which means that the point is defocused. When the diameter of the circular spot is sufficiently small, the spot is indistinguishable from a point, and appears to be in focus. The decrease in sharpness is gradual on either side of the focused distance, so that it can be considered that the object is “acceptably sharp” within the DOF. The diameter of the circle increases with distance from the plane of focus; the largest circle that is indistinguishable from a point is known as the acceptable circle of confusion (COC)
1 image magnification is defined as the ratio between elements in image
space and the counterpart in object space
(Figure 2). The concept of COC goes back to analogue photography and to the printing and enlargement (or magnification) of film. The value of COC or blur circle is originally defined according to the finer detail that is visible by human eye at a comfortable vision distance on a printed and magnified photograph. It depends on the camera format and lens used. COC typical values for different analogue camera formats are provided in Ray (2002). For digital cameras, COC is usually taken as around 1-3 pixels (Menna et al., 2012; Luhmann et al., 2014).
Figure 2. COC and DOF for a lens focused at finite distance.
According to Ray (2002, page 218), DOF can be computed according to equation (1): � = ���� − ��� = ∙ ∙ ∙ �� �∙ − �� � ∙ ∙ (1) where:
- ���� and ��� are the far and near limits of DOF, respectively;
- is the lens focal length; - is the focusing distance; - � � � is lens relative aperture.
For large object distance, equation (1) can be simplified to (Ray, 2002; Luhmann et al., 2014):
� ≈ ∙ ∙ �� �∙ ⁄ (2) In this case, it can be easily argued that the DOF increases with the COC, the f-number and the square of focusing distance, while decreases when the focal length grows. When working in close up photogrammetry, which corresponds typically to a magnification1 range of 0.1-1 and object distance range of 1000 mm - 10 mm (Ray, 2002), DOF is very limited.
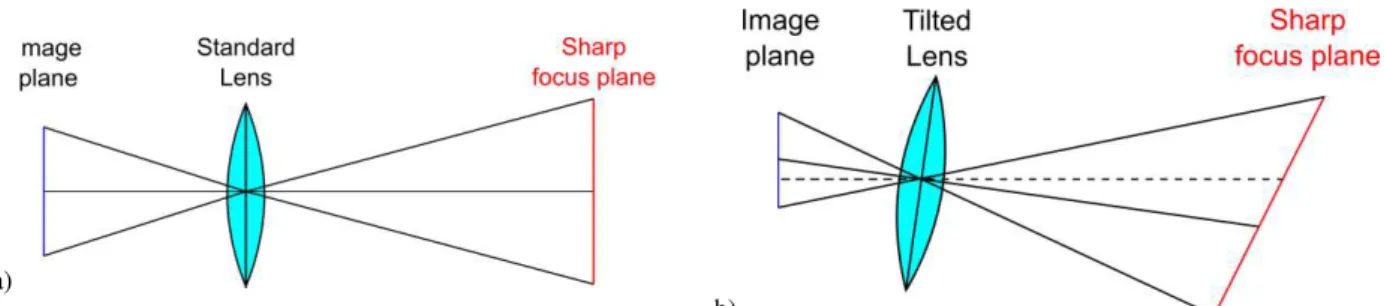
In an ordinary camera setup, the points in space that are in focus ideally lie in a plane parallel to the image plane and, once decided the focal length, the desired DOF is generally accomplished changing the f-stop value. A smaller aperture yields a greater DOF but may lead to diffraction that in turn leads to a loss of image detail (Luhmann et al., 2014). In CRP, usually the objects to be surveyed are three-dimensional and of varying depth, but a perfectly sharp image is obtained only for the part of the object that is within the DOF. According to the Scheimpflug rule, by tilting the lens so that its axis is no longer perpendicular to the plane of the sensitive media, film or digital sensor (Figure 3), the DOF can be optimized. This condition is realised when the image plane, the lens plane and the plane of sharp focus meet in a single line. Through the tilting of the DOF zone at the proper angle, the spatial extent of the DOF can be adapted to the real shape and extent of the scene (Figure 4). When the Scheimpflug condition is applied, the far and near planes that limit the DOF are no longer parallel, but they intersect, along with the plane of sharp focus, in the so-called hinge line (Merklinger, 1996).
The International Archives of the Photogrammetry, Remote Sensing and Spatial Information Sciences, Volume XLI-B5, 2016 XXIII ISPRS Congress, 12–19 July 2016, Prague, Czech Republic
a)
b)
Figure 3 – With an ordinary camera lens the plane of focus is parallel to the image plane (a). Scheimpflug principle: plane of focus of an optical system tilts when the lens plane is not parallel to the image plane (b).
a)
b) Tilt = 0°, Shift = 0mm, Rotation = 0° c) Tilt = -8°, Shift = 0mm, Rotation = +90°
Figure 4 – Example of DOF improvement with the use of tilt-shift lens: a) reference image with a full frame DSLR camera and a 45mm lens @ f/11. The length of the object is 700 mm and the focus distance is set to 1000 mm; b) details of the reference image acquired with the optical axis
perpendicular to the image plane (normal condition); c) details of the reference image acquired with a non-zero tilt angle.
2.2 Tilt-shift lenses
In most DSLR camera systems, the sensor plane and lens axis are fixed perpendicularly to each other, limiting the DOF during the image acquisition. In order to apply the Scheimpflug principle and adapt the DOF to the shape and size of the object, specifically designed tilt-shift lenses have to be used (Figure 1c).The movements allowed by tilt-shift lenses, shown in Figure 5, are here described:
- tilt (T)¸ also known as swing, is the rotation of the optical axis around a point that can coincide with either the exit pupil or the centre of the sensor plane or an arbitrary construction pivot point (Eastcott, 1997);
- shift (S) is the translation movement of the optical axis; - rotation (R) is the rotation around the optical axis. Let’s consider a camera with the image plane vertical (Figure 4).
When R=0° (in this study indicated as R0), the tilt movement takes place in the horizontal plane and the shift in the vertical; on the contrary, when the lens is rotated (R= ± 90° or R90), tilt occurs in the vertical plane and shift in the horizontal.
Figure 4. Movements of tilt-shift lens mounted on a DSLR camera with the image plane vertical and R=0°.
The International Archives of the Photogrammetry, Remote Sensing and Spatial Information Sciences, Volume XLI-B5, 2016 XXIII ISPRS Congress, 12–19 July 2016, Prague, Czech Republic
From now on, a counter-clockwise rotation is considered positive and when all the movements are zero (T= 0°, S=0 mm, R=0° or in the convention here adopted T0S0R0) the lens is said in “normal condition”. A lens projects on the image plane a circle, called image circle, which in normal lenses is usually slightly larger than the sensor. A peculiarity of tilt-shift lenses is that the image circle is much larger, to allow the sensor plane to remain within the circle when movements are used. Indeed, tilt-shift lenses have mechanical limitations in the range of motions in order to guarantee that the image area is always covered by the image circle.
3. EXPERIMENTS
As already stated, the core purpose of this research is to investigate the applicability of the pinhole camera model coupled with Brown’s distortion model to tilt-shift lenses mounted on DSLR cameras (“tilt-shift photogrammetry”). The approach adopted to perform the assessment consists in comparing the 3D coordinates of coded targets measured with tilt-shift
photogrammetry and the coordinates of the same targets obtained
with classic or normal photogrammetry. Here classic or normal photogrammetry refers to the use of standard, i.e. non tilt-shift, lens. Actually, the experiments conducted at the NRC laboratory were not restricted to this specific tests, rather preliminary efforts were made with a twofold aim: (i) to design a proper calibration fixture and (ii) to assess the quality (precision or repeatability and accuracy) of classic photogrammetry, considered the reference
method. However, the paper will particularly focus on the
comparison between tilt-shift and standard photogrammetry.
3.1 Equipment and material
The photogrammetric equipment employed for the tests is summarised in Table 1, whereas Table 2 reports information about the system set-up and measurement volume. In the present study, the photogrammetric system composed of the Nikon D750 with 50mm lens (from now on D750-50mm) is considered the
standard reference photogrammetric system, since the 50mm is
a prime (i.e., fixed focal length) standard lens, with simple lens schema that makes practically valid the classical photogrammetric model (pinhole camera coupled with Brown’s formulation). The aperture value and focus distances were selected to assure a reasonably useful DOF also with standard lens, i.e. the reference measuring system.
Two photogrammetric software applications were used for the calibration of the optical systems, namely EOS PhotoModeler (http://www.photomodeler.com/index.html) and Photometrix Australis (http://www.photometrix.com.au/australis).
3.2 3D photogrammetric calibration test object
An ad-hoc volumetric testfield, called 3D photogrammetric calibration test object (3D PCTO, Figure 5a and Figure 5b), was built for calibrating the optical system. The 3D PCTO features:
- a size of 700 mm × 700 mm in plane and 115 mm in height; - 5 mm diameter photogrammetric contrast coded targets on
aluminium surface and blocks of different heights; - 2 invar scale bars (Brunson, http://www.brunson.us)
measured with an optical coordinate measurement machine (CMM);
- 12 nests where half spheres are placed.
The half spheres can be substituted with spherically mounted retro-reflectors (SMRs), i.e. targets specifically built to be measured with laser trackers. The centre of the spheres coincides with the centre of the SMR, i.e. with the point measured by the laser tracker.
3.3 Testing environment and acquisition protocol
Several experiments were specifically designed and realised in the NRC facility dedicated to research in the areas of metrology, sensor calibration, certification and performance evaluation of 3D imaging systems. The 100-square meter laboratory is characterised by a controlled environment, i.e. temperature at 20°C±0.1°C and humidity at 50%±10%.
Image acquisitions of the 3D PCTO were carried out according to a high redundancy photogrammetric camera network (Figure 5c), both with conventional and with tilt-shift lenses. The convergent multi-station camera configuration includes up to 48 images, incorporating also pictures with orthogonal camera orientation to assure a proper roll diversity suitable for self-calibration. To avoid undesirable camera shake, a photographic tripod and remote control were used; moreover, the mirror lockup function was enabled. The shutter speed was manually set to guarantee the proper exposure of the 3D PCTO at an ISO value of 200. The lenses were locked with hot melt glue to assure mechanical stability and prevent involuntary changes of the focusing setting. The image acquisition with the tilt-shift lens was realised in three configurations: (i) normal condition (T0S0R90), (ii) with a tilt angle in the vertical plane of 4 degrees (T-4S0R90) and (iii) with the maximum allowable shift movement of 11 mm in the vertical plane (T0S11R0). The images were acquired in the proprietary raw format at 12-bit (NEF) and converted into high quality JPG using Adobe Camera Raw without further image processing or enhancement (neither sharpening, noise reduction nor histogram stretching).
4. RESULTS
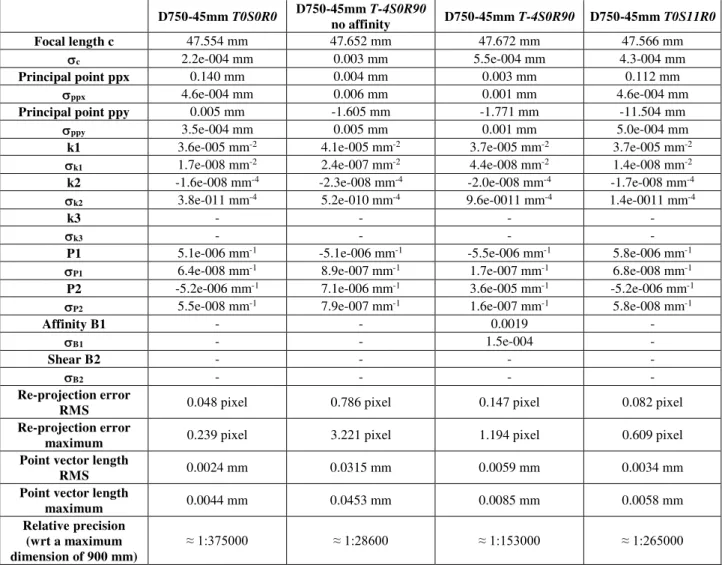
Table 3 and Table 4 summarise the relevant outcomes of the self- calibrating bundle adjustment for the tested photogrammetric systems. The mathematical model adopted comprises the classic pinhole camera model with Brown’s lens formulation plus affinity and shear that is recalled in equation (2).
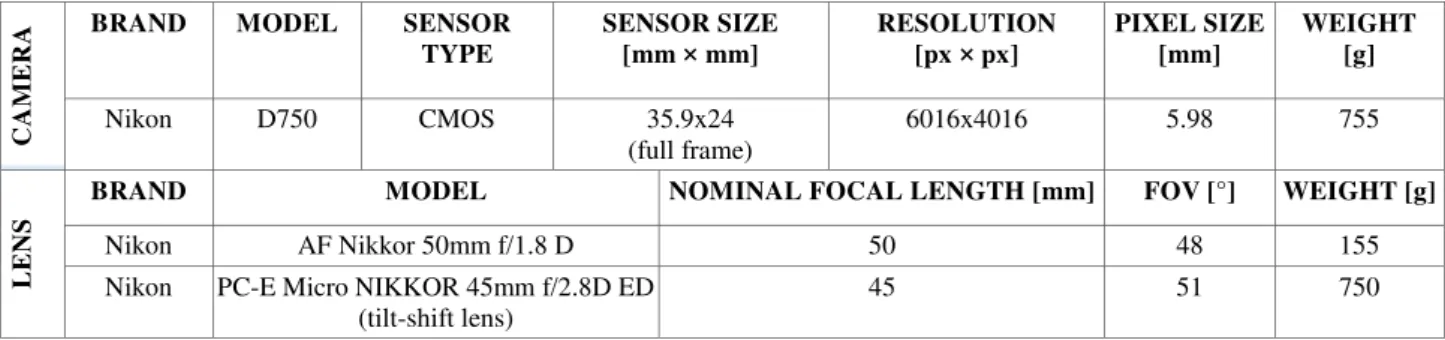
CA
MERA
BRAND MODEL SENSOR TYPE SENSOR SIZE [mm × mm] RESOLUTION [px × px] PIXEL SIZE [mm] WEIGHT [g] Nikon D750 CMOS 35.9x24 (full frame) 6016x4016 5.98 755 LENS
BRAND MODEL NOMINAL FOCAL LENGTH [mm] FOV [°] WEIGHT [g]
Nikon AF Nikkor 50mm f/1.8 D 50 48 155
Nikon PC-E Micro NIKKOR 45mm f/2.8D ED (tilt-shift lens)
45 51 750
Table 1. Photogrammetric equipment.
The International Archives of the Photogrammetry, Remote Sensing and Spatial Information Sciences, Volume XLI-B5, 2016 XXIII ISPRS Congress, 12–19 July 2016, Prague, Czech Republic
Optical system Image scale Footprint W [mm] Footprint H [mm] GSD [mm] Relative aperture (f-number) DOF @ CoC=3×pixel [mm] Near DOF limit [mm] Far DOF limit [mm] D750+50mm 20 718 480 0.12 11 151 930 1080 D750+45mm 22.2 798 533 0.13 11 188 915 1100
Table 2. Optical system set-up and measurement volume. The focus distance is fixed at 1 m. The system composed by the Nikon D750 and 50 mm lens is considered the reference photogrammetric system.
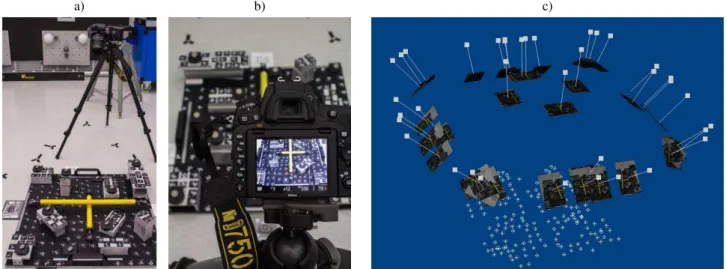
a) b) c)
Figure 5. 3D photogrammetric calibration test object (3D PCTO) developed specifically for calibrating the tilt-shift lens (a, b). Example of camera calibration network (c).
�= �+ Δ � + Δ + Δ �= �+ Δ � + Δ + Δ
(2)
where:
- � and � are the corrected image coordinates;
- � and � are the measured image coordinates referred to the principal points, whose coordinates are respectively �� and �� ;
- Δ � and Δ � are the radial distortion corrections: Δ � =�� �(� ∙ ��+ � ∙ ��+ � ∙ �� 7) Δ � =�� �(� ∙ ��+ � ∙ ��+ � ∙ �� 7) (3)
where ��= √ �+ �, and � , � , � are the radial distortion parameters;
- Δ and Δ are the decentring or tangential distortion corrections:
Δ = ∙ ��+ � + ∙ ∙ �∙ � Δ = ∙ ��+ � + ∙ ∙ �∙ �
(4)
with P , P the decentring distortion parameters;
- Δ and Δ are the affinity and shear distortion corrections:
Δ = ∙ �+ ∙ �
Δ =
(5)
with B and B the affinity and shear parameters, respectively.
For the tilted system (D750-45mm T-4S0R90), two different processing are shown, i.e. with and without including the affinity term in the calibration model. The shear parameter B2, as well as the radial distortion parameter k3, are not computed since they were found to be not significant. Table 5 reports the difference in
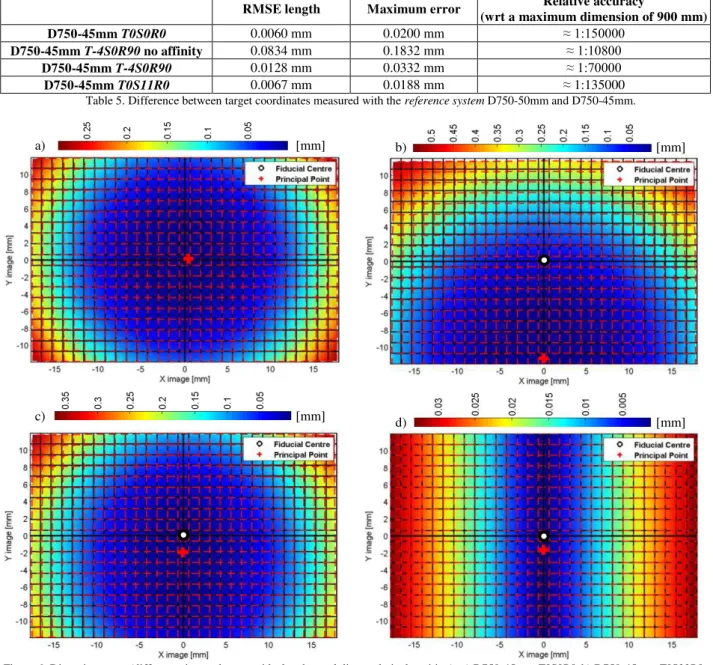
the 3D coordinates of the photogrammetric targets measured with the reference system D750-50mm and the system D750-45mm in the different tested configurations. To calculate the differences, a Helmert rigid transformation without scale factor is computed initially to obtain the two sets of points in the same coordinate reference system. In figure 6, the distortions of the different configurations tested are visualized according to a colour or distortion map, where the colour represents the difference between the ideal pixel position (no distortion) and the actual pixel position due to the influence of distortion parameters as computed through the self-calibration.
The first interesting outcome is that the tilt-shift lens in normal
condition (T0S0R90) provides results essentially equivalent to
the standard 50 mm lens, confirming the good optical and mechanical manufacturing of the lens. Also the effect of a shift movement of the optical axis is well modelled and absorbed by the classic photogrammetric model through a significant movement of the principal point along the sensor height, as it is easily visible in Figure 6b.
When a tilt angle is applied, the affinity term B1 becomes essential, even if it is not sufficient to assure precision and accuracy fully comparable with the normal condition. The individual contribution of B1 on the whole distortion corrections is shown in figure 6d: an absolute correction value up to almost 0.04 mm is reached at the borders of the image.
5. DISCUSSION AND OUTLOOK
The experiments described in the previous sections reveal that, when the optical axis is no longer perpendicular to the image plane with a non-zero tilt angle, the classic pinhole camera model and Brown’s lens formulation can be adopted if:
(i) the affinity factor is computed along with radial and decentring distortion components,
(ii) a relative accuracy of some 1:70.000 is sufficient.
The International Archives of the Photogrammetry, Remote Sensing and Spatial Information Sciences, Volume XLI-B5, 2016 XXIII ISPRS Congress, 12–19 July 2016, Prague, Czech Republic
In case of a shift movement of the optical axis and consequently of the principal point in the image plane, standard photogrammetric mathematical model is basically valid. The next step of the study will be to test a theoretical framework that explicitly incorporate the tilt angle of optical axis into the camera model.
The following topics were neither reported nor discussed for this paper: (i) tests to assess dense image matching procedure with tilt CRP, (ii) the creation of a proper 3D test object suitable to address the quality of the calibration results (stability and repeatability), (iii) the analysis and comparison between photogrammetry and laser tracker data. The next steps of the study will present these topics and complete the theoretical
framework that explicitly incorporate the tilt angle of optical axis into the camera model.
ACKNOWLEDGEMENTS
The research presented in this paper was partially supported by the Mobility Programme (https://mobility.fbk.eu/) of the Bruno Kessler Foundation (FBK). Special thanks to Michel Racine and Lise Marleau from La Cité College in Ottawa (Canada) for the help in printing contrast targets on special paper. The authors are also grateful to Prof. Clive Fraser (University of Melbourne, Australia) for his helpful discussion about Photometrix Australis.
D750-45mm T0S0R0 D750-45mm T-4S0R90 no affinity D750-45mm T-4S0R90 D750-45mm T0S11R0 Focal length c 47.554 mm 47.652 mm 47.672 mm 47.566 mm c 2.2e-004 mm 0.003 mm 5.5e-004 mm 4.3-004 mm Principal point ppx 0.140 mm 0.004 mm 0.003 mm 0.112 mm ppx 4.6e-004 mm 0.006 mm 0.001 mm 4.6e-004 mm
Principal point ppy 0.005 mm -1.605 mm -1.771 mm -11.504 mm ppy 3.5e-004 mm 0.005 mm 0.001 mm 5.0e-004 mm
k1 3.6e-005 mm-2 4.1e-005 mm-2 3.7e-005 mm-2 3.7e-005 mm-2 k1 1.7e-008 mm-2 2.4e-007 mm-2 4.4e-008 mm-2 1.4e-008 mm-2
k2 -1.6e-008 mm-4 -2.3e-008 mm-4 -2.0e-008 mm-4 -1.7e-008 mm-4 k2 3.8e-011 mm-4 5.2e-010 mm-4 9.6e-0011 mm-4 1.4e-0011 mm-4
k3 - - - -
k3 - - - -
P1 5.1e-006 mm-1 -5.1e-006 mm-1 -5.5e-006 mm-1 5.8e-006 mm-1 P1 6.4e-008 mm-1 8.9e-007 mm-1 1.7e-007 mm-1 6.8e-008 mm-1
P2 -5.2e-006 mm-1 7.1e-006 mm-1 3.6e-005 mm-1 -5.2e-006 mm-1 P2 5.5e-008 mm-1 7.9e-007 mm-1 1.6e-007 mm-1 5.8e-008 mm-1
Affinity B1 - - 0.0019 -
B1 - - 1.5e-004 -
Shear B2 - - - -
B2 - - - -
Re-projection error
RMS 0.048 pixel 0.786 pixel 0.147 pixel 0.082 pixel Re-projection error
maximum 0.239 pixel 3.221 pixel 1.194 pixel 0.609 pixel Point vector length
RMS 0.0024 mm 0.0315 mm 0.0059 mm 0.0034 mm
Point vector length
maximum 0.0044 mm 0.0453 mm 0.0085 mm 0.0058 mm Relative precision
(wrt a maximum dimension of 900 mm)
≈ 1:375000 ≈ 1:28600 ≈ 1:153000 ≈ 1:265000
Table 3. Results of self-calibrating bundle adjustment for the tested photogrammetric systems. Interior orientation and additional parameters are reported along with internal assessment in image and object space.
REFERENCE MEASUREMENT D750-45mm T0S0R0 D750-45mm T-4S0R90 no affinity D750-45mm T-4S0R90 D750-45mm T0S11R0 DIFFERENCE SB1 349.4776 mm 0.0015 mm -0.0483 mm -0.0096 mm 0.0012 mm SB2 599.9764 mm -0.0027 mm 0.0829 mm 0.0165 mm -0.0020 mm Mean absolute length error 0.0021 mm 0.0656 mm 0.01305 mm 0.0016 mm
Relative maximum length
error (wrt to SB2) ≈ 1:222000 ≈ 1:7200 ≈ 1:36400 ≈ 1:300000
Table 4. External assessment of the self-calibrating bundle adjustment for the photogrammetric systems tested: length error on reference scale bars. The International Archives of the Photogrammetry, Remote Sensing and Spatial Information Sciences, Volume XLI-B5, 2016
RMSE length Maximum error Relative accuracy (wrt a maximum dimension of 900 mm) D750-45mm T0S0R0 0.0060 mm 0.0200 mm ≈ 1:150000 D750-45mm T-4S0R90 no affinity 0.0834 mm 0.1832 mm ≈ 1:10800 D750-45mm T-4S0R90 0.0128 mm 0.0332 mm ≈ 1:70000 D750-45mm T0S11R0 0.0067 mm 0.0188 mm ≈ 1:135000
Table 5. Difference between target coordinates measured with the reference system D750-50mm and D750-45mm.
a) [mm] b) [mm]
c) [mm]
d) [mm]
Figure 6. Distortion maps (difference in mm between ideal and actual distorted pixel position): a) D750-45mm T0S0R0, b) D750-45mm T0S11R0, c) D750-45mm T-4S0R90, d) only the effect of the affinity correction for D750-45mm T-4S0R90.
REFERENCES
Albers, O., Poesch, A. and Reithmeier, E., 2015. Flexible calibration and measurement strategy for a multi-sensor fringe projection unit. Optics express, 23(23), pp. 29592-29607. Astarita, T., 2012. A Scheimpflug camera model for stereoscopic and Tomographic PIV. In 16th International Symposium on
Applications of Laser Techniques to Fluid Mechanics.
Eastcott, J., 1997. Optical adapter for controlling the angle of the
plane of focus. U.S. Patent 5,592,331.
Evens, L., 2008. View Camera Geometry.
http://www.math.northwestern.edu/~len/photos/pages/vc.pdf Fournel, T., Lavest, J.M., Coudert, S. and Collange, F., 2004. Self-calibration of PIV video-cameras in Scheimpflug condition. In “Particle Image Velocimetry: Recent Improvements”, Springer Berlin Heidelberg, pp. 391-405.
Hamrouni, S., Louhichi, H., Aissia, H.B. and Elhajem, M., 2012. A new method for stereo-cameras self-calibration in Scheimpflug
condition. In 15th International Symposium on Flow
Visualization.
Louhichi, H., Fournel, T., Lavest, J.M. and Aissia, H.B., 2007. Self-calibration of Scheimpflug cameras: an easy protocol.
Measurement Science and Technology, 18(8), p.2616.
Luhmann, T., Robson, S., Kyle, S. and Boehm, J., 2014.
Close-range photogrammetry and 3D imaging. Walter de Gruyter.
Menna, F., Rizzi, A., Nocerino, E., Remondino, F., Gruen, A., 2012. High resolution 3D modeling of the Behaim globe. Int.
Archives of Photogrammetry, Remote Sensing and Spatial Information Sciences, Vol. 39(5), pp. 115-120.
Merklinger, H.M., 1996. Focusing the view camera. Seaboard Printing Limited, 5.
Ray, S.F., 2002. Applied photographic optics: Lenses and optical
systems for photography, film, video, electronic and digital imaging. Focal Press.
The International Archives of the Photogrammetry, Remote Sensing and Spatial Information Sciences, Volume XLI-B5, 2016 XXIII ISPRS Congress, 12–19 July 2016, Prague, Czech Republic