Analysis of the Factors Which Affect the Implementation of
Advanced Manufacturing Technologies
by
Stephen MacDonald Foster
Submitted to the
Department of Electrical Engineering and Computer Science in partial fulfillment of the requirements for the degrees of
BACHELOR OF SCIENCE and
MASTER OF SCIENCE
at the
Signature of
MASSACHUSETTS INSTITUTE OF TECHNOLOGY October, 1989
@ Stephen MacDonald Foster, 1989
The author hereby grants MIT permission to reproduce and to distribute copies of this thesis document in whole or in part.
Author...Signature
red acted
Department of Electrical Engineering and Computer Science October 4, 1989
Signature redacted
Certified by .... Certified by ... Accepted by ... ... Thomas J. Allen Thesis SupervisorSignature redacted
Mike Mathews 4 ooperatiggCompany SupervisorSignature redacted
Signat
re
re
acted...
Arthur C. Smith
MASSAtfHUSETS INSTi;:ihairman, Committee on Graduate Students
Analysis of the Factors Which Affect the Implementation of
Advanced Manufacturing Technologies
by
Stephen MacDonald Foster
Submitted to the Department of Electrical Engineering and Computer Science on October 4, 1989 in partial fulfillment of the requirements for the degrees of
Bachelor of Science and Master of Science.
Abstract
Over the past few decades, there has been a noticeable decrease in the ability of American manufacturing to compete in the world market. Al-though continued efforts have been made to automate processes and to uti-lize new manufacturing technology, companies are still running into many problems incorporating new equipment into their production lines.
This thesis work is an investigation into the factors which affect the
implementation of advanced manufacturing technologies (AMTs). A
number of the issues which have been mentioned in the literature are mod-eled and analyzed. The experiences of 16 projects and 36 individuals were in-vestigated and are used in the analysis.
The prime focus of the work is the relationship between the producer and the receiver of an AMT. Analysis is conducted to see how this relation-ship affects project performance. A number of project attributes are also
investigated. One interesting project attribute is whether or not the producer of the AMT is within the same company as the receiving group. It appears that there are some interesting differences in the producer-receiver relation-ship depending on this characteristic. It also appears that the effect of the pro-ducer-receiver relationship on project performance is also different depend-ing on this characteristic.
Overall, this work includes a number of recommendations on how to most successfully incorporate new technology into a manufacturing envi-ronment.
Thesis Supervisor: Professor Thomas
J.
AllenTable of Contents
T itle Page...1 A bstract... 2 Table of Contents ... 3 Acknowledgements... 5 1 Introduction ... 62 Literature Review and Hypothesis Formulation ... 10
Operationalizing the Relationship between the Producer and the Receiver...14
Division of Engineering Effort between the Producer and the Receiver...15
Level of Communication between the Producer and the Receiver...17
Measuring Project Success ... 19
Implementation Characteristics ... 21
1. Internal or External Producer... 24
2. Perceived Challenge of the Project... 28
3. Previous Experience of the Receiver...31
4. Changes in the Equipment during the Project...33
5. Distance between the Producer and the Receiver... 36
6. Length of the Project ... 38
3 Research Design and Methodology... 39
4 Variable Definitions... 42
Implementation Characteristics ... 42
Success M easures ... 44
Measures of the Relationship between the Producer and the Receiver...45
Summary of Variables... 47
5 Empirical Results: Analysis of a Simplified Model of the Implementation of New Technology...48
Associations between the Three Measures of Success...50
Associations between Implementation Characteristics and Success M easures ... 52
Associations between Implementation Characteristics and Relationship Measures... 57
Associations between the Relationship Measures and Success M easures... 64
6 Empirical Results: Relationship Measures as a Response to Implementation Characteristics...73
In trod u ction ... 73
Controlling for Internal or External Producer...76
Controlling for Perceived Project Challenge...87
Controlling for Previous Experience of the Receiver...92
Controlling for Equipment Changes during the Development and Integration Stages...96
7 Management Lessons...101
The Opportunities and Challenges of an Internal-Producer Project...101
Ensuring the Equipment Works and Is Appropriate...105
Preparing the Users for the Technology ... 107
Protecting O ne's O w n Interests...109
N o E asy Solu tions...110
8 C onclusions...112
R eferences...115
Appendix A: Questionnaire ... 117
Appendix B: Open-Ended Questions... ... 121
Appendix C: Results of Contingency Analysis...:... . . 122
Acknowledgements
An unusually large number of people played a part in making this re-search effort a reality. I am strongly appreciative to those individuals who have either given me this opportunity or have helped me to accomplish it.
I sincerely appreciate having Professor Tom Allen supervise this re-search. I am significantly indebted to the time and effort that Dietmar Harhoff has spent showing me how to interpret and see through my data.
I would also like to express many thanks to the company and the indi-viduals within it who donated their time to conduct this research.
Further thanks go to the MIT Department of Electrical Engineering and the VI-A office for understanding my situation and allowing me to write this thesis within a non-standard field. My advisor, John Tucker, has been an es-pecially positive influence over the past three years.
My final words of appreciation go to those close friends who have had
to deal with the time spent, especially over the past few months, in complet-ing this work. My roommate, Reginald Tucker, has been a saint in dealcomplet-ing with my off-the-wall schedule. Much appreciation further goes to the mem-bers of the RTS group at the Laboratory for Computer Science. Beyond pro-viding more computing resources than one could imagine, Sharon Thomas, John Pezaris, John Wolfe, and Steve Ward have provided much inspiration and helpful stimulation over the past six months.
Introduction
The decreased ability of U.S. manufacturers to compete in the world market over the past few decades has spawned an increased effort towards improving U.S. processing technology. This recent thrust has led to an in-creased emphasis towards implementing advanced manufacturing technolo-gies. These new techniques include robotics, vision inspection systems, flexi-ble manufacturing systems, computer integrated manufacturing techniques, and a number of other technologies. These new techniques were expected to deliver the U.S. from its perilous downward course and into a new world of completely automated manufacturing. Once again the U.S. would be recognized as the world leader in manufacturing.
Many companies, recognizing this need to automate their processing, invested huge sums of capital and expenses into the automation solution. And, as with any new approach to solving a problem, there has been a very large increase in understanding with the increased exposure to the new manufacturing techniques. But, nonetheless, companies are still experienc-ing many difficulties in implementexperienc-ing these new manufacturexperienc-ing solutions. The effectiveness of the solutions have been greatly hampered by the diffi-culty in effectively implementing them within the plant environment. Fundamentally, there has been a problem of transferring the technology of the advanced automation techniques into the plant. Because of these problems, many companies are now reevaluating their automation desires, and the goal now is to understand manufacturing as a whole and not assume the solution is as simple as throwing money into automation.
This thesis is a description of a study conducted to investigate the fac-tors which affect the implementation of advanced manufacturing technolo-gies (AMTs). A number of influences on success have been found and are analyzed. Of prime importance to this research, however, is the relationship between the producer and the receiver of these advanced technologies. The importance of building a strong relationship between these two groups has been highly stressed recently. Because of the challenges involved in imple-menting advanced manufacturing equipment, to be successful, both groups must move away from the typical vender-purchaser relationship towards a "partnership". This research analyzes the associations between the strength of the producer-receiver relationship and its effect on eventual project per-formance.
This research summary starts in Chapter 2 with an overview of the lit-erature on the implementation of new manufacturing technology. From this literature overview, a model is developed which is used throughout the course of the study. This model is used to analyze associations between the producer-receiver relationship and project success. It is broken down into three major components which are describe more fully below.
The first component of the model includes measures of the producer-receiver relationship. The two measures used are the level of communica-tion and the division of (engineering) effort between the producing and re-ceiving groups. The division of engineering effort variables represent the fraction of the engineering manhours completed by each group. The com-munication and division of engineering effort are measured for each project stage, specifically the planning, development, and integration stages.
The second component of the model contains the measures of project performance. Project performance is measured along two dimensions - the business success and technology transfer success. For the business success, two measures are used. These are the percentage time overrun and percent-age capital-cost overrun. The next measure, the technology transfer success refers to the degree to which the knowledge required to utilize and alter the technology is transferred from the producing group to the receiving group.
The third component of the model includes measures of six project at-tributes, such as its technical complexity, the receiver's experience prior to the introduction, distance between the groups, and others. An extremely impor-tant project attribute which is investigated is whether the producer of the AMT was within the same company as the receiver, or simply an external vendor. An analysis of the differences between internal and external transfer of process technology may reveal some especially interesting results.
Hypotheses are given for the above model which explain the expected associations between its different components. These hypotheses give the ex-pected behavior for three types of associations. First, it is exex-pected that each project attribute will have an effect on the project performance. Second, some project attributes are expected to have an effect on the producer-receiver rela-tionship. Finally, for variations in the project attributes, it is expected that there will be different associations between the partnership measures and the success measures. Explication of these expected relationships is given in Chapter 2.
The next two chapters give an overview of the research project. Chap-ter 3 gives an overview of the research method that was used. ChapChap-ter 4
gives an overview of the variable definitions used in the study and explana-tion of how each was measured.
The next three chapters give results of the research. The first two of these present quantitative results from the analysis of the model. Chapter 5 gives a summary of the independent associations between the three compo-nents of the model - the relationship measures, the success measures, and the project attributes. Chapter 6 goes a step beyond this analysis. Chapter 6 investigates the associations between the relationship measures and the suc-cess measures as they are affected by different project attributes.
Chapter 7 is the final results chapter. Chapter 7 gives an overview of the managerial lessons gathered throughout the research. The lessons in this chapter go beyond the results given in two earlier chapters. It is meant to be a quick summary of some of the qualitative issues which were not analyzed in the model. Finally Chapter 8 provides a summary and conclusions.
It is expected that this work will contribute to the body of knowledge in the management of technological innovation, especially for new process in-troductions.
2
Literature Review and Hypothesis Formulation
Seeing the need to increase the management understanding of the im-plementation of advanced manufacturing equipment, there has been consid-erable research completed on this topic in recent years. Much of the research has come under the umbrella of "technology transfer." Its goal has been to increase the understanding of how to successfully transfer the knowledge and ability to effectively utilize new technology from a producing group to a re-ceiving group.
The research so far has pointed to a number of issues. One key man-agement strategy has been the early receiver involvement in the whole technology development and transfer process (Leonard-Barton, October 1988). Ettlie (1986) points to the need to build a strong relationship between the producer and the receiver of the equipment. This need for team building across organizational boundaries is an important managerial strategy that seems to be noticeably missing in many of the projects which have run into trouble.
Another important point seems to be the need for a sponsor or a champion with enough influence in the user organization to ensure that a technology transfer project is adequately funded (Gerwin, 1982). Many pro-jects fail because there is not enough man-power working on the project, and there is no individual with enough enthusiasm and commensurate influ-ence who is able to get that funding. Many projects are never be completed for this reason.
In transferring technology into a manufacturing environment, much research has promoted the importance of marketing any proposed changes to the most affected receiving members. Users of any new technology must un-derstand its importance and want to utilize it effectively. (Kraus and Leonard-Barton, 1985) Often the actual users of some advanced piece of equipment are not sufficiently considered in the equipment's design. Often equipment is never "accepted" by its users and for this reason never has the opportunity to meet its measures of performance.
Other issues mentioned in the literature have included the need to implement new technologies using an incremental or phased approach and the need for clear, concise documentation and relevant training (Gervais,
1987). All of these are very important in the technology transfer process.
This research primarily focuses on the relationship between the pro-ducer and the receiver of advanced manufacturing equipment during all stages of an implementation process. For this study, the implementation process is broken down into four stages. The stages are shown graphically in the timeline shown in Figure 2.1
The relationship between the producer and the receiver is often cited as the most critical element leading to the success or failure of a project (Ettlie,
1988). A stronger relationship built between the two parties should lead to
better transfer of critical project information. This stronger relationship should be exhibited by a better understanding of the technical needs of the re-ceiver by the producer. Such a more enlightened producer should be able to better understand the wishes of the receiver during the planning stage and
Stages in the Implementation of New Manufacturing Technology
I I I Itime
Planning Development Integration Handoff
and 1st 2nd into to the
Specifications half half Receiver's Receiver
Environment
Figure 2.1: The above graph is a timeline of the stages in the implementation of new manufac-turing technology used throughout this research. The first stage is the planning and the deter-mination of specifications stage (hereafter referred to as just 'the planning stage'). In this first stage the producer and the receiver determine the needs of the receiver and determine the specifications of the equipment that will be produced in the development stage. The develop-ment stage, in which the producer designs and builds the equipdevelop-ment within his facilities, is broken into two halves. There is a distinction in the halves in order to compare the differences between the two. The integration stage represents the time from when the equipment arrives at the receiver's plant and is integrated into the receiver's manufacturing process. The 'hand-off' point is the time at which the equipment is completely integrated into the receiver's manufacturing environment.
should also be able to more quickly respond to any changing needs of the re-ceiver if they should arise during the development and integration stages. Furthermore, a stronger relationship should be accompanied by a better un-derstanding of the capabilities of the producer by the receiver. With this greater understanding, the receiver should best be able to ensure that the pro-ducer is capable of building the equipment during the planning stage, and that the producer is successfully proceeding in that task throughout the de-velopment. The importance of the information flow during the planning stage and during the rest of the project is shown in Figure 2.2. It is the premise of this research that the stronger the team-building between the two groups then the greater the probability that a project will be completed in an earlier time frame and within a lower final cost than was originally expected.
Necessary Transfer of Information between the Producer and
the Receiver of an Advanced Manufacturing Technology Planning Stage:
Producer
Capabilities of the Producer and its Technology
Process Needs and
Equipment needs of the Receiver
Receiver
Development and Integration Stages:
Progress of Dev't and Integration and Equipment Performance
Producer Receiver
Changing Needs of the Receiver
Figure 2.2: The above graph describes a two-way flow of information that is crucial to the suc-cess of a project. During the planning stage, the producer must gain a strong understanding of both the equipment he is expected to produce and the manufacturing process that the equipment will be implemented into. During the development and integration, the producer must maintain contact with the receiver in case any of the receiver's needs change. Likewise, during the plan-ning stage, the receiver must gain a strong understanding of the capabilities of the producer. The receiver must also maintain project progression and equipment performance information during the development and integration stages.
Although it is reasonable to assume that a stronger relationship
be-tween the producer and the receiver of advanced manufacturing equipment
will lead to more successful project performance, a research project which wants to investigate the importance of this factor must address the following three concerns: 1. how does a researcher operationalize the relationship be-tween the producer and the receiver, 2. how does a researcher measure the success of an implementation, 3. under what implementation characteristics
is this need for strong relationship between the two groups more or less nec-essary. These three concerns are addressed in the rest of this chapter.
Operationalizing the Relationship between the Producer and the Receiver
Although it seems obvious that increased team building and a stronger relationship between the producer and the receiver of advanced manufactur-ing equipment will help to promote success, there is a question of under-standing just what a strong "relationship" means. After one understands what this concept of "relationship" means, it may be possible to measure what signs are exhibited when a relationship is relatively strong and con-versely when a relationship is relatively weak. Through this approach, it may then be possible to measure the strength of the relationship over a num-ber of projects. This research attempts to do just that.
A strong relationship in its simplest interpretation in the context of
implementing advanced manufacturing equipment may be considered to be the following: on one hand, it is a commitment from the producer to build the most cost effective, timely, and technically complete solution to best suit the receiver's needs. On the other hand, it is a commitment from the receiver to provide the producer with information necessary to build the equipment and to return to the producer an equitable fee for his services. Because there is a commitment from both the producer and the receiver towards doing what is most fair, both parties should mutually benefit from the relationship. This is the goal of building inter-group relationships.
A strong relationship can potentially be exhibited in a number of ways.
in all stages of the introduction process of an AMT (Advanced Manufacturing Technology). The second way that a strong relationship may exhibit itself is in the level of communication between the producing and the receiving group for all stages of the introduction. This division of engineering effort is discussed next, and the level of communication is discussed in the section af-ter it.
Division of Engineering Effort Between the Producer and the Receiver
Because of the newness of the technology inherent in AMTs, there is a pressing need for the committed involvement of both the receiving group and the producing group in all stages of the project. This is usually the result of the large number of engineering unknowns involved in the development and integration into the receiver's environment of a highly sophisticated piece of equipment.
This need for shared engineering effort would not be expected for a piece of equipment that is commonplace in the receiver's environment. In this latter case, the receiver could simply make an assessment of his needs and, using his knowledge based on his experience with the particular tech-nology. simply determine the specifications of the equipment that is needed. The receiver would order the particular equipment from the producer. The producer would develop the equipment with little involvement of the re-ceiver because there are few engineering unknowns. During the integration of the equipment into the receiver's environment, there is typically little in-volvement by the producer. The receiver with his knowledge of the technol-ogy is often able to implement the equipment autonomously. This type of technology is often referred to as an "off-the-shelf" technology. With
off-the-shelf technology, there is usually a clear distinction in the division of engi-neering effort between the two groups for each of the stages. The receiver usually handles the planning stage, which includes the determination of the specifications of the equipment that is needed. The producer usually com-pletes all of the development work. The receiver usually quickly integrates the equipment into the production line. Because of the receiver's previous experience and the less complex nature of the technology, this integration process typically does not take a long time.
In the case of AMTs, however, the situation is usually quite different. The receiver often has less understanding of the technology that he is pur-chasing (Kraus and Leonard-Barton, 1985). Because of the newness of the technology, the receiving engineers often have not worked with this particu-lar type of equipment prior to the introduction. The receiving group must depend on the producing group's understanding of the technology in deter-mining the specifications of the equipment that is needed. Furthermore, of-ten the receiver can only understand what the benefit of the AMT's introduc-tion will be based on the producer's opinion. Unfortunately, because a pro-ducer of an AMT may be looking out for the profitability of his company, the producer's advice may not always positively correlate with the receiver's ac-tual needs (Gerwin, 1982). Furthermore, the ability of the producer to fully understand the receiver's needs is often hampered by the decreased involve-ment of the receiver in this planning process. At other times the receiver may be involved, but he may actually have an inaccurate understanding of his own needs. For these reasons, there must be a stronger relationship be-tween the producer and the receiver of an AMT than is necessary for a rela-tively simple off-the-shelf technology.
Although involvement of both groups is important, this research will not try to conclude or even analyze whether equal sharing of engineering ef-fort leads to better project performance. This research will try to investigate, however, given certain project characteristics (to be more fully explained be-low), whether a relatively higher level of receiver involvement during some stages tends to be more positively associated with measures of project success. In other cases, this research will investigate whether more producer in-volvement tends to have this effect. Analyzing this division of engineering effort should help illuminate part of the relationship between the producer and the receiver.
Level of Communication between the Producer and the Receiver
The next element analyzed in the relationship between the producer and the receiver is the level of communication during the various project stages.
In a simple sense, a higher level of communication should reflect a stronger relationship between the producer and the receiver of an AMT. This stronger relationship would be symbolically represented by a stronger infor-mation flow between the two groups as shown graphically in Figure 2.2. On first thought, one might expect that a higher level of communication may be associated with a higher level of business success.
Yet, as was demonstrated by Allen (1977), during some stages more communication can also be a sign that the project is experiencing trouble. Figure 2.3 shows different levels of communication for higher- and lower-rated project teams for various stages of project completion. The lower lower-rated
Communication Patterns for Higher and Lower Rated Projects Comparison of the Proportion of Time Spent by Higher- and
Lower-Rated Project Teams in Consultation with the Laboratory's Technical Staff Lower Rated -15 Higher Rated 10 -IL M 0 0 1/6 1/3 1/2 2/3 5/6
Figure 2.3: Comparison of the Proportion of Time Spent by Higher- and Lower-Rated Project Teams in Consultation with the Laboratory's Technical Staff (Allen, 1977, pp. 103).
projects actually had a higher level of communication near the final stages of the project. The higher rated projects had more consistent levels of commu-nication throughout the project It is possible that a higher level of commu-nication can be a good method of maintaining a strong relationship that is working together to solve a problem, or it may also be the sign of a project that is experiencing many problems and needs higher levels of communica-tion in order to pull itself out of the water. In either case, further understanding these communication patterns should also help to illuminate the relationship between the producing and receiving groups.
Measuring Project Success
Finding an objective measure to use in the evaluation of project suc-cess is an elusive task. In the implementation of advanced manufacturing technologies, there are a number of measures which are often mentioned. Some of the measures are more objective and thus easier to calculate than the others. Some of the easier ones to calculate are the start-up time or the total capital cost. Some other measures of project outcome which are somewhat harder to calculate objectively are the technical performance, the disruption to factory efficiency, receiver satisfaction, and the increase in the skills of the receiving group.
In a research project that involves only a relatively small number of cases in which many of the project parameters vary quite highly, it is chal-lenging to find measures which are valid and accurate reflections of perfor-mance. Using absolute measures of project outcome (like total time, total cost, total number of manmonths, etc) can lead to problems since the scope of the projects vary so highly. For example, it would be inappropriate to use start-up time itself as a measure of performance when there are substantial differences (an order of magnitude, for example) in the scope of the projects as measured by the expected startup time. (Start-up time, however, may be used as a project characteristic, as is done in this analysis.) Nonetheless, using measures of performance which are based on objective results as opposed to subjective views is also important in order to ensure a certain validity in the results.
Because of these needs, three relative measures of success are used to measure project performance. The two more objective measures of success
are the percentage capital-cost overrun and the percentage time overrun. Furthermore, one subjective measure, the transfer success as reported by the receiving group is also measured. This third measure is further explained below. Because of the vast differences in the scope of the projects investi-gated, using the percentage difference between the expected and the actual values for the objective measures allows for a more uniform comparison among different projects.
Both of these measures, percentage time overrun and percentage capi-tal-cost overrun, are used to provide some measure of overall business per-formance. A project which takes much more time than its original expected
start-up time can cause much disruption to production flow in the manufac-turing plant. It may further cause delays in the time-to-market measure, which has recently become an important measure of the ability of companies to compete. Time overruns also typically result in more manhours being dedicated to an introduction. In the implementation of AMTs, the cost of the man-hours involved in the implementation can often far outweigh the costs of the capital investment. Percentage of time overrun is a useful method of measuring project performance.
The percentage capital-cost overrun is another useful measure. A pro-ject which has a higher capital cost relative to its original expectations may have the simple effect of having a larger price tag. But it may further signify that the original design of the equipment being produced was not an accurate reflection of the receiver's true needs. As a result, more capital may have been needed to remedy the situation.
The final measure of project success is a measure of organizational learning. This measure is a subjective measure of how well the understand-ing of the equipment's use and alteration was transferred from the producunderstand-ing group to the receiving group. This measure is called the perceived transfer success. The perceived transfer success is included because it is often men-tioned that the increase in the knowledge of the receiving group is an impor-tant measure of a project's success (Jaikumar, 1986). The increased under-standing of AMTs by receiving groups will certainly be a positive influence on their ability to handle similar future introductions. The ironic aspect of this situation, however, is that the receiver often learns more about a tech-nology when it is forced to get involved because the project is late or the cost of the implementation has gone far over original expectations. For these rea-sons, there may be a contrast in the measure of transfer success and the two other measures of business success. This will be examined in the research. This association between the transfer success and the business success will be the basis for the first hypothesis of this research.
Hypothesis 0: Because of the context under which many projects
experience high technology transfer success, there will be either no association or a negative association between technology transfer success and the business success measures.
Implementation Characteristics
The investigation of the effects of the implementation characteristics on the performance of a project represents a large part of this research. The project characteristics of interest in this research are listed below.
1. Whether the producer is internal or external to the
2. The perceived challenge of using the particular technol-ogy for the specific application.
3. The experience of the receiver with the particular tech-nology prior to the introduction.
4. The number of equipment changes during the project.
5. Distance between the producer and the receiver.
6. The length of the project.
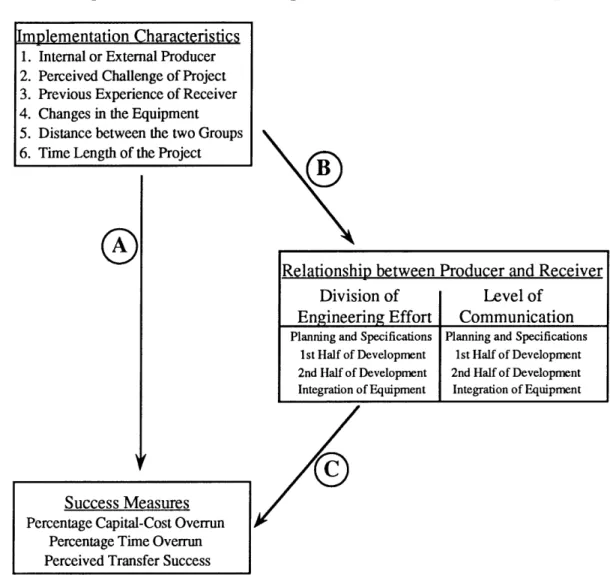
The overall diagram which summarizes the associations which are to be investigated is shown in Figure 2.4.1 The model shown by Figure 2.4 sug-gests that the outcome of the implementation is affected by three sets of asso-ciations:
A. Some implementation characteristics are likely to have a direct effect on the project outcome.
B. The level of communication and the division of engi-neering effort will be affected by some of the characteristics of the implementation.
C. The level of communication and the division of engi-neering effort are expected to affect the project outcome. For different implementation characteristics, the effect of the communication level or engineering effort division may be different.
1 The structure of the model used in this research is similar to the model used by Tyre (1988). The variables which are used in this research and their associated analyses are quite different in many respects. Nonetheless, the reader is encouraged to view Tyre's work for a contrasting approach to the analysis of the relationships within this model.
Model of the Implementation of New Technoloyv
0
(FIT)
Success Measures Percentage Capital-Cost Overrun
Percentage Time Overrun Perceived Transfer Success
Relationship between Producer and Receiver Division of Level of
Emnineerin2 Effort Communication
Planning and Specifications Planning and Specifications
1st Half of Development 1st Half of Development
2nd Half of Development 2nd Half of Development
Integration of Equipment Integration of Equipment
Figure 2.4: The above diagram gives the model for the implementation of advanced manufac-turing technology studied in this research. The arrow marked by an "A" represents the direct effects that the implementation characteristics have on the project outcome. The arrow marked by a "B" represents the effect that the implementation characteristics have on the di-vision of engineering effort and the level of communication for all of the project stages. The ar-row marked by a "C" represents the effectiveness of the division of engineering effort and the level of communication on the project success, given the various implementation characteristics.
With this model, it will be easier to elaborate on the rest of the hy-potheses that this research analyzes. Hyhy-potheses will be given only when there is the expectation that there will be some association between the vari-ables involved. The hypotheses are coded in order to keep track of which
as-[mplementation Characteristics 1. Internal or External Producer 2. Perceived Challenge of Project 3. Previous Experience of Receiver 4. Changes in the Equipment 5. Distance between the two Groups 6. Time Length of the Project
sociation each represents. In order to do this coding, each implementation characteristic is assigned one number (the same number that is given above in the list of implementation characteristics), and each association is also given a letter (the same letter that is given in the list of associations above). For example, using this coding "Hypothesis 5A" would describe the expected association between the distance separating the two groups and the project outcome. "Hypothesis 1B" would describe the expected effect that an internal as opposed to an external producer would have on the level of communica-tion and the division of engineering effort.
The sections below are partitioned by implementation characteristic. These sections elaborate on the independent effects that it is expected each implementation characteristic will have on the level of communication and division of engineering effort and further on the project outcome. As ex-plained earlier, hypotheses are only given when there is an association that is expected.
1. Internal or External Producer
The first implementation characteristic is used to keep track of whether the project was an intra- or inter- firm transfer of technology. Although in-tra-firm transfer of technology is often thought to be easier than inter-firm transfer, some studies have argued that it is actually harder. This surprising result, as expressed by Graham and Leonard-Barton (1984, p. 61), is the result of two qualities of intra-firm transfer described below:
First, internal rivalries, often denied or overlooked, can make rational the attitude that is stigmatized as the Not-In-vented-Here Syndrome or NIH Factor. Second, intrafirm rela-tionships and responsibilities associated with transfer are often
less well defined than they need to be. Organizations might do well to handle transfer of technology inside the firm with the same kind of care and rigor that they bring to their relations with outside vendors."
Because of this, it is expected that the perceived transfer success of the introduction will suffer if a project has an internal producer as opposed to an external producer. Furthermore, it will be expected that the business mea-sures of success, the percentages of time and capital-cost overruns, will also be somewhat negatively affected. The hypothesis for these expected associations is given below:
Hypothesis 1A: Projects with internal producers, as opposed to
projects with external producers, will be more likely to have lower levels of perceived transfer success, as reported by the re-ceiving groups. Internal-producer projects may also have a slightly lower level of business success.
Although there is speculation that there will be less transfer success for projects that have an internal producer, this may be the result of lesser in-volvement of the receiving group in the engineering manhours for all stages of the project. Indeed, one of the best ways to transfer the technology into a receiving group is to have an engineer from the receiving group involved in all stages of the project (Baker, 1986). Of course, the cost involved in doing so typically prevents receiving groups from making such an investment. The speculation of this research is that when a producing group is within the same organization, it is more likely that there will be less engineering effort
by the receiver during all stages of the project. On the other hand, because an
internal-producer project occurs within the same company, there will be an increase in the amount of communication between the two groups. The hy-pothesis is now given:
Hypothesis 1B: Projects with internal producers, as opposed to
projects with external producers, will be more likely to have lower levels of engineering effort by the receiving group for all stages of the project. Projects with internal producers, however, are more likely to have a higher level of reported communica-tion for all stages of the project.
The next part of the investigation involves controlling for the cases in which the producer is within the same company as the receiver (internal producer) and for the cases in which the producer is a separate company (external producer). This is a method of contingency analysis which basically investigates the following types of questions: if one were to look at only
in-ternal-producer projects, what is the association between the level of
com-munication and the business success. Furthermore, how strong is this associ-ation when compared to the same associassoci-ation for only external-producer pro-jects. This type of investigation helps to understand how much different di-visions of engineering effort and the level of communication affect project outcome given different implementation characteristics. The first part of this type of contingency analysis will look at the differences between there being an internal producer, as opposed to there being an external producer.
This research speculates that for an external-producer project, a greater percentage of receiver engineering effort in all stages will have a more beneficial effect on the business success of the project than will a project with an internal producer. In other words, for a project with an internal producer, more receiver engineering involvement is less important in positively affecting business success. This stems from the expectation that for an exter-nal-producer project, the producing group depends on engineering involve-ment of the receiver in order to acquire critical information about the re-ceiver's manufacturing process. This expected effect should not be as strong
for internal-producer projects because internal producers are able to acquire critical information about the receiver's process by their own search attempts. Information on the receiver's manufacturing process is more accessible to ternal producers, and for this reason there is less need for engineering in-volvement by the receiver for internal-producer projects.
On the other hand, because projects with internal producers tend to depend more on a higher level of communication (between the producing and the receiving groups) than they do on the engineering involvement of the receiving group, a higher level of communication will have a more beneficial effect in the case of an internal development. In other words the business success for a project with an external producer will not be affected as much by a change in the level of communication as the business success would in a project that has an internal producer. So the hypothesis for the difference between an internal- and an external-producer project is the fol-lowing:
Hypothesis IC: A higher percentage of receiver engineering
ef-fort for an external-producer project will tend to have a more beneficial effect on the measures of business success than it (a higher percentage of receiver engineering effort) will tend to
have for an internal-producer project. On the other hand, a
higher level of communication between the two groups for an internal-producer project will tend to have a more beneficial ef-fect on the measures of business success than it (a higher level of communication) will tend to have for an external-producer pro-ject.
The associations for the variables given in Hypothesis 1C are shown graphically in Figure 2.5. For each graph, one line represents what is expected for external-producer projects and the other line represents what is expected for internal-producer projects.
Expected Association between the Relationship Measures and Business Success Measures for All Project Stages
(Controlling for Internal- and External-Producer)
HIGH
P-/
Pro Extemilts
. rjeA
IOW IOW Iroje
More Receiver More Producer Lower Higher
Effort than vision o Effort than Level of LevlLevel of
usual EEffort usual Communication Communication
Figure 2.5: This figure gives the expected association between the relationship variables and the success variables controlling for internal- and producer projects. For an external-producer project, it is speculated that greater receiver engineering effort will correlate more strongly with greater business success than it will for an internal-producer project. On the other hand, for internal-producer projects, a higher level of communication will correlate more with greater business success than it will for an external-producer project. In both graphs above, a smile indicates a more desirable result, and a frown indicates a less desirable result.
The differences between utilizing an internal producer and an external producer is one of the interesting associations investigated in this research. The investigation of the other implementation characteristics is described in the remaining sections.
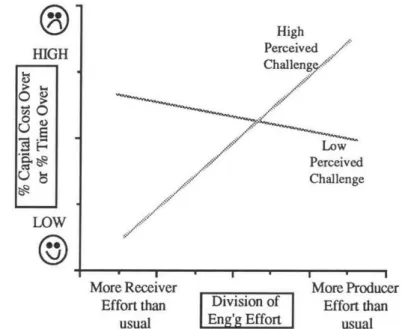
2. Perceived Challenge of the Project
The next parameter to investigate is the perceived challenge of the project. Level of challenge is a tough measure to quantify over a variety of different projects. This characteristic is meant to measure the receiver's per-ception of how challenging it is to design and develop the particular AMT to
complete the particular task. Although not exactly the same, this measure is meant to approach a value which is highly correlated with the level of tech-nical complexity of the new process. This type of complexity was emphasized in Tyre's work (1988).
It is speculated that a higher level of perceived challenge will be cor-related will lower project performance. More challenging projects, in gen-eral, tend to run into more difficulties. Therefore, the first hypothesis associ-ated with this project characteristic is the following:
Hypothesis 2A: Projects with higher levels of perceived
chal-lenge will be associated with lower business success.
It is also speculated that a higher level of perceived challenge by the re-ceiver will be associated with greater rere-ceiver involvement in all of the stages of the project. On the one hand, greater involvement by the receiver may be the result of the belief that for more challenging projects, more receiver in-volvement is useful. On the other hand, a receiver's higher perception of a project's challenge may be the result of his being involved to a greater degree in all of its stages. By being more involved, the receiver gains a better under-standing of the number of technical problems that needed to be resolved in order to get the AMT to function properly. For this reason, there may be a question of causality in this association. Nonetheless, the hypothesis for the association is as follows:
Hypothesis 2B: Higher levels of perceived challenge will be
asso-ciated with higher percentages of receiver engineering effort during all stages of the project.
The final area of investigation on the effect of the perceived challenge on the project outcome is similar in format to Hypothesis 1C. The
specula--- I
tion here is that projects with a high level of perceived challenge have a more positive (beneficial) association between higher percentages of receiver effort and higher business success than do projects with a low level of perceived challenge. This association is expected for all stages of the project. Figure 2.6 displays this expected association. For more challenging projects, a higher percentage of receiver involvement is more beneficial because the receiver can help to solve many of the technical unknowns. For less challenging pro-jects, a high percentage of receiver involvement has less positive effect on the business success because there is not the same need to solve a large number of the technical unknowns. Furthermore, for less challenging projects, a higher percentage of receiver involvement during the development stage may actu-ally be a sign of potentiactu-ally poor business performance. This is due to the ex-pectation that for less challenging projects, the producer usually has less diffi-culty developing the equipment on time and within cost, and that a higher percentage of receiver involvement may actually be a symptom of problems. In such a case, a higher percentage of receiver involvement could be associ-ated with decreased business success. The hypothesis for the expected associa-tion is the following:
Hypothesis 2C: A higher percentage of receiver engineering
ef-fort for a more challenging project will tend to have a more ben-eficial effect on the measures of business success than it (a higher percentage of receiver engineering effort) will tend to have for a less challenging project.
Expected Associations between the Division of Engineering Effort and Busi-ness Success Measures for All Project Stages
(Controlling for the Perceived Project Challenge)
0
. High HIGH Perceived Challengg" 409 (no Low Perceived Challenge LOW E AMore Receiver More Producer
Effort than Division of Effort than usual |Eng'g Effort sa
Figure 2.6: This figure gives the expected association between the division of engineering effort variables and the success variables, controlling for high and low challenge projects. For more challenging projects, it is speculated that a higher percentage of receiver engineering effort will correlate more strongly with greater business success. For less challenging projects, the di-vision of engineering effort is not shown to have a very strong association with the business suc-cess measures. Nonetheless, it is possible that this association may be stronger. In such a case, a higher percentage of receiver effort could be strongly associated with decreased business suc-cess. In the graph above, a smile indicates a more desirable result, and a frown indicates a less desirable result.
3. Previous Experience of the Receiver
The amount of experience that a receiver has with a particular type of technology should play some part in how well he is able to assimilate it into his environment. Previous experience with a technology should help the re-ceiving group more quickly adopt a similar technology. Furthermore, this experience should also allow the receiver to more accurately predict what the
capital cost of the equipment will be. With this view, the following hypothe-sis is given:
Hypothesis 3A: A higher level of previous experience of a
re-ceiver will tend to be positively associated with higher levels of business performance.
Another interesting hypothesis was presented by Gerwin (1982). Ger-win argued that prospective adopters of AMTs tend to place too much re-liance on the information provided by vendors, and this often leads to implementation problems later. It is not very surprising that this occurs be-cause many manufacturing plants lack the experience to understand how ad-vanced automation technologies work. Because of this lack of experience and knowledge, these manufacturing plants must rely on others' advice in choos-ing the best equipment. Anxious salesmen from automation vendors usually have a solution and can be very convincing at showing manufacturing engi-neers how it can solve their every need. Unfortunately, this familiar example of a "solution looking for a problem" is often seen in the implementation of AMTs.
In order to test the difference that the division of engineering effort has on the eventual project performance for a given level of receiver experience with the technology, the following hypothesis is presented:
Hypothesis 3C: A higher percentage of receiver engineering ef-fort for a project in which the receiver has a low level of prior experience will tend to have a more beneficial effect on the mea-sures of business success than it (a higher percentage of receiver engineering effort) will tend to have for a project in which the receiver has a high level of experience.
Expected Associations between the Division of Engineering Effort and Business Success for All Project Stages
(Controlling for Receiver's Previous Experience)
@ Low HIGH Receiver Receiver Experience LOW
>
More Receiver More Producer
Effort than Division of Effort than usual Eng'g Effort usual
Figure 2.7: The above graph displays the expected association between the division of engi-neering effort and the measures of business success. It is expected that for projects in which the
receiver has less prior experience with the technology that it is actually more beneficial to
business success for the receiver to be more involved in all stages of the project (than it would be
it he had a relatively high amount of prior experience). In the graph above, this association is expressed by the "Low Receiver Experience" line having a slope greater than that of the "High Receiver Experience" line. As always, in the graph above, a smile indicates a more de-sirable result, and a frown indicates a less dede-sirable result.
4. Changes in the Equipment during the Project
The next aspect of the implementation process that is investigated is the effect that the number of changes in the design of the equipment has on the eventual project success. Changes in the design of an AMT can cause
many problems in the development and integration stages. Nonetheless, the changes may be essential due to the changing needs of the receiving group.
Changes in the design of the equipment during the development and integration stages can cause a number of delays and an increase in the capital cost. For this reason it is expected that a large number of changes in the AMT will be adversely associated with business success.
Hypothesis 4A: A higher number of reported changes in the
de-sign of the AMT will be detrimental to business success.
If there are a large number of changes during the development and the integration, it seems reasonable to expect that the communication between the two groups would increase. A higher level of communication would re-sult due to its increased need.
Hypothesis 4B: A higher number of equipment changes will be
associated with a higher level of communication during the de-velopment and integration stages.
Furthermore, given the situation that there are a large number of changes in the equipment, it seems reasonable to assume that this communi-cation will be more beneficial than in the case of there being few equipment changes. If during the planning stage, the producing and receiving groups manage to completely and accurately design the equipment that the receiver will eventually need, there should be much less benefit from additional communication. But, if there are other changes in the receiver's manufacturing process which affect the design of the equipment, then higher communication would be very beneficial. The hypothesis for this expected association is given below, and the figure displaying the expected associations is given in Figure 2.8.
Expected Associations between the Level of Communication and Business Success for the Development and Integration Stages
(Controlling for the Number of Equipment Changes)
HIGH 0 9Few 0 0 Equipment . changes Man--' LOW Equipment
00
ChangesLower Level of Higher
Level of Communication Level of
Communication Communication
Figure 2.7: The above graph gives the expected effect of the level of communication on the eventual business success, controlling for the number of equipment changes For projects which are subject to many changes in the equipment during the development and the integration, strong communication is an important aspect of dealing with the changes. For this reason, higher communication during projects with many equipment changes is associated with greater business success. The importance of higher communication is not as strong for projects in which there are fewer equipment changes. In the graph above, a smile indicates a more desirable result, and a frown indicates a less desirable result.
Hypothesis 4C: A higher level of communication during the
development and integration stages when there are many equipment changes will tend to have a more beneficial effect on the measures of business success than it (a higher level of com-munication during the development and integration stages) will tend to have when there are few equipment changes.
5. Distance between the Producer and the Receiver
A large distance between the producer and receiver may be a problem
during an implementation. This problem may stem from the barrier that distance sets up. The effect of the distance is to prevent the interaction be-tween members of the opposite groups. This decreased ability to interact makes the implementation harder for a few reasons. First, it sets up a barrier to the producer being able to spend time within the receiver's environment during the planning and integration. This time would be helpful in the abil-ity of the producer to understand the receiver's needs during the planning stage and to quickly integrate the equipment during the integration stage. Distance further inhibits the ability of the receiver to spend time at the pro-ducer's facilities during the development to confirm that the equipment is progressively being built to the needed specifications. All of the above rea-sons suggest that larger distances will have a detrimental effect on business success.
On the other hand, a larger distance may tend to have a positive effect on the eventual transfer success. This difference in expected behavior be-tween the transfer success measures and the business success measures is a very interesting effect. It is speculated that if there is a large distance between the two groups, the receiver will be forced to understand the technology in order to fix it when it is having problems. The receiver may not have the op-tion of depending on the producer to fix problems because of the inhibitive distance. If there is a shorter distance between groups, the receiver can simply call on the producer, either through a service contract or a warranty on the equipment, to fix major and minor problems. In doing so, much of the learning that the receiver could gain from "tinkering" around with the
equipment is lost. For example, one producing engineer who worked a very close distance from his receiving group (an internal-producer project) com-mented that the receiving group never made much effort to learn the tech-nology that he had developed and integrated into their manufacturing line. Whenever the smallest problem presented itself, they never even considered attempting to figure it out; they would simply call the producing engineer. This was fine for awhile, but eventually the engineer had other projects that needed attention. This producing engineer's view was that the only time that the receiving group "played around" with the equipment was when he was on vacation - probably when they learned the most about it. Certainly in a long distance project, the receiving group has no option but to "play" around with a technology that is not operating correctly. For this reason, the follow-ing hypothesis is given:
Hypothesis 5A: A longer distance between the producer and the
receiver of an AMT will be detrimental to business success. On the other hand, a longer distance between the producer and the receiver will be beneficial to greater transfer success.
It is speculated that distance will have a reducing effect on the level of communication. This would not be very surprising. Much work done by Allen (1977) has shown the strong effect that distance has on decreasing the level of communication.
The effect of distance on the division of the engineering effort is not so clear. The speculation here will be that the greater the distance then the less the two groups will work together during each stage. The result of this would be that for longer-distance projects, more of the engineering effort during the planning and integration stages will be completed by the receiver. Likewise, for the development stage, more of the engineering effort will be completed
by the producer. These speculations result from the premise that most of the
engineering work during the planning and integration stages takes place at the receiver's location. On the other hand, most of the development will occur at the producer's location. As it increases, the distance has the effect of making it harder for members of one group to spend time at the other group's facilities. This makes it harder for members of opposite teams to work together. The hypothesis for this expected association is given below.
Hypothesis 5B: Longer distances between the producer and the
receiver will be associated with lower levels of communication during all stages. Also, longer distances between the producer and the receiver will be associated with lower percentages of producer engineering effort during the planning and integration stages, and longer distances will be associated with lower per-centages of receiver effort during the development stage.
6. Length of the Project
The length of the project can, to a certain degree, be a reflection of how large a task it is. Projects that are larger and longer tend to run into more problems than smaller, shorter tasks. For this reason, it is expected that longer projects will be associated with lower project performance.
Hypothesis 6A: Project length will be negatively correlated with
3
Research Design and Methodology
The aim of this research has been to explore the various factors which both beneficially and detrimentally affect the implementation of advanced manufacturing technologies. To do so, the basic strategy has been to gather the understanding of a large number of individuals who have been involved in the process.
The first part of the study involved developing a strong understanding of these underlying factors. This was done with open-ended interviews with engineers and managers who had a broad range of experience in this area. The types of questions asked were similar to those used by Ettlie (1986) in one of his more qualitative studies of this topic. These questions were along the lines of "What is the most important factor which affects the success of an AMT project?" and also "What types of problems have you experienced, and how have you overcome them?" Through these open-ended interviews the researcher was able to get a strong understanding of the issues from the
per-ceptions of members of both producing and receiving groups.
From all this, the researcher was able to develop a comprehensive questionnaire which could be distributed to a larger number of interviewees. (The parts of the questionnaire used in this analysis are given in Ap-pendix A.) A number of projects were sought in order to collect samples. Through the help of individuals at the sponsoring company, sixteen projects were found.