Publisher’s version / Version de l'éditeur:
Journal of Environmental Radioactivity, 102, 11, pp. 1018-1023, 2011
READ THESE TERMS AND CONDITIONS CAREFULLY BEFORE USING THIS WEBSITE.
https://nrc-publications.canada.ca/eng/copyright
Vous avez des questions? Nous pouvons vous aider. Pour communiquer directement avec un auteur, consultez la première page de la revue dans laquelle son article a été publié afin de trouver ses coordonnées. Si vous n’arrivez pas à les repérer, communiquez avec nous à PublicationsArchive-ArchivesPublications@nrc-cnrc.gc.ca.
Questions? Contact the NRC Publications Archive team at
PublicationsArchive-ArchivesPublications@nrc-cnrc.gc.ca. If you wish to email the authors directly, please see the first page of the publication for their contact information.
NRC Publications Archive
Archives des publications du CNRC
This publication could be one of several versions: author’s original, accepted manuscript or the publisher’s version. / La version de cette publication peut être l’une des suivantes : la version prépublication de l’auteur, la version acceptée du manuscrit ou la version de l’éditeur.
For the publisher’s version, please access the DOI link below./ Pour consulter la version de l’éditeur, utilisez le lien DOI ci-dessous.
https://doi.org/10.1016/j.jenvrad.2011.06.008
Access and use of this website and the material on it are subject to the Terms and Conditions set forth at
Aerial measurement of radioxenon concentration off the west coast of
vancouver island following the fukushima reactor accident
Sinclair, L. E.; Seywerd, H. C. J.; Fortin, R.; Carson, J. M.; Saull, P. R. B.;
Coyle, M. J.; Van Brabant, R. A.; Buckle, J. L.; Desjardins, S. M.; Hall, R. M.
https://publications-cnrc.canada.ca/fra/droits
L’accès à ce site Web et l’utilisation de son contenu sont assujettis aux conditions présentées dans le site LISEZ CES CONDITIONS ATTENTIVEMENT AVANT D’UTILISER CE SITE WEB.
NRC Publications Record / Notice d'Archives des publications de CNRC: https://nrc-publications.canada.ca/eng/view/object/?id=8a3de32c-a4c1-408a-9125-a6aeba4cf29e https://publications-cnrc.canada.ca/fra/voir/objet/?id=8a3de32c-a4c1-408a-9125-a6aeba4cf29e
Aerial Measurement of Radioxenon Concentration off
the West Coast of Vancouver Island following the
Fukushima Reactor Accident
L.E. Sinclair1 , H.C.J. Seywerd1 , R. Fortin1 , J.M. Carson1 , P.R.B. Saull2 , M.J. Coyle1
, R.A. Van Brabant1
, J.L. Buckle1
, S.M. Desjardins1
, R.M. Hall1
1
Geological Survey of Canada, Natural Resources Canada, 601 Booth St, Ottawa, Ontario, K1A 0E8, Canada
2
Institute for National Measurement Standards, National Research Council, 1200 Montreal Rd, Ottawa, Ontario, K1A 0R6, Canada
Abstract
In response to the Fukushima nuclear reactor accident, on March 20th, 2011, Natural Resources Canada conducted aerial radiation surveys over water just off of the west coast of Vancouver Island. Dose-rate levels were found to be consistent with background radiation, however a clear signal due to133
Xe was observed. Methods to extract 133
Xe count rates from the measured spectra, and to determine the corresponding 133
Xe volumetric concentration, were developed. The measurements indicate that133
Xe concentrations on average lie in the range of 30 to 70 Bq/m3
.
Keywords: Fukushima, reactor accident, Xe-133, Xenon, radioxenon, nuclear reactor, airborne, aerial, Monte Carlo, EGSnrc, plume
1. Introduction
During March and April of 2011, in response to the Fukushima reactor accident, Natural Resources Canada conducted aerial and truck-mounted ra-diation surveys in the Victoria, Vancouver and Haida Gwaii areas and off the west coast of Vancouver Island. Although radiation levels from Japan were predicted to be extremely low in these areas, dose rates were measured as a precautionary safety measure. No increased levels of radiation were detected and the dose rates were found to be consistent with normal background ra-diation.
Figure 1: Geometry of the RSX-5 detector, showing the arrangement of the five large rectilinear NaI(Tl) crystals.
The first of the surveys, conducted on March 20th, 2011, was an airborne survey with the equipment installed inside a Pilatus PC-12 aircraft. The survey was flown at approximately 250 m above mean sea level along the west coast of Vancouver Island. This survey was flown several kilometres out to sea in order to increase sensitivity to man-made radiation by decreasing the count rate coming from terrestrial radiation. A clear radioxenon signal was observed on this flight. However, although the equipment was calibrated for total air kerma, no calibration for the measurement of absolute radioxenon concentration was available. Furthermore, the emergency response procedure followed for these measurements entailed the use of an aircraft belonging to the Royal Canadian Mounted Police, for which a calibration had not been completed, complicating the correction of the data for aircraft attenuation.
In this paper, we present our method for extraction of 133
Xe count rate from the airborne data collected on March 20th. We then present an approach to convert those count rates into a volumetric plume concentration. Finally, we present the measured 133
Xe concentrations.
2. Data Collection
Gamma spectra were collected using an RSI RSX-5 detector (RSI, 2011). The detector consists of five 10.16 cm x 10.16 cm x 40.64 cm (4 inch x 4 inch x 16 inch) NaI(Tl) crystals. The five crystals are packaged such that four lie beside each other and the fifth lies on top, as indicated in Figure 1. The crystals are optically isolated from each other and each is mated to a pho-tomultiplier tube (PMT) for collection of the scintillation light. Individual
crystals are clad in Al and then wrapped in felt for cushioning. The package assembly is constructed of foam and carbon fibre to provide structural sup-port and insulation while allowing maximal penetration of low-energy gamma rays.
The PMT pulses are digitized and recorded as a 1024-channel energy spectrum. Energies in the spectrum range from 0 to 3 MeV with one channel recording hits due to cosmic radiation which lies in the range of 3 MeV to 6 MeV. An energy calibration with a137
Cs check source is performed when the instrument is powered on and thereafter the gain is automatically stabilized using the energy peaks due to naturally occuring isotopes.
A GPS receiver records position information and the GPS position and energy spectrum are recorded to a memory device (and optionally displayed on a computer in real-time) once per second.
On March 20th, 2011, the RSX-5 was installed in a Pilatus PC-12 fixed-wing aircraft. The aircraft flew from Victoria, British Columbia, to the west coast of Vancouver Island and then surveyed moving north-west along the coastline a few kilometres out to sea. The aircraft flew at a constant height of about 250 m above sea-level at an approximately constant speed of 410 km/hr to the north-west tip of the island. On the return journey, the aircraft flew at a series of higher elevations, up to 2900 m. Due to the complexity of cor-rection of the higher altitude data for cosmic radiation effects, this paper will present only the data from the 250 m altitude outbound journey. The data presented here span a ∼ 350 km distance and ∼ 53 minute time interval. To show the position-dependence of the data with sufficient statistical precision, the data have been accumulated into 20 s intervals.
On April 21st, 2011, over four weeks after the accident began, indications were that the radiation from Fukushima had reduced by several orders of magnitude (BGR, 2011; HC, 2011). A baseline survey was therefore con-ducted by flying along the coastline at 330 m altitude at an approximate speed of 400 km/hr. To understand the cosmic contribution, additional data were collected at a series of different altitudes over the ocean off the north-west tip of the island.
3. Analysis
There are two major steps in the treatment of the data to obtain the activity of anthropogenic radionuclides: 1) the subtraction of expected nat-ural backgrounds and 2) the conversion of count rates in s−1 to volumetric
Energy (keV) 0 50 100 150 200 250 300 N/s/bin 0 10 20 30 40 50 a) March 20th data April 21st data Energy (keV) 0 50 100 150 200 250 300 N/s/bin 0 10 20 30 40 50 b) March 20th data cosmic + aircraft cosmic aircraft
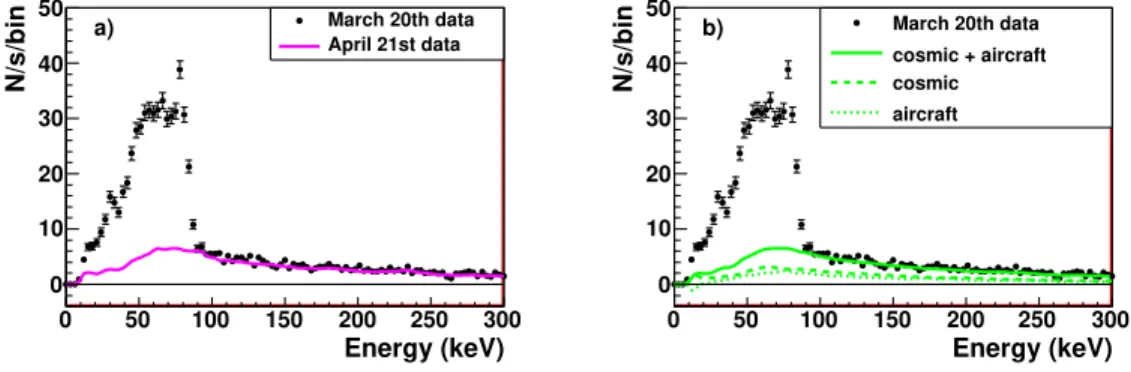
Figure 2: Measured energy spectrum for one 20 s interval of the data taken on March 20th, 2011 at 250 m above mean sea level . The error bars represent the one standard deviation statistical uncertainty. In a) the curve shows the average measured spectrum from a baseline survey conducted along the Vancouver Island coastline on April 21st, 2011, where the baseline survey has been scaled to match the March 20th data over the energy range from 120 keV to 1500 keV. In b) the solid curve shows an estimate for the cosmic and aircraft backgrounds derived from a geophysical survey conducted using the same kind of spectrometer but a different aircraft. The dashed and dotted curves show the components of this background attributed to cosmic rays and to the aircraft, respectively.
concentration in Bq/m3
.
3.1. Background subtraction
The measured spectrum from one 20 s interval, normalized to live-time, is shown in Fig. 2 a) by the black dots, where we have focussed on the energies below 300 keV. A peak at energies around 80 keV and lower, is apparent in the data, sitting on top of a small natural continuum spectrum.
The spectrum from the baseline survey conducted April 21st, 2011, aver-aged over the entire flight length, is shown in Fig. 2 a) as the solid curve. By examination of the relative heights of the214
Bi energy peak at 609 keV in the two datasets (not shown), it was determined that the radon concentration on April 21st was slightly lower than it had been on March 20th. Therefore the baseline spectrum was scaled up by factors of ∼1.25 to match the data over the energy range of 120 keV to 1500 keV, for each 20 s interval of the March 20th data.
A clear excess above the baseline survey data is observed in the March 20th data, with a peak at an energy of 81 keV. This is the photopeak energy of 133
photopeaks due to fission products by accumulating the entire flight path into one spectrum, but no other significant contaminants were found.)
To obtain the count rate due to133
Xe, the scaled baseline survey spectrum was subtracted from the March 20th spectrum and the count rate in the difference spectrum was integrated over the energy range from 40 keV to 90 keV. Of course, the 133
Xe count rate presented herein is specific to our detector and method. The determination of the actual plume concentration, which can be compared across measurement systems, is the subject of the following sub-section.
To understand the potential uncertainty introduced in the extracted133
Xe count rate by mis-measurement of the baseline spectrum, a number of alter-nate baseline spectra were examined. It is common practice in geophysical surveying to establish the cosmic and aircraft backgrounds by taking a series of measurements at different altitudes over a body of water (IAEA, 1991). For each spectral bin, a linear fit of the dependence of the count rate on counts in the cosmic channel is performed. These slopes then allow for the interpolation of the cosmic component of the natural spectrum to any alti-tude, and the intercepts of the fit constitute the aircraft background.
Fig. 2 b) shows the same March 20th data sample, this time compared to cosmic and aircraft background spectra taken from a geophysical survey flown in 2007 over Eda Lake in the North West Territories. This comparison survey used the same kind of RSX-5 survey system, but a different model of aircraft. The 133
Xe count rate extracted using this alternate baseline is in very good agreement with the signal extracted using the April 21st baseline flight.
Finally, a fit for cosmic and aircraft backgrounds was applied to data from flights taken at altitudes ranging from 2400 m to 6000 m off of the north-west tip of the island on April 21st. The background spectrum obtained using these parameters is in excellent agreement with that obtained from the baseline survey along the coast.
In the presentation of count rates in Section 4, the variation in the sig-nal obtained with the three different methods of background subtraction is included as a systematic uncertainty.
3.2. Concentration conversion
To understand the signal spectrum, and to obtain a conversion of count rate to concentration, we made a number of Monte Carlo simulations using the EGSnrc C++ code system (Kawrakow et al., 2011a,b).
The RSX-5 simulation included the NaI(Tl) crystals in the Al cladding, the foam and felt between and around them, and the carbon fibre housing.
The aircraft was modelled as a uniform spherical shell of solid Al of nomi-nal radius 2 m and varying thicknesses, with the RSX-5 situated at the centre of the spherical shell.
To obtain the effective thickness of the aircraft fuselage for the simula-tions, a series of attenuation measurements were conducted in the aircraft hangar on April 19th, 2011. A 137
Cs point source was placed at various loca-tions against the outside of the aircraft body. Counts due to this source were measured on the inside of the aircraft using a single 10.16 cm x 10.16 cm x 40.64 cm (4 inch x 4 inch x 16 inch) NaI(Tl) crystal and an RSI 705 spectrometer. By comparison of the attenuated count rate with that ex-pected in the absence of the aircraft, the attenuation due to the aircraft was measured. The effective thickness of an equivalent uniform solid spherical shell of Al was then determined. The aircraft showed considerable varia-tion in effective thickness, being for example much thinner on the top than on the bottom, which is unsurprising. The various thickness measurements were then combined in proportion to the relative area of the section of air-craft they represented and a rough estimate for average effective thickness of (1.46 ± 0.33) cm was obtained.
Geometric arguments based on the aircraft operating weight and overall dimension support this effective fuselage thickness, so the value of 1.5 cm was used in the nominal Monte Carlo simulations. The estimate of aircraft effec-tive fuselage thickness and the uncertainty arising from imperfect knowledge of it were further refined in the Monte Carlo study described below.
The source used in the simulations was spherical, centred on the RSX-5, and filled with some concentration of isotropically emitting point sources of gamma radiation. The emitters were uniformly distributed throughout the spherical plume, both inside and outside of the simulated aircraft. The nominal plume radius was 300 m. The source spectrum representing 133
Xe contained two lines, an 81 keV line with 38% branching ratio, and a 31 keV line to represent all of the major X-ray emissions, with 50% branching ratio.
The spherical plume of 133
Xe was situated inside a cubic volume of air with sides of length four times the radius of the plume. Interactions in the air inside and outside of the aircraft were simulated. The air was treated as dry air at atmospheric pressure, and pressure differences between the inside and outside of the aircraft were neglected.
cross sections were used and Rayleigh scattering and atomic relaxations were turned on. Potential contributions to the spectrum from 133
Xe beta decay and internal conversion processes were investigated but found not to warrant inclusion. Electrons and photons were transported down to a kinetic energy of 10 keV. (Going to lower energy, 1 keV, did not have a noticeable effect on the results, but increased the simulation time considerably.) A total of 1011
emissions were generated in the nominal configuration, leading to ∼15,000 counts interacting in the detector. The statistical uncertainty on the generated spectra is smaller than that of the measured spectrum over a 20 s interval.
The simulated energy deposits in the NaI(Tl) crystals were smeared ac-cording to a resolution function for the RSX-5 which was tuned at low ener-gies by measuring the photopeak widths for241
Am (59 keV), 109
Cd (88 keV) and 57
Co (122 keV).
In Fig. 3 a) the extracted 133
Xe spectrum for one 20 s interval of the March 20th data is shown by the black dots. The solid curve shows the prediction for the spectrum due to a 133
Xe plume of 300 m radius obtained by simulation. We find that the data are well described by the 300 m plume prediction, in the energy range of 40 keV to 90 keV.
One may note that there is a discrepancy between data and simulation in the vicinity of the 31 keV X-ray emissions. While the 81 keV gammas origi-nate predominantly outside of the aircraft, attenuation by the aircraft body assures that any detected 31 keV X-rays were likely to have been emitted from within the aircraft. The simulation of the X-rays is thus highly sensi-tive to details of the shape of the aircraft in the simulation. This is also the energy where there are unsimulated lower-level discriminator effects in the data and where the details of the simulation of the detector housing become relevant. The excess at 31 kev could also hint at the presence of 131m
Xe or
133m
Xe which yield X-rays in the 30-35 keV region in more than half of their decays. (The 164 keV gamma of 131m
Xe is emitted in only 2% of its decays and the 232 keV gamma of 133m
Xe is emitted in only 8% of its decays and the presence of these peaks in the data can not be ruled out.)
In the following our analysis is based entirely on the energy spectrum above 40 keV.
Fig. 3 a) also shows Monte Carlo predictions for spectra due to plumes of various smaller radii, down to a plume of 3 m radius, where all of the Monte Carlo curves have been normalized to the same plume concentration. The smaller plume radii illustrate how the scattering of the 81 keV gamma-rays in
Energy (keV) 0 20 40 60 80 100 120 140 N/s/bin 0 10 20 30 40 50 a) data R = 300 m R = 200 m R = 100 m R = 50 m R = 3 m Distance (km) 50 100 150 200 250 300 350 /ndf 2 χ 0 0.5 1 1.5 2 2.5 3 b) Thickness (cm) 0 0.5 1 1.5 2 2.5 3 3.5 /ndf> 2 χ < 0 0.5 1 1.5 2 2.5 3 3.5 4 4.5 5 c)
Figure 3: In a) the black dots show the energy spectrum for the extracted signal for one 20 s interval of data. The error bars represent the statistical uncertainty on the data. The solid curve shows the Monte Carlo simulation for a plume of radius 300 m. Additional curves show the Monte Carlo predictions for plumes of radii 200 m, 100 m, 50 m and 3 m, where all Monte Carlo predictions have been normalized to a plume concentration of 66 Bq/m3
. In b) the χ2
/ndf from the comparison of Monte Carlo to data is shown for each 20 s dataset as a function of distance along the coastline. In c) the average χ2
/ndf over all of the 20 s intervals is shown for different effective fuselage thicknesses used in the simulation.
air leads to the population of the spectrum above the 31 keV X-ray region and below the 81 keV photopeak. We find that plumes with radii less than 200 m lead to a spectrum which is inconsistent in shape with the measured 133
Xe spectrum. We also determined (not shown) that generation of plumes with radii greater than 300 m did not improve our understanding of the data. Due to attenuation in air, plumes with radii greater than 300 m are not significantly different in shape or magnitude from the 300 m radius plume. Therefore, the data from this 20 s interval are consistent with emission from an infinite and uniform 133
Xe plume.
The Monte Carlo simulations provide a 133
Xe count rate to volumetric concentration conversion factor of (0.177 ± 0.001) Bq/m
3
s−1 (statistical
uncer-tainty only). Multiplying the measured count rate over the 40 keV to 90 keV interval by this conversion factor, the concentration of 133
Xe for this 20 s in-terval was determined to be (66.0±1.0) Bq/m3
(statistical uncertainty only). The concentrations for each of the other 20 s intervals were likewise deter-mined by application of the count rate to concentration conversion factor.
To determine the goodness of each of the comparisons of Monte Carlo and data, the χ2
per degree of freedom (χ2
/ndf) was calculated for each sample. The χ2
/ndf values are shown in Fig. 3 b) as a function of distance along the coastline. Overall, the simulation provides a good representation of the data, and no location stands out as having differently shaped spectra.
To quantify the uncertainty on the effective fuselage thickness, Monte Carlo samples were generated with thicknesses ranging from 0.5 cm to 3 cm. The average χ2
/ndf over all of the 20 s intervals, < χ2
/ndf >, is shown in Fig. 3 c) versus the fuselage thickness used in the simulation. By examination of Fig. 3 c) we have determined that an aircraft fuselage of 1.5 cm provides a good representation of the data, supporting the choice of 1.5 cm as the nom-inal effective fuselage thickness. The effect on the calculated concentrations of variation of the fuselage thickness between 1.2 cm and 1.8 cm is included in the systematic uncertainty on the measured concentrations.
4. Results
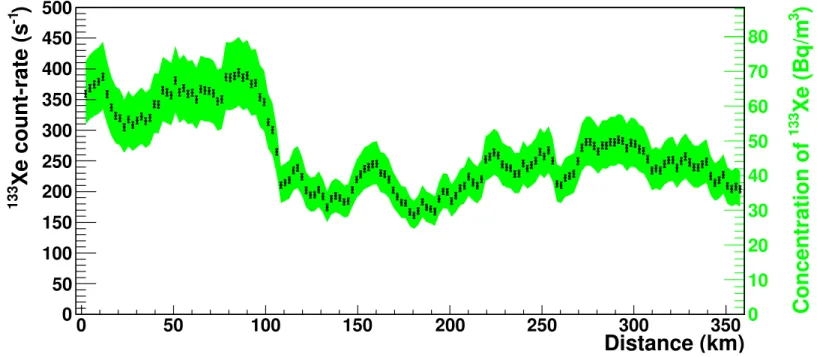
In Fig. 4 the count rate due to 133
Xe for each 20 s interval is shown as a function of distance along the coastline from an arbitrary starting point. The time of the beginning of the first measurement at zero distance is March 20th, 2011, 11:02:58 am PDT and each subsequent measurement is 20 s later. Inner
error bars show the one standard deviation statistical uncertainty and outer error bars show the systematic uncertainty due to the baseline subtraction added in quadrature. (The systematic uncertainty is in many locations very small such that the outer error bars are not distinguishable from the inner error bars.)
We find that the signal due to 133
Xe is significantly above zero at all locations. To our knowledge, this is a first publication of radioxenon con-centrations measured by flying through the plume. A notable flight through the Chernobyl plume was made by the Geological Survey of Finland, how-ever that analysis was hampered by contamination of the aircraft due to the presence of radioactive particulates close to the plume origin (Grasty et al., 1997). We also find that the count rate can vary strongly with position, by almost a factor of two over a 15 km distance, a flight taking just over two and a half minutes. Note that our simulations indicate that over 98% of the 133
Xe signal originated from sources outside of the aircraft. Therefore each measurement reflects the 133
Xe concentration at the local geographic coordinates. The strong variability of count rate along the transection seems surprising given the distance the plume has travelled from Japan to Canada and it is hoped that this information will eventually prove useful in refining models for atmospheric transport.
Using the right-hand axis in Fig. 4, the measurements may be read as plume concentrations. The shaded band shows the correlated uncertainty on the concentration measurements coming from the uncertainty on the effective aircraft fuselage thickness. We find that concentrations vary from about 30 Bq/m3
to 70 Bq/m3
along the coastline. These measurements are in broad agreement with ground-based 133
Xe measurements made at a different location following the Fukushima accident which have been published by another group (Bowyer et al., 2011). Given the very different technology and methodology used in the two analyses, the similarity of the results is a strong confirmation of the earlier measurement.
Note that we have made the assumption that the plume is infinite and uniform in extracting plume concentrations, while we clearly observe a vari-ation in the plume concentrvari-ation with distance. The distance over which the measurements in Fig. 4 were integrated was approximately 2.3 km. In fact, due to the attenuation of air, the plume need only be uniform over distance scales of around 200 m in order for our concentration calculation to be valid. Effectively, we have made the assumption that while the plume concentration can vary significantly over a distance of 2.5 km, the variation is gradual over
Distance (km)
)
-1Xe count-rate (s
133)
3Xe (Bq/m
133Concentration of
0 10 20 30 40 50 60 70 80 0 50 100 150 200 250 300 350 0 50 100 150 200 250 300 350 400 450 500Figure 4: The measured133
Xe count rate in the interval of 40 keV to 90 keV as a function of distance from the survey starting point is shown by the black dots, read from the left-hand axis. The inner error bars show the one standard deviation statistical uncertainty and the outer error bars show the systematic uncertainty associated with the background subtraction added in quadrature (not always distinguishable from the inner error bars). Using the axis on the right-hand side, the measurements may be read as concentrations due to an infinite uniform plume of133
Xe. The shaded band shows the correlated systematic uncertainty on the concentrations due to uncertainty in the effective aircraft fuselage thickness.
Easting (m) N o rt h in g ( m ) 100000 150000 200000 250000 300000 350000 5 4 0 0 0 0 0 5 4 5 0 0 0 0 5 5 0 0 0 0 0 5 5 5 0 0 0 0 5 6 0 0 0 0 0 46 43 49 52 55 58 61 64 67 34 37 40 Xe Bq/m 133 3 Figure 5: 133
Xe concentration is shown using a colour scale, versus the geographic coor-dinates Easting and Northing in Universal Transverse Mercator zone 10.
distances of ∼ 200 m.
A map showing the georeferenced concentration data overlaid on the local geography is presented in Fig. 5. It is anticipated that this information will be useful in validating calculations of the Fukushima reactor radioxenon inventories.
5. Conclusions
On March 20th, 2011, Natural Resources Canada flew radiometric surveys off the west coast of Vancouver Island, to investigate a suspected radioac-tive plume from the damaged Fukushima reactors. We found a signal due
to 133
Xe and no significant signals due to other contaminants. The 133
Xe count rate was observed to vary strongly with position, by almost a factor of two over a distance of ∼ 15 km. Monte Carlo simulations were performed in order to understand the signal and convert it to a measurement of con-centration. The signal was found to be consistent with an infinite plume, uniformly populated with isotropic 133
Xe point sources. The concentration of the plume was determined to lie in the range of 30 Bq/m3
to 70 Bq/m3
. A map showing the variation of the133
Xe plume concentration with geographic position is presented. This information has been used to support radioxenon measurements using alternate methods, and may be used to validate models for the progression of the Fukushima reactor accident.
Acknowledgements
We are grateful to Dr. J. Hovgaard from Radiation Solutions Inc. and to K. Ungar and E. Korpach from Health Canada for scientific advice. We gratefully acknowledge the Royal Canadian Mounted Police for their part-nership and assistance with the mission. Some of the funding for equipment used in this measurement was obtained from Canada’s Chemical Biological Radiological and Nuclear Research and Technology Initiative. This report is ESS Contribution Number 20110080.
References
Berger, M., Hubbell, J., Seltzer, S., Chang, J., Coursey, J., Sukumar, R., Zucker, D., Olsen, K., 2011. XCOM: Photon Cross Section Database (ver-sion 1.5). http://physics.nist.gov/xcom [01-Jun-2011 10:51:25 EDT]. Bowyer, T., Biegalski, S., Cooper, M., Eslinger, P., Haas, D., Hayes, J., Miley,
H., Strom, D., Woods, V., 2011. Elevated radioxenon detected remotely following the Fukushima nuclear accident. J. Environmental Radioactivity 102, 681–687.
BGR, 2011.
http://www.bgr.bund.de/DE/Themen/Erdbeben- Gefaehrdungsanalysen/Seismologie/Kernwaffenteststopp/Verifikation/Atmosphaer-Transport/Besondere%20Ereignisse/atm fukushima inhalt.html
[02-Jun-2011 9:36:25 EDT].
Grasty, R., Hovgaard, J., Multala, J., 1997. Airborne Gamma Ray Measure-ments in the Chernobyl Plume. Radiat. Prot. Dosimetry 73 (1-4), 225–230.
HC, 2011. http://www.hc-sc.gc.ca/hc-ps/ed-ud/respond/nuclea/2011-03-17-eng.php [01-Jun-2011 10:51:25 EDT].
IAEA, 1991. Airborne Gamma Ray Spectrometer Surveying, IAEA Tech. Rep. 323.
Kawrakow, I., Mainegra-Hing, E., Rogers, D., Tessier, F., Walters, B., 2011a. The EGSnrc Code System, NRC Report PIRS-701.
Kawrakow, I., Mainegra-Hing, E., Tessier, F., Walters, B., 2011b. The EGSnrc C++ class library, NRC Report PIRS-898.
RSI, 2011. Radiation Solutions Inc., Mississauga, Ontario, Canada. http://www.radiationsolutions.ca [01-Jun-2011 10:41:25 EDT].