Publisher’s version / Version de l'éditeur:
Research Report (National Research Council of Canada. Institute for Research in
Construction), 2005-05-03
READ THESE TERMS AND CONDITIONS CAREFULLY BEFORE USING THIS WEBSITE. https://nrc-publications.canada.ca/eng/copyright
NRC Publications Archive Record / Notice des Archives des publications du CNRC :
https://nrc-publications.canada.ca/eng/view/object/?id=9a6ab4b7-8e7f-4ea5-a870-bc62f5470516 https://publications-cnrc.canada.ca/fra/voir/objet/?id=9a6ab4b7-8e7f-4ea5-a870-bc62f5470516
NRC Publications Archive
Archives des publications du CNRC
For the publisher’s version, please access the DOI link below./ Pour consulter la version de l’éditeur, utilisez le lien DOI ci-dessous.
https://doi.org/10.4224/20378354
Access and use of this website and the material on it are subject to the Terms and Conditions set forth at
Assessment of Energy Performance of Window Shading Systems at the
Canadian Centre for Housing Technology
Canadian Centre
Centre canadien des
for Housing Technology
technologies résidentielles
Assessment of Energy Performance of Window Shading Systems at the Canadian Centre for Housing
Technology
Galasiu, A.D.; Reinhart, C.F.; Swinton, M.C.; Manning, M.M.
IRC-RR-196
A version of this document is published in / Une version de ce document se trouve dans:
The Canadian Centre for Housing Technology (CCHT)
Built in 1998, the Canadian Centre for Housing Technology (CCHT) is jointly operated by the National Research Council, Natural Resources Canada, and Canada Mortgage and Housing Corporation. CCHT's mission is to accelerate the development of new technologies and their acceptance in the marketplace.
The Canadian Centre for Housing Technology features twin research houses to evaluate the whole-house performance of new technologies in side-by-side testing. The twin houses offer an intensively monitored real-world environment with simulated occupancy to assess the performance of the residential energy technologies in secure premises. This facility was designed to provide a stepping-stone for manufacturers and developers to test innovative technologies prior to full field trials in occupied houses.
As well, CCHT has an information centre, the InfoCentre, which features a showroom, high-tech meeting room, and the CMHC award winning FlexHouse™ design, shown at CCHT as a demo home. The InfoCentre also features functioning state-of-the art equipment, and demo solar photovoltaic panels. There are over 50 meetings and tours at CCHT annually, with presentations and visits occurring with national and international visitors on a regular basis.
ASSESSMENT OF ENERGY PERFORMANCE OF WINDOW SHADING SYSTEMS
AT THE CANADIAN CENTRE FOR HOUSING TECHNOLOGY
A.D. Galasiu, C.F. Reinhart, M.C. Swinton, and M. M. Manning
Institute for Research in Construction
National Research Council Canada
Ottawa, K1A 0R6
Research Report No. 196
TABLE OF CONTENTS
page Table of Contents ...….. 2 Abstract …………...………. 3 Acknowledgment ...…. 4 Introduction ...….. 5 Experimental Design...…. 5 Results ………...……… 9Winter tests: Effect of window shading systems on the Heating Load ……….. 9
Houses benchmarking...……… 9
Interior window shading versus no shading: Daytime and night-time combined effect...… 10
Interior window shading: Daytime effect ...… 11
Interior window shading versus exterior shading: Daytime and night-time combined effect.. 12
Interior window shading versus exterior shading: Daytime effect...……… 12
Summer tests: Effect of window shading systems on the Cooling Load ………. 12
Houses benchmarking...……….. 12
Interior window shading: Daytime effect ………. 13
Interior window shading versus exterior shading: Daytime effect ……… 13
Interior window shading versus exterior shading: Daytime and night-time combined effect… 14 Conclusions ………. 19
ABSTRACT
This report presents the results of several window shading experiments conducted at the Canadian Centre for Housing Technology (CCHT) research centre located in Ottawa, Canada, to identify a testing procedure for window shading products. The results provided an overview of the order of magnitude of the energy effects that can be expected from shading devices in a residential dwelling in Ontario in the summer and winter, and formed the basis for recommendations for an experimental procedure to be used in future research projects involving the testing of shading devices at CCHT.
ACKNOWLEDGMENT
This work was funded by the Institute for Research in Construction of the National Research Council Canada. The authors would like to acknowledge the valuable contribution of Frank Szadkowski of Natural Resources Canada's (NRCan) Buildings Group who assisted on site with the data collection and ensured the proper operation of the CCHT Research Houses throughout the experiments. Special gratitude also goes to Ken Ruest of Canada Mortgage and Housing Corporation (CMHC) who assisted in reviewing the results and the report.
ASSESSMENT OF ENERGY PERFORMANCE OF WINDOW SHADING SYSTEMS AT THE CANADIAN CENTRE FOR HOUSING TECHNOLOGY
A.D. Galasiu, C.F. Reinhart, M.C. Swinton, and M. M. Manning
INTRODUCTION
This report presents the results of several window shading experiments conducted at the Canadian Centre for Housing Technology (CCHT) research centre located in Ottawa, Canada, to identify a testing procedure for window shading products. The shading configurations tested were selected to define extreme conditions for maximum heating and cooling energy impact. The results provide an overview of the order of magnitude of the energy effects that can be expected from shading devices in a residential dwelling in Ontario in the summer and winter.
The main objectives of this study were:
• To develop a testing procedure for window shading devices at CCHT;
• To test the potential benefit of using external shading devices in Canadian residential applications.
EXPERIMENTAL DESIGN
A series of window shading configurations were tested at the Canadian Centre for Housing Technology (CCHT) during 39 days in December 2001 and January 2002, and for 12 days in July 2002 to investigate the effect of two types of shading devices on the energy consumption for heating and cooling.
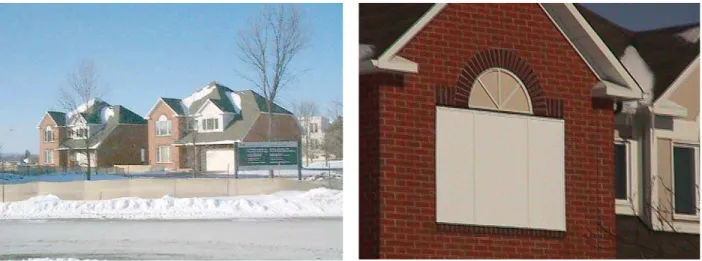
The CCHT research centre (Figure 1) consists of two side-by-side, 2-storey, wood-frame houses built in Ottawa according to the R-2000 standard. The center was developed to offer a real, full-size testing facility for new construction technologies and permits a real comparison of the energy impact caused by these technologies. For this purpose, the twin houses have been carefully benchmarked to have nearly identical winter and summer energy consumption when equipped with equivalent heating and cooling equipment. One of the houses (shown on the right in Figure 1) is usually used as a baseline and is referred to as the reference house, while the testing of advanced technologies happens in its twin to the left, which is referred to as the test house.
However, even though the same nomenclature was adopted in this report, this study did not follow the usual procedure used in other CCHT projects, where the reference house is maintained unchanged and used as a basecase, while the changes are implemented in the test house only. In this study, changes related to the type and configuration of the window shading systems were made in both houses. Therefore, assuming that for all of the shading systems tested, the benchmark correlation between the test house and the reference house would remain unchanged, the results should be viewed as depicting the order of magnitude of the relative difference in heating and cooling performance caused by the different settings and types of shading configurations used.
Two types of shading systems were investigated in this study:
• a common indoor manual aluminum venetian blind system with 2.5 cm wide, white-coloured slats; and
• an exterior opaque shading device of the type shown in Figure 2. This static system, even though unsuitable for any real application, replicated an ideal external shading system that excluded all solar gains from entering the building.
The comparability between the two houses with these window shading systems in place was verified during extensive periods of benchmark tests conducted shortly prior and after the window shading experiments. These benchmark data, which includes the interior blind system with slats positioned horizontally, as well as the exterior shading system covering the south-facing windows of both houses, was included in this study for reference.
The houses have windows on all four facades, however, in these experiments only the south facing windows were considered. The east and north-facing windows were fully covered by interior
aluminum venetian blinds maintained in a closed configuration during the entire duration of the tests, while two west-facing, diamond-shaped windows adjoining the stairways to the second floor (one in each house) remained uncovered.
Fig. 1 South-facing façade of the CCHT research center
Fig. 2 Exterior opaque shading device covering the south-facing windows of the CCHT test house
During the experiments, the test house on the left side in Figure 1 had all the four south-facing windows covered with either interior aluminum venetian blinds closed day and night, or the opaque exterior shading device. The reference house on the right side was used to monitor the effect of various interior blind configurations on the heating and cooling energy consumption by comparison with the corresponding loads measured in the test house to its left.
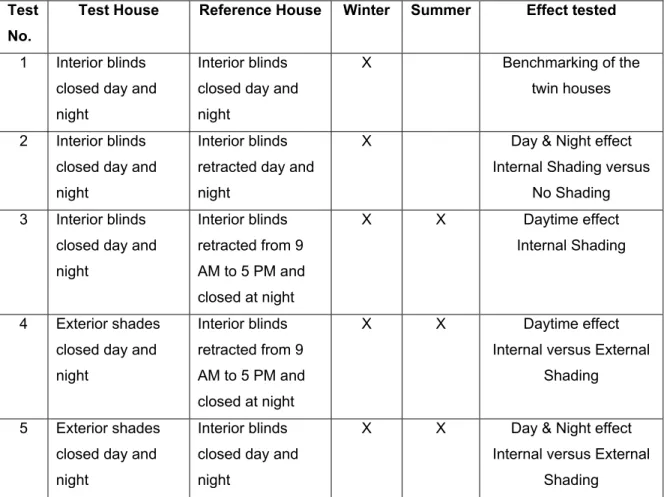
Table 1 presents the blind configurations tested during winter and summer conditions.
Test 1 included only interior venetian blinds set with their slats closed in both houses. This test was conducted only in the winter and provided additional evidence toward the similarity of the two houses with this particular blind configuration.
Test 2 also included venetian blinds in both houses. This test was also run only during the winter and provided an indication of the effect on the heating load of two extreme scenarios: “blinds always fully retracted” versus “blinds always closed” . During this test the blinds remained closed day and night in the test house, while all four south-facing blinds were fully retracted in the reference house.
Tests 3 and 4 addressed the effect of interior blinds being fully retracted between 9 AM to 5 PM in the reference house and closed at night, compared to either interior or exterior shades closed day and night in the test house. In addition to providing data on the effect of having the south-facing windows
uncovered during the time of day when the solar radiation reaches its maximum values, these tests also provided an indication of the difference between the shading effect provided by the external shading system compared to the internal one under similar sky conditions. To verify this effect, Test 5 was later designed to compare the two shading systems under the same weather conditions. During Test 5, the test house had exterior shading day and night, while the reference house had the interior blinds with the slats closed day and night.
Table 1 Configurations tested during winter and summer
Test No.
Test House Reference House Winter Summer Effect tested
1 Interior blinds closed day and night
Interior blinds closed day and night
X Benchmarking of the twin houses
2 Interior blinds closed day and night
Interior blinds retracted day and night
X Day & Night effect Internal Shading versus
No Shading 3 Interior blinds
closed day and night Interior blinds retracted from 9 AM to 5 PM and closed at night X X Daytime effect Internal Shading 4 Exterior shades closed day and night Interior blinds retracted from 9 AM to 5 PM and closed at night X X Daytime effect Internal versus External
Shading
5 Exterior shades closed day and night
Interior blinds closed day and night
X X Day & Night effect Internal versus External
RESULTS
Winter Tests: Effect of Window Shading Systems on the Heating Load
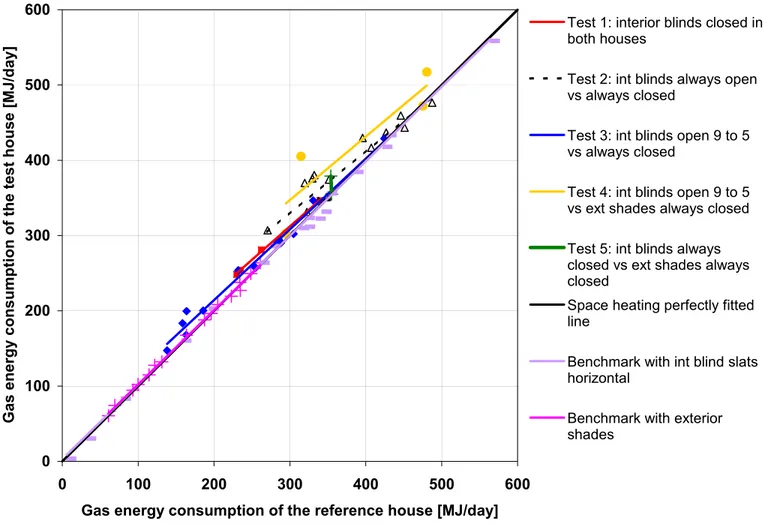
The winter performance of the two houses is reported here based on the measured natural gas consumption for heating. The gas meter readings were stored on a 5-minute basis. Figure 3 shows the daily gas consumption used for heating in the CCHT houses for all the window shading
configurations tested, while Figure 4 shows the gas consumption between 9 AM and 5 PM.
While it is well understood that reducing the analysis interval to less than 24 hours (Figure 4) may have introduced additional uncertainties in the interpretation of the results (due to scatter in performance resulting from the houses’ heating systems not being perfectly synchronized; stored solar effects which could have manifested later into the evening or night; or the relative position of the houses to one another and the ensuing shading effects, etc.), it was considered essential for this study to differentiate between the performance under night-time and daytime conditions, as well for periods with various sky conditions.
Tests were run for various periods of time that covered clear, partly cloudy and overcast sky. The sky condition was continuously recorded during the monitoring period and was characterized by the experimenters as either clear sky (less than 30% cloud cover), partly cloudy sky (between 30% and 70% cloud cover), and overcast sky (over 70% cloud cover).
Houses benchmarking
A benchmark test conducted over 15 days in November 2001, with the interior blind slats positioned horizontally in both houses, showed an average daily offset in energy consumption for heating between the two houses of less than 1%, with the test house using about 165 MJ/day, and the reference house using 164 MJ/day. During daytime, from 9 AM to 5 PM, the average offset was about 2%, with both houses using about 33 MJ for heating.
An additional benchmark test conducted over 11 days in January, 1 day in March, and 5 days in May of 2002, also showed no daily average offset in energy consumption for heating between the two houses (both houses used about 281 MJ/day). From 9 AM to 5 PM, the average offset was less than 1%, with both houses using an average of 82 MJ. This benchmark test was conducted with exterior shades covering the south-facing windows of both houses.
Test 1 conducted over 4 sunny days in December to verify the equivalency between the two houses with interior blinds closed in both houses showed an average difference of 6% in daily gas
consumption for heating (reference house 267 MJ/day compared to test house 283 MJ/day). This offset, even though apparently higher than the ones presented above, is still within the range of scatter present in the two extensive benchmark correlations, being due to the many influences on the thermal conditions and the energy consumption that generally prevent a perfect correlation between the two houses over short intervals of time (in this case only 4 data points). This finding, however, suggests that all the test results that follow, and particularly the ones that originate from data collected over a reduced number of days, should be interpreted with caution and should be seen as an order of magnitude exploration only.
Interior window shading versus no shading: Daytime and night-time combined effect
Test 2 took place over 16 days in December and showed that on sunny days the test house which had the blinds always closed used on average 373 MJ/day, which accounts for about 12% more energy used for heating in this house than in the reference house that had the blinds always fully retracted and used only 333 MJ/day. Even if we consider the average 6% offset between the two houses mentioned above (with closed interior blinds), data shows that over a 24-hour period, there was an average of at least 6% daily savings in energy required for heating in the reference house, which is a direct result of the solar heat gains acquired during daytime through the uncovered windows. From 9 AM to 5 PM under sunny sky, the energy used for heating in the test house was between 1.5 to 2.5 the consumption of the reference house (e.g., over 6 sunny days the test house used a total of 374 MJ, while the reference house used 202 MJ, which accounts for an average difference between the two houses of 85%).
On the remaining 10 days of Test 2 with overcast sky, the difference in daily gas consumption between the two houses was very small (always less than 3%), which is within the range of scatter shown in the benchmark correlation. At first sight, this suggests that under this sky condition having the blinds closed in the test house and retracted in the reference house for 24 hours/day did not have a major impact on the heating balance of the two houses, which could lead to the conclusion that the interior blind system, even with slats closed, did not affect significantly the heat losses through the windows.
assumption that the savings in daily heating energy consumption in the reference house could have been even higher than 6-12% on clear sky days, had the blinds been closed at night and open only during daytime.
Interior window shading: Daytime effect
Data from Test 3, which included a total of 13 days of monitoring, seems to confirm the above assumption. On 2 clear sky days available during Test 3 when the blinds were fully retracted in the reference house only between 9 AM and 5 PM and closed at night, the difference between the daily energy consumption for heating of the two houses increased significantly, being as high as 16-22%. Even taking into consideration a 6% offset between the two houses with interior blinds closed, the savings in heating consumption in the reference house would be somewhere between 10-16%, which is still significant.
These savings were again a direct result of the direct solar gains acquired from 9 AM to 5 PM, when the energy used for heating in the test house was again between 1.5 to 2.5 the consumption of the reference house. On the remaining 11 days of Test 3 with overcast or cloudy sky, the difference in daily gas consumption between the two houses was again small (less than 3%), which shows that from 9 AM to 5 PM, under these sky conditions, the interior blind system with slats closed did not influence significantly the heat losses through the windows. This does not mean, however, that this blind configuration could have not impacted the heating balance of the reference house during the remaining 16 hours of the day (night-time), as discussed above.
Data clearly shows that the solar heat gains acquired through the windows from 9 AM to 5 PM on clear sky days had a significant impact on the heating load during the winter. Results also suggest that some heat losses through the windows may have been avoided in the reference house at night by closing the blinds, which indicates that uncovered windows may potentially generate a night-time heat loss effect that can reduce or even counteract the effect of the daytime solar gains on the daily energy required for heating. However, a beneficial effect caused by closed interior blinds on the heating consumption during 8 daytime hours under overcast sky conditions was not evident.
Tests 4 and 5 both investigated the effect of the opaque exterior shading device in comparison to the interior blind system. As mentioned before, the exterior shading was used as a means to obstruct all solar heat gains from entering the house.
Interior window shading versus exterior shading: Daytime and night-time combined effect
Test 5, which examined the two shading systems in an always closed configuration showed a 6-7% daily offset between the houses under a clear sky, and no difference under overcast sky. However, from 9 AM to 5 PM on a clear sky day, the test house used about 25% more energy for heating than the reference house, indicating that the exterior shading blocked more effectively the direct solar heat gains than the interior blind system.
Interior window shading versus exterior shading: Daytime effect
Test 4 which was similar to Test 3 (the only difference being the exterior shades that replaced the interior blinds always closed in the test house, while the blinds were fully retracted in the reference house between 9 AM to 5 PM and closed at night) confirmed the results of Tests 3 and 5. The difference between the two houses was as high as 29% under a sunny sky (test house 405 MJ/day versus reference house 315 MJ/day), which suggests that during Test 3 some solar heat was gained in the test house with interior blinds with the slats closed, as compared to the opaque external shading system used in Test 4, which blocked all the solar gains. Taking into consideration the 6% offset between the two houses (Test 1 benchmark), the daily difference in heating consumption between the two houses was about 23%. These savings were again a result of the solar heat gains acquired in the reference house between 9 AM and 5 PM, when the energy consumption for heating was about 6 times lower in this house than in the test house.
As shown in Figures 3 and 4, the only noticeable savings in energy used for heating occurred in the reference house only under sunny sky conditions when the indoor blinds were open between 9 AM and 5 PM. On a 24-hour basis, when the blinds were closed at night, these savings accounted for about 10-29% compared to the test house, and were a direct result of the heat accumulated through windows from direct solar gains.
Summer Tests: Effect of Window Shading Systems on the Cooling Load
was about 3% (reference house 32 MJ compared to test house 33 MJ). The benchmark test was conducted with the south-facing interior blind slats positioned horizontally in both houses.
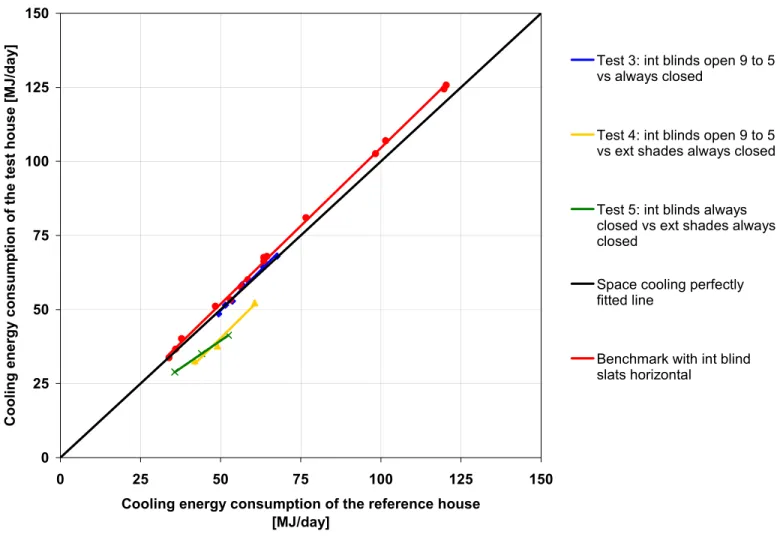
Only Tests 3, 4 and 5 were repeated during the summer. Figure 5 shows for each shading
configuration the daily energy consumption used for cooling over a 24-hour period. Figure 6 show the energy consumption used for cooling between 9 AM and 5 PM. All summer tests were conducted under sunny sky conditions only.
Interior window shading: Daytime effect
Test 3, conducted over 6 days in July, showed that between 9 AM and 5 PM the energy consumption for cooling in the reference house (which had the blinds fully retracted between 9 AM and 5 PM) was on average by about 12% higher than in the test house that had the interior blinds closed day and night (reference house 29 MJ compared to test house 26 MJ). However, during the rest of the time when both houses had the interior blinds closed, the test house used on average about 12% more energy for cooling than the reference house. This seems to have been a direct consequence of the efficiency of the air-conditioning unit of the reference house being slightly higher than the one of the test house (as shown by the benchmark correlation), possibly combined with a shading effect of the test house over the reference house in the later part of the day, and some additional solar gains accumulated only in the test house through the uncovered west-facing diamond-shaped windows. This effect cancelled out the relative savings in cooling energy achieved in the test house during the day by the closed interior blinds, resulting in a very small relative difference between the two houses on a 24-hour basis. The daily average energy consumption for cooling was in both houses about 57 MJ/day.
Interior window shading versus exterior shading: Daytime effect
Test 4 was conducted over 3 sunny days in July. Between 9 AM to 5 PM, the energy consumption for cooling in the reference house that had the blinds fully retracted was on average by 71% higher than in the test house with exterior shades (reference house 26 MJ compared to test house 15 MJ). During the rest of the time, however, when both houses had the windows covered, the test house used on average about 4% more energy for cooling than the reference house, which again was most likely linked to the slightly different efficiency rates of the cooling units of the two houses. Over 24 hours, this resulted in an average daily energy consumption for cooling by about 24% higher in the reference house with interior blinds open from 9 to 5 and closed at night, compared to the test house with external shading in place day and night (reference house 51 MJ/day compared to test house 41 MJ/day).
The external shading seems to have also reduced the offset between the two houses during the 16 hours with covered windows (only 4% during Test 4 - which is within the range of scatter shown by the benchmark correlation - compared to 12% during Test 3), suggesting that during Test 3 the test house may have accumulated some solar daytime effects through the closed interior blinds that manifested later into the evening or night compared to Test 4 with exterior shades that blocked all solar gains.
Interior window shading versus exterior shading: Daytime and night-time combined effect
Test 5, conducted over 3 sunny days in August, also showed that the external shades protected more effectively the interior from solar heat gains than the interior blinds. Again, the energy consumption for cooling of the two houses differed by about 77% between 9 AM and 5 PM (reference house 24 MJ compared to test house 14 MJ), and the test house used about 7% more energy for cooling than the reference house during the rest of the time, which is again within the range of scatter shown in the benchmark correlation. On a 24-hour basis, this translated into an average difference of 26% in electrical energy consumption used for cooling in the two houses (reference house 44 MJ/day compared to test house 35 MJ/day).
Results of both Tests 4 and 5 show that relative to the test house with exterior shading, there was no considerable difference between the performance of the reference house with either interior blinds closed from 9 AM to 5 PM, or open from 9 AM to 5 PM. The interior blinds, even when fully closed, were a lot less effective at excluding the solar gains than the exterior shades, which over 3 days in July and 3 days in August reduced the energy required for cooling in the test house by 42% (e.g., over 6 summer days the test house used 86 MJ, while the reference house used 150 MJ). Over a 24-hour period the relative savings in electrical energy required for cooling were about 20%.
0 100 200 300 400 500 600 0 100 200 300 400 500 600
Gas energy consumption of the reference house [MJ/day]
Gas energy consumption of the test house [MJ/day]
Test 1: interior blinds closed in both houses
Test 2: int blinds always open vs always closed
Test 3: int blinds open 9 to 5 vs always closed
Test 4: int blinds open 9 to 5 vs ext shades always closed
Test 5: int blinds always closed vs ext shades always closed
Space heating perfectly fitted line
Benchmark with int blind slats horizontal
Benchmark with exterior shades
0 25 50 75 100 125 150 175 200
Gas energy consumption of the test house from
9 AM to 5 PM [MJ]
Test 1: interior blinds closed in both houses
Test 2: int blinds always open vs always closed
Test 3: int blinds open 9 to 5 vs always closed
Test 4: int blinds open 9 to 5 vs ext shades always closed
Test 5: int blinds always closed vs ext shades always closed
Space heating perfectly fitted line
Benchmark with int blinds slats horizontal
Benchmark with exterior shades
0 25 50 75 100 125 150 0 25 50 75 100 125 150
Cooling energy consumption of the reference house [MJ/day]
Cooling energy consumption of the test house [MJ/day]
Test 3: int blinds open 9 to 5 vs always closed
Test 4: int blinds open 9 to 5 vs ext shades always closed
Test 5: int blinds always closed vs ext shades always closed
Space cooling perfectly fitted line
Benchmark with int blind slats horizontal
0 5 10 15 20 25 30 35 40 45 50 0 10 20 30 40 50
Cooling energy consumption of the test house between 9 AM
and 5 PM [MJ]
Test 3: int blinds open 9 to 5 vs always closed
Test 4: int blinds open 9 to 5 vs ext shades always closed
Test 5: int blinds always closed vs ext shades always closed
Space cooling perfectly fitted line
Benchmark with int blind slats horizontal
CONCLUSIONS
Two types of shading devices were tested at the CCHT Research Center during winter and summer. The winter experiments indicated that variations in the heating and cooling requirements of the houses occurred and could be linked to the various shading configurations of the south-facing windows tested, as summarized in Table 2.
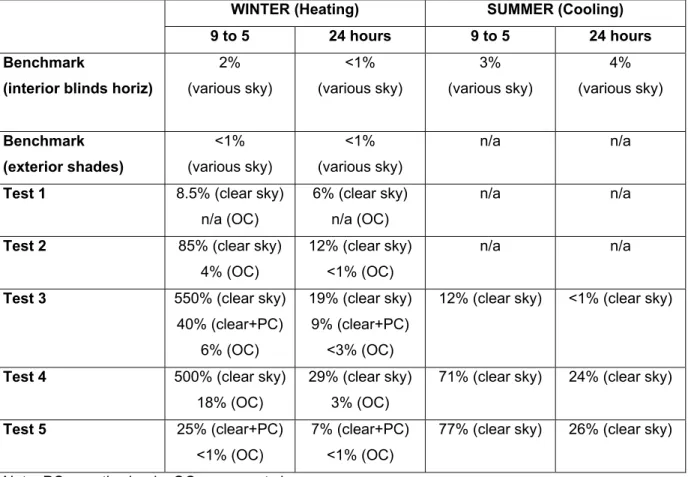
Table 2 Average percentage difference in heating and cooling energy consumption between the CCHT houses during winter and summer
WINTER (Heating) SUMMER (Cooling)
9 to 5 24 hours 9 to 5 24 hours
Benchmark
(interior blinds horiz)
2% (various sky) <1% (various sky) 3% (various sky) 4% (various sky) Benchmark (exterior shades) <1% (various sky) <1% (various sky) n/a n/a
Test 1 8.5% (clear sky) n/a (OC)
6% (clear sky) n/a (OC)
n/a n/a
Test 2 85% (clear sky) 4% (OC)
12% (clear sky) <1% (OC)
n/a n/a
Test 3 550% (clear sky) 40% (clear+PC)
6% (OC)
19% (clear sky) 9% (clear+PC)
<3% (OC)
12% (clear sky) <1% (clear sky)
Test 4 500% (clear sky) 18% (OC)
29% (clear sky) 3% (OC)
71% (clear sky) 24% (clear sky)
Test 5 25% (clear+PC) <1% (OC)
7% (clear+PC) <1% (OC)
77% (clear sky) 26% (clear sky)
Note: PC – partly cloudy; OC – overcast sky
A 15-20% difference in the daily gas consumption for heating under a sunny sky was measured in the house that had the windows uncovered from 9 AM to 5 PM compared to the house that had a similar type of interior blind system closed 24 hours a day. The effect was even more pronounced when the indoor venetian blinds were replaced in one of the houses by an exterior shading device. In this case, the daily gas consumption for heating was by about 25-30% lower in the house that allowed solar heat gains from 9 AM to 5 PM through the south-facing windows compared to the house that had the
external shades covering the window for 24 hours/day. These daily savings in gas consumption for heating were clearly a direct result of the direct solar heat gains acquired from 9 AM to 5 PM, when the energy required for heating was usually twice, and occasionally even 6 times higher, in the house with covered windows than in the house without window shading.
The summer experiments also showed significant effects in cooling requirements between the two houses based on the shading system used. However, this was true only during daytime, when from 9 AM to 5 PM the house that had the windows uncovered used by 10-12% more energy for cooling than the house that had the interior blinds closed. The difference between the two houses raised to about 70-75% when the interior blind system was replaced by the external shading system. This shows very clearly that the exterior shading device provided a much better means to reduce the solar gains than the interior blind system.
However, the apparent advantage gained during the day by covering the windows with either system was counteracted or reduced at night by the performance of the houses during the remaining 16 hours of the day. During this time, the test house that had the windows always covered used on average between 5-10% more energy for cooling than the reference house that had the blinds open during daytime and closed at night, which on a 24-hour basis reduced the actual savings in cooling energy in the test house to 20-25%. It is believed that savings in energy required for cooling in the test house would have been somewhat higher if the average offset of 4% measured between the two houses during the benchmarking test had been reduced.
The data presented in this study showed that the adoption of a combined system that incorporates both internal and external shading capabilities could be beneficial in Canadian residential
applications. A standard internal venetian blind system routinely opened in the winter during daytime and closed during night-time lead to about 15-20% savings in heating requirements compared to permanently closed blinds. Similarly, an external shading device covering the south facing windows day and night during the cooling season reduced the cooling requirements by about 20%. It is noteworthy to mention that the most important cooling load reductions occurred during periods of critical summer afternoon peak demand that has lead to power failures in the past.
RECOMMENDATIONS FOR FUTURE TESTING OF SHADING DEVICES AT CCHT
Based on the results of this study, the following experimental procedure is recommended for future projects involving testing of shading devices at CCHT:
• Testing should be done during both summer and winter, ideally during periods close to the summer and winter solstices to identify maximum effects in heating and cooling energy consumption as a function of the solar gains.
• The testing periods should include various sky conditions, however, it is essential that they include an adequate amount of sunny days.
• The reference case should always be clearly identified. Since in terms of energy savings, shading configurations that are optimum for the summer months are not similarly advantageous for the winter months and vice-versa, a typical comparison baseline for a Canadian residential dwelling would consist of windows covered by an interior venetian blind system day and night in the summer, and open during daytime and closed at night in the winter.
• Night-time versus daytime effects should be explicitly monitored and reported separately. To avoid counteractive effects in performance between daytime and night-time, it is recommended that the windows of the reference house be always kept covered during night-time.
• Outdoor temperature should be taken into account and reported, since it may also affect the relative difference in energy consumption between the two houses.