Publisher’s version / Version de l'éditeur:
Vous avez des questions? Nous pouvons vous aider. Pour communiquer directement avec un auteur, consultez la
première page de la revue dans laquelle son article a été publié afin de trouver ses coordonnées. Si vous n’arrivez pas à les repérer, communiquez avec nous à PublicationsArchive-ArchivesPublications@nrc-cnrc.gc.ca.
Questions? Contact the NRC Publications Archive team at
PublicationsArchive-ArchivesPublications@nrc-cnrc.gc.ca. If you wish to email the authors directly, please see the first page of the publication for their contact information.
https://publications-cnrc.canada.ca/fra/droits
L’accès à ce site Web et l’utilisation de son contenu sont assujettis aux conditions présentées dans le site LISEZ CES CONDITIONS ATTENTIVEMENT AVANT D’UTILISER CE SITE WEB.
Indoor Air 2005, the 10th International Conference on Indoor Air Quality and Climate [Proceedings], 2, pp. 1822-1827, 2005-09-01
READ THESE TERMS AND CONDITIONS CAREFULLY BEFORE USING THIS WEBSITE.
https://nrc-publications.canada.ca/eng/copyright
NRC Publications Archive Record / Notice des Archives des publications du CNRC :
https://nrc-publications.canada.ca/eng/view/object/?id=c1aab74a-8996-48cb-bc94-730dd5fc8d6d https://publications-cnrc.canada.ca/fra/voir/objet/?id=c1aab74a-8996-48cb-bc94-730dd5fc8d6d
NRC Publications Archive
Archives des publications du CNRC
This publication could be one of several versions: author’s original, accepted manuscript or the publisher’s version. / La version de cette publication peut être l’une des suivantes : la version prépublication de l’auteur, la version acceptée du manuscrit ou la version de l’éditeur.
Access and use of this website and the material on it are subject to the Terms and Conditions set forth at Effects of air velocity and temperature on VOC emissions from architectural coatings
http://irc.nrc-cnrc.gc.ca
N a t i o n a l R e s e a r c h C o u n c i l C a n a d a
Effe c t s of a ir ve loc it y a nd
t e m pe rat ure on VOC e m issions
from a rchit e c t ura l c oat ings
N R C C - 4 8 1 4 0
W o n , D . ; S h a w , C . Y .
A version of this document is published in / Une version de ce document se trouve dans:
Indoor Air 2005, The 10th International Conference on Indoor Air Quality and Climate, Beijing, China, Sept. 4-9, 2005, pp. 1-6
EFFECTS OF AIR VELOCITY AND TEMPERATURE ON VOC
EMISSIONS FROM ARCHITECTURAL COATINGS
D Won*, and CY Shaw
Institute for Research in Construction, National Research Council Canada, 1200 Montreal Road, Ottawa, Ontario K1A 0R6, Canada
ABSTRACT
Volatile organic compound (VOC) emissions from building materials are typically tested under standardized conditions (i.e., at ~23 C and 50% RH). While a standardized testing condition is desirable to produce comparable and compatible emission data, it is also necessary to understand the effects of various environmental conditions on material emissions. Experiments were designed to quantify the effects of environmental factors including air velocity and temperature on the VOC emissions from solvent-based paint. To report the effects in a quantitative format, the varied levels of environmental factors were correlated with coefficients of a mass-transfer model accounting for internal diffusion and surface evaporation. It was observed that diffusion coefficient is a function of air temperature, while evaporation coefficient is a function of air velocity.
o
INDEX TERMS
Volatile organic compounds, Diffusion, Evaporation, Indoor air quality, Environmental factors
INTRODUCTION
Environmental factors including surface air movements and temperature can influence VOC emissions from building materials. While there has been a large amount of research on the topic, there are limitations in several ways. The most frequently used approach is to compare concentrations or emission rates obtained from dynamic chamber tests for different environmental conditions. The approach can lead to different conclusions depending on which data are compared since they change over time partly due to depletion of sources. Additionally, the results in most previous research were reported in a qualitative format such that it is difficult to utilize them in indoor air quality simulation.
This suggests that a new systematic approach is necessary to quantify the effects of environmental factors on VOC emissions from building materials. This paper presents the results of quantifying the environmental effects on coefficients of a mass-transfer based emission model.
RESEARCH METHODS
Model Selection: A mass-transfer model, which is a theory-based model as opposed to an empirical model, was selected to predict chamber air concentration with a wet building material specimen. The model accounts for two mass-transfer mechanisms: diffusion inside the material specimen and evaporation at the surface of the specimen. The chamber air concentration can be expressed with diffusion (D) and evaporation (α) coefficient:
*
(
)
(
)
( )
∑
∞ = + + ⎟⎟ ⎠ ⎞ ⎜⎜ ⎝ ⎛ − − = − − 1 2 2 2 2 * cos cos exp 2 1 n n n n n o o l x l t D C C C C β γ γ β β β γ (1)where βs are positive roots of βtanβ =γ and
D lα
γ = , C is the concentration of a chemical in the specimen (mg/m3), Co is the initial concentration of a chemical in the specimen
(mg/m3), C* is the concentration that would be in equilibrium with the vapor pressure in the atmosphere remote from the surface (mg/m3), D is the diffusion coefficient of a chemical in the specimen (m2/s), α is the evaporation coefficient (m/h); and l is the specimen thickness (m), x is the distance upwards from the substrate, and t is the time.
Based on Equation 1, the total amount of a chemical left the chamber system at time t (Mt)
can be expressed as Equation 2 for a large time t.
(
)
t l D M Mt 2 2 1 2 2 1 2 1 2 2 ln 1 ln β γ γ β β γ − ⎥ ⎦ ⎤ ⎢ ⎣ ⎡ + + = ⎟⎟ ⎠ ⎞ ⎜⎜ ⎝ ⎛ − ∞ (2)where β1is the smallest positive root among βs, M∞ is Mt for an infinite t, which is the product
of A, l and Co; and A is the area of the specimen (m2).
Plotting the logarithmic term on the left hand side of Equation 2 versus time can lead to the diffusion coefficient. The evaporation coefficient can be obtained using the first data set after the specimen is introduced into the chamber. More detailed information on the model and the methodology to calculate model coefficients can be found in Won and Shaw (2003).
Experimental Set-up: Emission tests were conducted with a solvent-based paint sample contained in a Petri dish in a 400 L chamber with an air change rate of 0.5 per hour and a RH level of 50%. The paint was purchased in a local retail store and was spiked with six aliphatic hydrocarbons (heptane, octane, nonane, decane, undecane, and dodecane) and one aromatic compound (toluene) to have more diverse compounds. The density of the paint mixture was estimated to be 1.266 g/L after the addition of chemicals. One test lasted 72 hours during which the exhaust from the chamber was regularly collected on sorbent tubes, which were thermally desorbed and analyzed with GC/MS. The varied environmental conditions include air velocity (v) and air temperature (T). More detailed information on the chamber test can be found in Won and Shaw (2003) and Won et al. (2004)
RESULTS
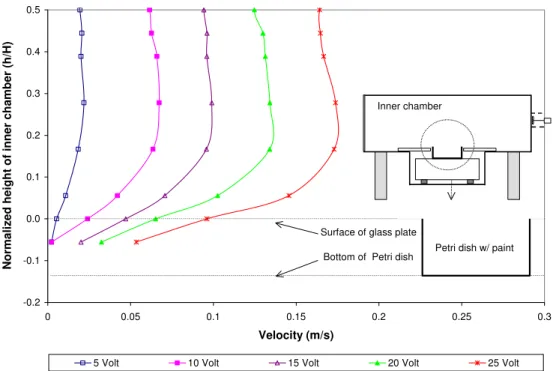
Effects of Air Velocity: The air velocity over a paint sample was varied by changing the voltage delivered to the DC motor that controls the axial fan in the chamber (Won et al., 2004). The varied DC motor voltages are 5, 10, 15, 20, and 25 volts. The air velocity was measured with a flow analyzer equipped with a hot-wire probe. Figure 1 summarizes the vertical air velocity profiles from the surface (h/H = 0) of a specimen to the middle (h/H = 0.5) of the chamber. The velocity levels inside the Petri dish were below or close to 0.05 m/s, which is the minimum velocity the system can measure. To minimize the uncertainties in the velocity levels, the velocity levels at h/H = 0.5 were used as the representative for further data analyses.
-0.2 -0.1 0.0 0.1 0.2 0.3 0.4 0.5 0 0.05 0.1 0.15 0.2 0.25 0.3 Velocity (m/s)
Normalized height of inner chamber (h/H)
5 Volt 10 Volt 15 Volt 20 Volt 25 Volt
Inner chamber
Petri dish
Surface of glass plate
Bottom of Petri dish Petri dish w/ paint
Figure 1. Vertical air velocity profile in the inner chamber
Figure 2 presents example concentration profiles of 1,4-dimethylbenzene as a function of air velocity at the mid-height of the inner chamber. Similar profiles were also obtained for other chemicals. In general, it appears that there is a positive relationship between air velocity and VOC emissions. The concentration data were used to determine D and α .
0 0.5 1 1.5 2 2.5 3 3.5 0 2 4 6 8 Time (h) A ir concent rat ion ( m g/ m 3 ) 10 0.16 m/s 0.12 m/s 0.09 m/s 0.06 m/s 0.02 m/s
Figure 2. Example concentration profiles as a function of air velocity at h/H=0.5
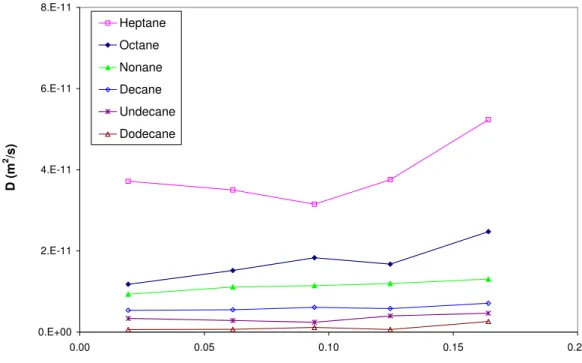
Figures 3 and 4 present α and D as a function of air velocity (v) at the mid-height of the chamber for alkanes. It can be seen that D is not a strong function of v. The increase of α is negligible from 0.02 to 0.09 m/s of air velocity and starts to become significant after 0.09 m/s. While it is not shown in this paper, a similar effect was shown for alkyl benzenes including
toluene, ethyl benzene, 1,2-dimethylbenzene, 1,2,4-trimethylbenzene, and 1,2,4,5-tetramethylbenzene. 0.E+00 2.E-11 4.E-11 6.E-11 8.E-11 0.00 0.05 0.10 0.15 0.20
Velocity at the mid-height (m/s)
D ( m 2 /s ) Heptane Octane Nonane Decane Undecane Dodecane
Figure 3. D as a function of v at the mid-height for alkanes
0.0E+00 5.0E-03 1.0E-02 1.5E-02 2.0E-02 0.00 0.05 0.10 0.15 0.20
Velocity at the mid-height (m/s)
α (m/h) Heptane Octane Nonane Decane Undecane Dodecane a3 = 2.72E-03, a4 = 5.46E-06, a5 = 40.17, R2 = 0.9982 a3 = 9.37E-06, a4 = 1.97E-08, a5 = 50.46, R2 = 0.9925 a3 = 5.49E-05, a4 = 1.12E-07, a5 = 43.20, R2 = 0.9997 a3 = 2.02E-04, a4 = 2.55E-09, a5 = 72.72, R 2 = 0.9943 a3 = 4.92E-04, a4 = 7.57E-07, a5 = 43.05, R2 = 0.9892 a3 = 1.23E-03, a4 = 6.09E-07, a5 = 49.78, R2 = 0.9888
Figure 4. D as a function of v at the mid-height for alkanes
To quantify the effects of air velocity on emissions, a correlation equation was obtained between v and α. In literature, it was shown that there is a power-law relationship (Sparks et al., 1986) or a linear relationship (Topp et al., 2001; Won et al., 2004) between air velocity
and evaporation (mass-transfer) coefficient. Neither the power-law model nor the linear model explained the relationship between α and v for the experiments in this research. Equation 3 was suggested for the correlation between v and α.
) ( 3 2 1 a EXP a v a + = α (3) where α is evaporation coefficient (m/h), v is air velocity at the mid-height of the inner
chamber (m/s), and a1, a2 and a3 are correlation constants, which are reported in Figure 4 for
alkanes.
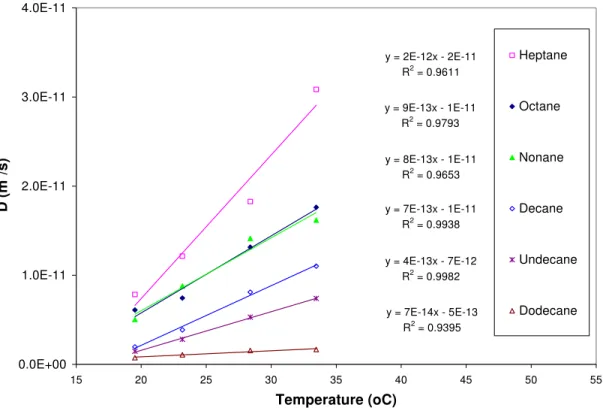
Effects of Air Temperature: Emission tests were conducted with four levels of air temperature (19, 24, 28, and 34 oC). The resulting α and D are shown in Figures 4 and 5 for alkanes. It appears that only D is a strong function T. A similar observation was made for alkyl benzenes.
The dependence of diffusion coefficient in air (Da) was reported to be proportional to air
temperature raised to the power of 1.5 and 2 (Lyman et al. 1982). In other cases, an Arrehenius-type equation, in which the natural logarithm of the diffusion coefficient is proportional to –1/T, was used to express the dependence of D on T (Yang et al., 2001). In this research, it was shown that a power-law equation is more suitable for more volatile compounds such as heptane, octane and nonane, while a linear equation is better for less volatile compounds such as decane and undecane. In overall, a linear model (Equation 4) provided slightly better R2 values.
T b b
D= 1+ 2 (4)
where D is diffusion coefficient (m2/s), T is temperature (oC), and b1 and b2 are correlation
constants, which are reported in Figure 6 for alkanes.
0.0E+00 1.0E-03 2.0E-03 3.0E-03 4.0E-03 15 20 25 30 35 Temperature (oC) α (m/h ) Heptane Octane Nonane Decane Undecane Dodecane
y = 2E-12x - 2E-11 R2 = 0.9611 y = 9E-13x - 1E-11 R2 = 0.9793 y = 8E-13x - 1E-11 R2 = 0.9653 y = 7E-13x - 1E-11 R2 = 0.9938 y = 4E-13x - 7E-12 R2 = 0.9982 y = 7E-14x - 5E-13 R2 = 0.9395 0.0E+00 1.0E-11 2.0E-11 3.0E-11 4.0E-11 15 20 25 30 35 40 45 50 55 Temperature (oC) D (m 2 /s) Heptane Octane Nonane Decane Undecane Dodecane
Figure 6. D as a function of temperature (T) for alkyl benzenes
CONCLUSION AND IMPLICATIONS
It was shown that emissions of alkanes from a solvent-based paint were affected by air velocity (v) and temperature (T). The environmental effects were quantified through a correlation equation obtained for α as a function of v and that for D as a function of T for each chemical. The correlation equation can be used in predicting air concentrations of VOCs from architectural coating indoors for various levels of air velocity and temperature.
ACKNOWLEDGEMENTS
The authors would like to thank Dr. Wenping Yang for the help with the GC/MS operation and Mr. Gang Nong for the assistance with the operation of the 400 L chamber.
REFERENCES
Lyman WJ, Reehl WF, and Rosenblatt DH. 1982. Handbook of chemical property estimation
methods: Environmental behavior of organic compounds, McGraw-Hill Book Company.
Sparks LE, Tichenor BA, Chang J and Guo Z. 1996. “Gas-phase mass-transfer model for predicting volatile organic compound (VOC) emission rates from indoor pollutant sources,” Indoor Air. 6: 31-40.
Topp C, Nielsen PV, and Heiselberg P. 2001. “Influence of local airflow on the pollutant emission from indoor building surfaces,” Indoor Air. 11: 162-170.
Won D. and Shaw CY. 2003. “Determining coefficients for mass-transfer models for volatile organic compound emissions from architectural coatings,” Proceedings of the 7th
International Conference of Healthy Buildings, Singapore, Vol 1, pp 198-203.
Won D, Nong G, and Shaw CY. 2004. “Quantification of effects of air velocity on VOC emissions from building materials,” Proceedings of CIB World Building Congress 2004, Toronto, Vol 1, pp 253-258.
Yang X, Chen Q, Zeng J, Zhang JS, Shaw CY. 2001. “A mass transfer model for simulating volatile organic compound emissions from ‘wet’ coating materials applied to absorptive substrates,” International Journal of Heat and Mass Transfer, 44, 1803-1815.