Publisher’s version / Version de l'éditeur:
Pipelines 2012, pp. 288-297, 2012-08-22
READ THESE TERMS AND CONDITIONS CAREFULLY BEFORE USING THIS WEBSITE. https://nrc-publications.canada.ca/eng/copyright
Vous avez des questions? Nous pouvons vous aider. Pour communiquer directement avec un auteur, consultez la première page de la revue dans laquelle son article a été publié afin de trouver ses coordonnées. Si vous n’arrivez pas à les repérer, communiquez avec nous à PublicationsArchive-ArchivesPublications@nrc-cnrc.gc.ca.
Questions? Contact the NRC Publications Archive team at
PublicationsArchive-ArchivesPublications@nrc-cnrc.gc.ca. If you wish to email the authors directly, please see the first page of the publication for their contact information.
NRC Publications Archive
Archives des publications du CNRC
This publication could be one of several versions: author’s original, accepted manuscript or the publisher’s version. / La version de cette publication peut être l’une des suivantes : la version prépublication de l’auteur, la version acceptée du manuscrit ou la version de l’éditeur.
For the publisher’s version, please access the DOI link below./ Pour consulter la version de l’éditeur, utilisez le lien DOI ci-dessous.
https://doi.org/10.1061/9780784412480.026
Access and use of this website and the material on it are subject to the Terms and Conditions set forth at
Condition evaluation of asbestos cement water mains
Chowdhury, Rudaba; Hu, Yafei; Wang, Dunling
https://publications-cnrc.canada.ca/fra/droits
L’accès à ce site Web et l’utilisation de son contenu sont assujettis aux conditions présentées dans le site LISEZ CES CONDITIONS ATTENTIVEMENT AVANT D’UTILISER CE SITE WEB.
NRC Publications Record / Notice d'Archives des publications de CNRC: https://nrc-publications.canada.ca/eng/view/object/?id=c1f24ea1-3593-4796-93e2-3745fa48dfbf https://publications-cnrc.canada.ca/fra/voir/objet/?id=c1f24ea1-3593-4796-93e2-3745fa48dfbf
1
Condition Evaluation of Asbestos Cement Water Mains
Rudaba Chowdhury*, Yafei Hu, and Dunling Wang
National Research Council Centre for Sustainable Infrastructure Research 3737 Wascana Parkway, Regina, SK Canada S4S 0A2
Abstract: This paper focuses on the condition evaluation of asbestos cement (AC) pipe samples from
three utilities located in different geographic regions and climatic zones in the USA and Canada. Various means of examination or testing were used to evaluate the condition of the samples. These included visual inspection, hardness testing, phenolphthalein testing, crush testing, and scanning electron microscopy with energy dispersive spectroscopy (SEM/EDS). Climate and soil information was also collected for the areas where the three utilities are located to assess the external environments facing the AC pipes. The condition evaluation results were correlated with the external soil characteristics and internal water quality data, collected through a survey, to identify factors contributing to the deterioration of the AC pipes belonging to these utilities. The paper also discusses the variation in the deterioration of the AC water mains from the three utilities.
1. Introduction
Asbestos cement (AC) water mains still constitute significant portions of the water distribution systems of many utilities in the United States and Canada. Like pipes made of other materials, AC pipes deteriorate as a result of chemical and biological interactions with their environments (Wang et al., 2011). These deterioration processes include:
· Lime leaching: The free lime formed during hydration of the cement matrix maintains the strength of AC pipe, but free lime can be leached from the cement matrix by water in contact with pipe surfaces. Soft water with very low ion content (low carbonate and bicarbonate content) is aggressive to AC pipe and results in the leaching of free lime from the cement matrix. The free lime, due to its alkaline nature, can also react with acids in conveyed water and groundwater in the surrounding soils.
Lime leaching from AC pipes can result in a loss of bonding agents and possibly hydrated products, which may release AC fibers and other chemicals, adversely affecting the quality of the conveyed drinking water. Leaching may also reduce pipe strength, and therefore increase the propensity for the pipes to fail.
· Sulphate attack: Sulphate in conveyed water and in soil pore water (groundwater) can also react with free lime and hydrated calcium aluminates to form calcium sulphate (gypsum) and calcium
*
2
sulphoaluminate (ettringite) (Matti and Al-Adeebt, 1985). According to Matti and Al-Adeebt (1985), gypsum and ettringite formed by these reactions occupy considerably more volume (123 to 224%) than the original solids they replace. The formation of these compounds causes swelling, which can ultimately lead to the cracking and destruction of the cementitious portion of AC pipe.
· Biodeterioration: It has not been recognized until recently that the growth of microorganisms on the surface of AC pipes can contribute to AC pipe deterioration (Wang and Cullimore, 2010; Razban et al., 2010). The isolation of a series of bacteria, including acid-producing bacteria (APB), from the patina layer of AC pipes has demonstrated that the biodeterioration of AC water pipes does occur. By generating organic acids, APB bacteria may facilitate the leaching of free lime and the dissolution of calcium-bearing hydrated cement paste, creating porosity and reducing the strength of pipes. In summary, AC pipes are susceptible to attack by acidic, soft or sulphate-bearing conveyed water and acidic surrounding soils or groundwater, as well to bio-film formation that might weaken the pipes. As a result of the attack, AC pipes deteriorate. The deterioration compromises not only water quality, but also pipe strength. In severe cases, AC pipes may deteriorate to the extent that they require immediate rehabilitation or replacement.
It should be a priority for utilities to efficiently manage existing AC water pipe networks. Sound decision-making requires a thorough understanding of the current condition of the AC pipes. To develop a management strategy for AC pipes, a collaborative study, supported by the National Research Council Canada (NRC) and the Water Research Foundation (WaterRF), was conducted to understand the current condition and the long term performance of AC pipes (Hu et al., 2011). AC pipe samples were collected between 2007 and 2009 from utilities in the USA and Canada. These AC samples were obtained during replacement and rehabilitation work and had different diameters and ages.
This paper focuses on the condition evaluation of AC pipe samples from three utilities located in different geographic and climatic regions. The three regions include A – subarctic/semi arid, B – Mediterranean, and C –marine west coast. All three utilities had predominantly expansive clay soils. The results were correlated with the available soil environment and groundwater (external) conditions and conveyed (internal) water quality data collected to identify factors that contributed to the deterioration of the AC pipes. The variation in the deterioration of AC water mains from the three different utilities is also presented.
2. AC pipe sample collection
A total of 155 AC pipe samples and related data were provided by the three utilities participating in this study, with 35 from utility A, 13 from utility B, and the rest from utility C. Most samples were collected during water main break repair work and some were obtained from water main replacement projects. The samples had a length of about 400 mm, but some were smaller pieces. Detailed information,
3
including diameter, location, and installation year, was obtained from the three utilities for each sample. Soil samples were also collected adjacent to the pipe samples in most cases. Each pipe was labeled and visually inspected immediately after receipt. After that, the samples were cut and prepared for physical and chemical testing to quantify the extent of degradation that had occurred and the residual strength.
There are a number of techniques available for assessing the condition of AC water mains (Hu et al., 2011). Suitable techniques include visual inspection, physical tests (hardness, crush, pressure, and bending tests), chemical tests (phenolphthalein tests), and elemental analysis using scanning electron microscopy with energy dispersive spectroscopy (SEM/EDS).
Wherever possible, a 300 mm long sub-sample was first cut for crush testing (Figure 1a) and the remaining portion of the pipe (Figure 1b) was used for chemical tests
and
elemental analysis. The sub-samples for crush tests were removed from the barrel portion of the pipe, avoiding tapered joint ends and any obvious damage. The detailed test procedures are summarized by Hu et al. (2011).
(a) 300 mm sub-sample for crush test (b) 100 mm long section for chemical analysis
Figure 1: Cut AC pipe samples
3. Results of pipe examination and testing
3.1 Visual examination
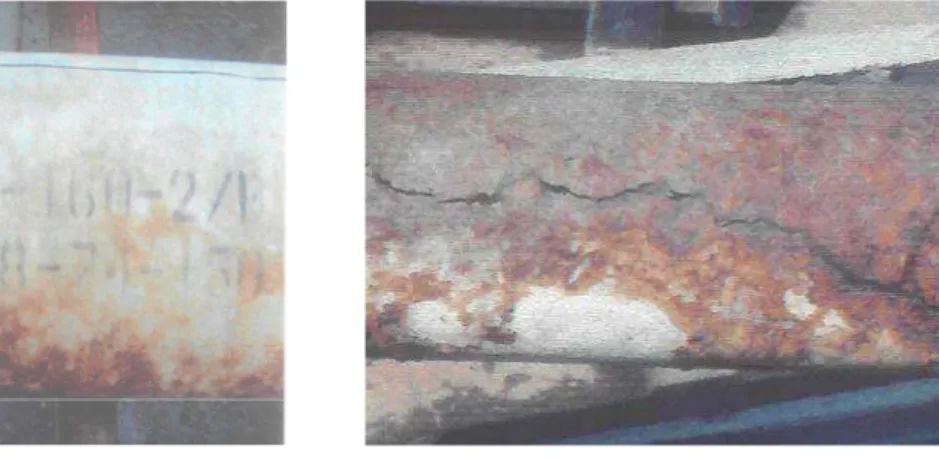
The pipe samples from utilities A and B were relatively intact and did not show significant exterior deterioration except for some pipes that had rust and/or stain deposits (Figure 2a). Some of the samples from utility C showed severe distress, for instance, the removal of the smooth cementitious layer and cracks on the outside surfaces (Figure 2b).
3.2 Physical tests
4
Figure 3b shows the hardness test results for inner and middle sections (as shown in Figure 3a) of AC pipe samples as measured using the modified Shore D durometer. The hardness in the middle section was higher than that on the inner surface. This was expected as almost all pipes had some essentially undegraded areas in the middle section.
The hardness values measured on the outer surface (not shown) were generally higher than those in the middle section. This may be related to the waffle pattern on the outside surface of AC pipes, which made it difficult for the durometer to be positioned in close contact with the outside surface.
(a) Slightly deteriorated pipe (b) Severely deteriorated pipe
Figure 2: Visual examination of degraded pipes
(a) Test points (b) Hardness test results
Figure 3: Barcol hardness tests of AC pipe samples
0 10 20 30 40
Utility A Utility B Utility A Utility B
Mod ifie d Sh ore D h ard ne s s Inner surface Middle section
5
Ring crush test
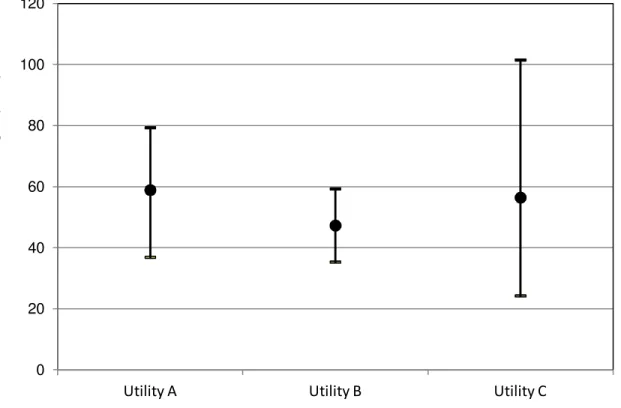
The load value at the point of failure was recorded for each crush test. The corresponding transverse failure strength was calculated based on the value of the failure load and the measured dimensions of the sample. Figure 4 plots the crush strength data for samples from the three utilities. In Figure 4 and following figures, a dot in a figure represents the average value, while two bars represent the maximum and minimum values measured.
Figure 4: Transverse crush strength of AC samples
Transverse strength is a material property and a change in transverse strength reflects the change in the structure of AC pipe material due to deterioration. Figure 4 shows that utility C had the most variation in pipe strength, while utility B had the least variation, with utility A in between. The transverse strength for new Class 150 AC pipes is about 45 MPa (AWWA, 2003). This figure indicates that the deterioration resulted in about 18% of pipes samples with transverse strength below specifications.
3.3 Chemical tests
Deteriorated and intact cement matrices have different degrees of alkalinity and percentages of elemental composition. The chemical tests, specifically phenolphthalein tests, used phenolphthalein
0 20 40 60 80 100 120
Utility A Utility B Utility C
Tr ansv e rse st re ngt h ( M Pa)
6
solution to differentiate between the deteriorated and intact portions of the cement matrix. The phenolphthalein test results from the three utilities are used below to illustrate the degradation of the pipe samples.
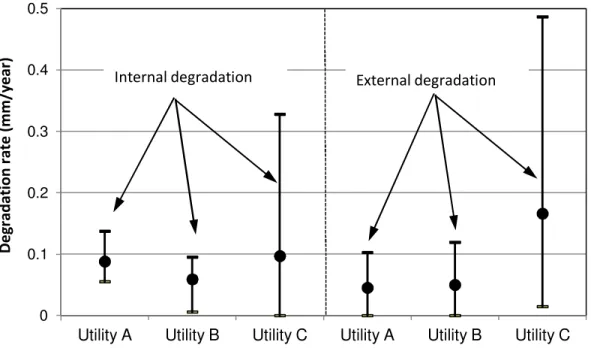
Figure 5 shows the measured internal and external degradation rates from the phenolphthalein tests. Degradation rates were calculated by dividing the measured degradation depth of a pipe sample by the service years. Both the internal and external degradation rates varied significantly from sample to sample and from utlity to utility. The samples from utility A degraded more rapidly on the inside than the outside, while the opposite occurred for utility C. Utility B had similar degradation rates on both internal and external surfaces. In general, variation in degradation rates was much greater on the outside than on the inside. This may be because the soils surrounding AC pipes may vary significantly for a given utility, but all AC pipes in a utility likely experience the same (possibly time varying) conveyed water quality.
Figure 5: Internal and external degradation rates of pipe samples
Elemental analysis, and the concentration of specific elements, are used to indicate leaching and decomposition. The degradation depths estimated from elemental analysis appeared to be in a similar range as those from the phenolphthalein tests and, thus, are not shown here. Considering the high cost of elemental analysis, phenolphthalein tests are more likely to be used in an ongoing condition assessment program by a utility.
0 0.1 0.2 0.3 0.4 0.5
Utility A Utility B Utility C Utility A Utility B Utility C
D e gr adat ion r at e ( m m /ye ar )
7
4. Correlation between test results and pipe working environments
As discussed earlier, the condition of AC pipes can be affected by water quality inside the pipes and by soils surrounding the outside surfaces of the pipes. The external environment is isolated from the inside of a pipe and therefore is unlikely to affect the internal degradation of a pipe, and vice versa. In this section, the observed degradation of AC pipes from the three utilities is correlated with the working environment of the pipes in order to identify the factors that contribute to the degradation of AC pipes.
4.1 External deterioration versus soil environment
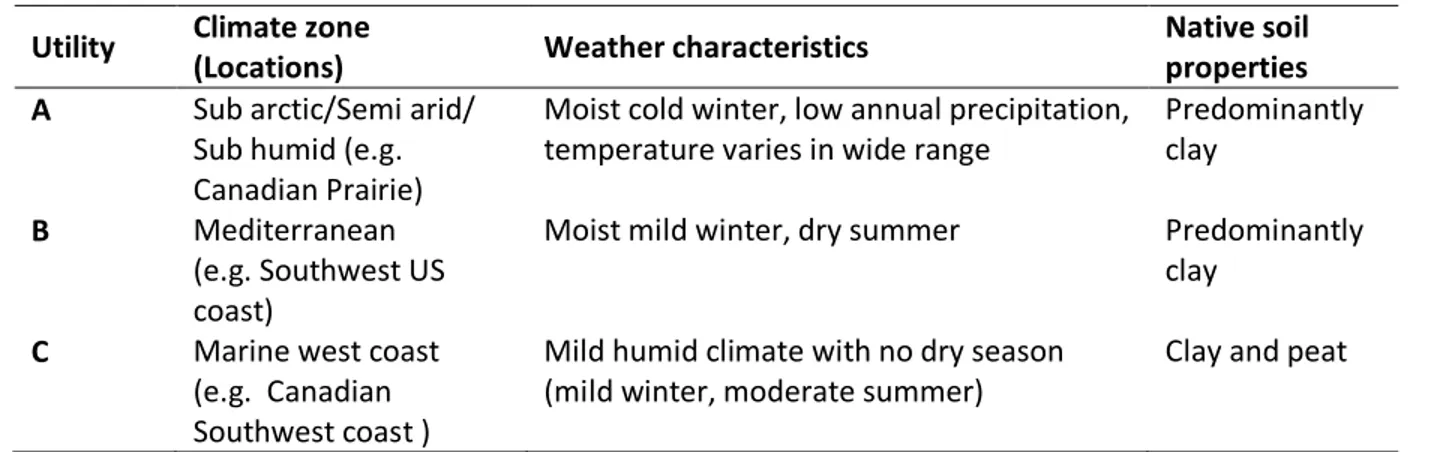
Table 1 summarizes the climate conditions where the utilities are located and the soil characteristics present where the pipe samples were obtained. The climate zones and weather conditions mostly influence soil moisture regimes and external pipe working environments. It is also very important to consider the properties of the soils in which AC pipes are installed, both the native soils and the pipe bedding and backfill materials.
Table 1: Climate zones and native soil properties for utilities A, B, and C Utility Climate zone
(Locations) Weather characteristics
Native soil properties
A Sub arctic/Semi arid/
Sub humid (e.g. Canadian Prairie)
Moist cold winter, low annual precipitation, temperature varies in wide range
Predominantly clay
B Mediterranean
(e.g. Southwest US coast)
Moist mild winter, dry summer Predominantly
clay
C Marine west coast
(e.g. Canadian Southwest coast )
Mild humid climate with no dry season (mild winter, moderate summer)
Clay and peat
The dry summer and low annual precipitation experienced by utilities A and B lead to arid soil conditions and low water tables. As lime leaching and sulphate attack all require an environment with soil pore water present for ions to move through the soil, an arid environment with low soil moisture content will minimize leaching and sulphate attack. When the leached products cannot be dispersed into the surrounding soils, they will become highly concentrated and slow down further leaching. That may explain the relatively low degradation rate of AC pipes for utilities A and B (Figure 5). On the contrary, utility C is located in a low-lying alluvial area near the coast and has a high water table, conditions that are conducive to the degradation of AC pipes buried in the soil. Also, the alluvial deposition can produce a soil environment with high sulphate content, which may contribute to the high degradation rate of the AC pipes operated by utility C (Figure 5).
8 4.2 Internal deterioration versus water quality
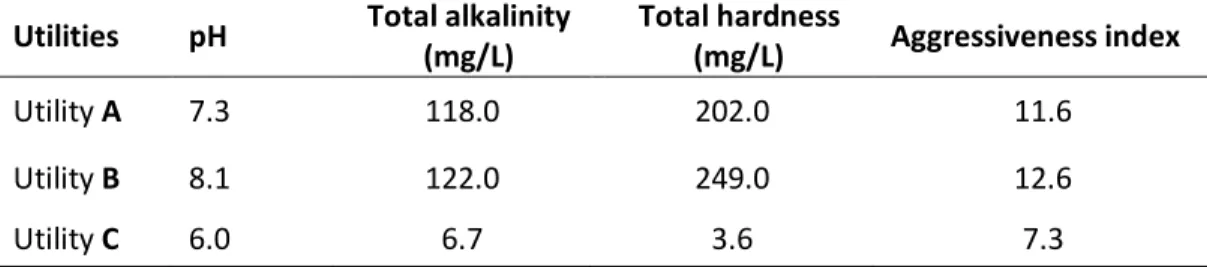
The water quality parameters for the three utilities were collected as part of a comprehensive survey of utilities in North America with AC pipes (Hu et al., 2011). According to AWWA (2003), pH, total hardness, total alkalinity, and sulphate in conveyed water are factors that can contribute to the deterioration of AC pipes. As sulphate content in treated drinking water rarely reaches the level in the AWWA standard, only three water quality parameters from the utilities are listed in Table 2. The aggressiveness index (AI) for the three utilities was calculated based on the three water quality parameters and is also listed in the table.
According to AWWA (2003), water is considered to be very aggressive when AI < 10; water is considered to be moderately aggressive for 10 < AI < 12; and water is considered to be non-aggressive when AI > 12. Therefore, the conveyed water in utilities A, B, and C is moderately aggressive, non-aggressive, and very aggressive to AC pipes, respectively.
Table 2: The water quality parameters for utilities A, B, and C Utilities pH Total alkalinity
(mg/L) Total hardness (mg/L) Aggressiveness index Utility A 7.3 118.0 202.0 11.6 Utility B 8.1 122.0 249.0 12.6 Utility C 6.0 6.7 3.6 7.3
Water aggressiveness versus degradation
The effect of the different aggressiveness of the conveyed water on the deterioration of AC pipes in the three utilities can be observed in Figure 5. Utility C, with very aggressive water, had the highest internal degradation rate and the highest average internal degradation rate. Utility B, which had the least aggressive water, had the lowest average internal degradation rate. Utility A experienced an average internal degradation rate in between, which corresponded to conveyed water with an aggressiveness index in between those of utilities B and C.
Water aggressiveness versus transverse strength
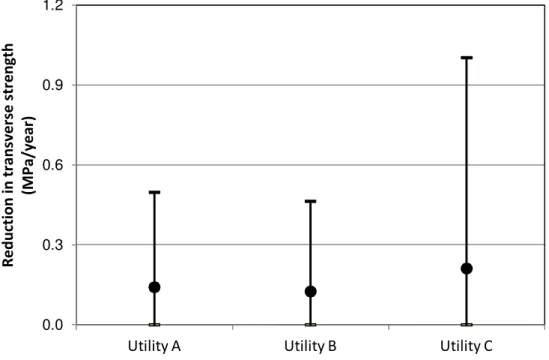
The effect of the different aggressiveness of the conveyed water on the transverse strength of AC pipes cannot be observed in Figure 4 because the pipe samples have different ages. Figure 6 re-plots the transverse strength with sample age included. Again, the utility with the most aggressive water (utility C) had the greatest decrease rate in transverse strength and the utility with the least aggressive water (utility B) had the smallest reduction in transverse strength (MPa/year).
Water aggressiveness versus internal surface hardness
The reduction in modified Shore D hardness was also analyzed with sample age included. The effect of water quality on the average rate of reduction in internal surface hardness cannot be observed, but the
9
utility with moderately aggressive water (utility A) had a much greater decrease rate in hardness. Since internal surface hardness tests were not performed on samples from utility C, no further comparison could be made.
4.3 Limitations & data requirements
It should be noted that data available for this analysis are limited and the analysis is qualitative. More data should be collected to develop a quantitative relationship to provide tools for better management of AC pipe assets. Also, other factors that may have affected the degradation, such as biodeterioration, the differences between manufacturers of AC pipes, the cement used, the extent of the damage incurred during installation, as well as changes in treatment/water source during the life of a pipe, were not considered in this analysis.
Figure 6: Reduction in transverse strength of AC samples
5. Conclusions
Visual inspection, hardness and crush tests, and phenolphthalein tests were carried out on pipe samples collected from three utilities to assess the current condition of their AC pipes. The test results were then correlated with the working environment of the pipes, including several water quality parameters of the conveyed water and the characteristics of soils surrounding the pipes.
0.0 0.3 0.6 0.9 1.2
Utility A Utility B Utility C
Re duct ion in t ransv e rse st re ngt h (M Pa/ye ar )
10
Test results indicate that the internal and external pipe degradation values varied significantly, depending on the operating condition, and the soil environment, as influenced by both soil and climatic conditions. It is apparent that AC pipes are vulnerable where soils have high water tables with high sulphate contents, and when the carried water is aggressive. Analysis of the results shows there was a correlation between pipe degradation and the working environment, with more deteriorated pipes found in more aggressive soil and water environments.
6. Acknowledgement
The authors wish to acknowledge financial support from the National Research Council of Canada and the Water Research Foundation (WaterRF). We also thank Dr. Jian Zhang, the project manager of the WaterRF project, and members of the project advisory committee, Toni Lyons, Steve MacKellar, Showri Nandagiri, and Julie Spacht for their suggestions. We greatly appreciate the contributions of the three utilities that submitted AC pipe information and pipe samples.
7. References
1. AWWA (American Water Works Association). 2003. The selection of asbestos-cement pressure pipe, 4 in. through 16 in. (100 mm through 400 mm), for water distribution systems. AWWA C401-03, Denver, CO.
2. Hu, Y., Wang, D.W. and Chowdhury, R. 2011. Long term performance of asbestos cement pipe (WRF Project #4093) – Draft report. Water Research Foundation, Denver, CO.
3. Matti, M.A. and Al-Adeebt, A. 1985. Sulfate attack on asbestos pipes. The International Journal of Cement Composites and Lightweight Concrete, 7:169-176.
4. Razban, B., Chen, W., Wang, D., and Cullimore, R. 2010. Preliminary assessment on bacterial deterioration of asbestos reinforced concrete pipes for water distribution. Accepted for publication in NACE 2010, San Antonio, TX, March 14, pp. 1-13.
5. Wang, D. and Cullimore, D.R. 2010. Bacterial challenges to asbestos cement water distribution pipelines. Journal of Environmental Sciences, 22(8): 1203-1208.
6. Wang, D., Hu, Y., and Chowdhury, R. 2011. Examination of asbestos cement pipe deterioration with scanning electron microscopy. ASCE Pipelines 2011 Conference, Seattle, WA, July 23-27.