BASIC SCIENCE
Caspase-3-independent photoreceptor degeneration
by N-methyl-N-nitrosourea (MNU) induces morphological
and functional changes in the mouse retina
Rahel Zulliger&Stéphanie Lecaudé&
Sylvie Eigeldinger-Berthou&
Ute E. K. Wolf-Schnurrbusch&Volker Enzmann
Received: 27 June 2010 / Revised: 16 November 2010 / Accepted: 16 November 2010 / Published online: 15 January 2011 # Springer-Verlag 2011
Abstract
Background Retinal degeneration is followed by significant changes in the structure and function of photoreceptors in humans and several genetic animal models. However, it is not clear whether similar changes occur when the degen-eration is induced pharmacologically. Therefore, our aim was to investigate the influence of retinotoxic N-methyl-N-nitrosourea (MNU) on the function, morphology and underlying molecular pathways of programmed cell death. Methods C57/BL6 mice were injected with different doses of MNU, and function was determined by analysing optokinetic reflex measurements and cued water maze results at several time points post-injection. Morphometric measurements were also taken from H&E-stained paraffin eye sections. TUNEL-positive cells and caspase-3 and -6 were detected by immunohistochemistry. To assess the molecular changes leading to cell death, qRT-PCR from neurosensory retina mRNA was performed.
Results The application of MNU led to an instant decrease in function and a delayed decrease in the thickness of the retinal outer nuclear layer. These responses were observed
in the absence of any structural changes in the retinal pigment epithelium. The degeneration of the photoreceptor cell layer was highest with 60 mg/kg MNU. The assessment of TUNEL-positive cells visualised cell death after treat-ment, but no detectable caspase-3 activity was observed concomitant with these changes. qRT-PCR revealed the possible involvement of the inflammatory mediator caspase-1 and endoplasmic reticulum stress-mediated apoptosis by caspase-12.
Conclusion MNU leads to the dose-dependent degeneration of photoreceptor cells in mice by caspase-3-independent pathways and is, therefore, a suitable model to study retinal degeneration in an animal model.
Keywords Apoptosis . Caspases . N-methyl-N-nitrosourea . Morphometry . Mouse . Programmed cell death . Retinal degeneration . Visual function
Introduction
The term retinitis pigmentosa pertains to several hereditary ocular diseases affecting photoreceptor cells, which ultimately lead to severe visual impairment. So far, over 100 different genes leading to retinal degen-eration have been identified, providing a molecular foundation for the significant variability seen in clinical presentation and pathological progression [1]. In recent years, many genetic mouse models for retinal degenera-tion have been found or created artificially, all with a
R. Zulliger
:
S. Lecaudé:
U. E. K. Wolf-Schnurrbusch:
V. Enzmann (*)
Department of Ophthalmology, Inselspital, University of Bern, Freiburgstrasse 14,
3010 Bern, Switzerland e-mail: volker.enzmann@insel.ch S. Eigeldinger-Berthou
Department of Clinical Research, University of Bern, Bern, Switzerland
distinctive pathogenesis somewhat similar to those ob-served clinically [2]. These models are beneficial in that they facilitate the investigation of the roles of single gene products in visual system function/pathology, but are not without shortcomings. One major issue with respect to genetic models of retinal degeneration relates to the time course of the degeneration, which can be significant even at birth. Functional measurements in newborn mice are unfortunately limited, because the eyes open only 2 weeks after birth. In some of the strains, one would miss the period with the highest disease activity or, even worse, detect an interference with the normal developmental apoptosis in the retina. Furthermore, the genetically triggered degeneration of the photoreceptors is sometimes very fast, which leaves only a small time window for experiments. A pharmacological model, in which onset and progression rate could be varied with the concentra-tion and applicaconcentra-tion time point, could largely circumvent these disadvantages.
The compound N-methyl-N-nitrosourea (MNU) is an established experimental cancer-inducing agent. Several publications have shown the development of both benign and malignant tumours after MNU treatment [3–5], with tumour development observed several months post-exposure. In addition to this well-established role as an experimental teratogen, MNU exposure also induces the degeneration of the photoreceptor cells of rodent eyes acutely following treatment but prior to tumour formation [6]. The photoreceptor cells degenerate because of the toxic effect of the compound, without damage in the retinal pigment epithelium (RPE) cell layer [7], although the exact pathogenesis remains poorly understood, which has been an impediment to the broader acceptance of this model to study retinal degeneration (e.g., retinitis pigmentosa). To further evaluate this model, we used two established methods to investigate the effect of MNU on visual function. First, the cued water maze, a modified version of the Morris water maze with a visible platform, was used to test vision [8, 9]. Second, the optokinetic reflex (OKR) measurement [10] was used to quantify the visual acuity in non-anaesthetised animals. Furthermore, using immunohistochemistry and relative quantitative PCR we investigated putative molecular pathways underlying the degenerative response of photoreceptor cells. One major class of molecules implicated in this response are caspases, which are well-established mediators of apoptosis and other forms of programmed cell death (PCD) in the retina [11]. In this study, the involvement of several PCD pathways including inflammatory caspases (e.g., caspase-1), initia-tor caspases (e.g., caspase-2) and effecinitia-tor or executioner caspases (e.g., caspase-3) are studied using the MNU model of photoreceptor degeneration.
Materials and methods Animals
C57BL/6 mice were used for this study (all male and 6– 8 weeks old) and were treated according to the regulations in the ARVO Statement for the Use of Animals in Ophthalmic and Vision Research. Mice received a single i.p. injection of 1% MNU in saline 0.5% (30, 45 or 60 mg/kg bodyweight; Sigma-Aldrich, Buchs, Switzerland). Visual function tests were conducted at days 3, 7, 14 and 21 post-injection (PI; n= 5). During the experiments, body weight and behaviour of the animals were monitored to observe possible side-effects of the substance. However, no refusal was observed. The animals showed spontaneous activity like snuffling, grooming or climbing, the fur was shiny and their eyes were open and clear after MNU treatment.
Histology and autofluorescence
Eyes were enucleated from the mice after euthanasia at days 1, 3, 7, 14 and 21 PI and fixed for at least 18 h with 4% PFA in PBS. The right eyes were embedded in paraffin, and 7 μm sections were cut. Sagittally oriented central sections of the optic nerve head (ONH) were used for measurement purposes. The sections were stained with hematoxylin and eosin (H&E) and analysed with Image-Pro plus© (Media Cybernetics, Bethesda, MD, USA), and individual measurements at six different locations in the retina [400, 600 and 1200μm superior (S1–S3) and inferior (I1–I3) from the ONH] were taken. The thicknesses of the outer nuclear layer (ONL) and inner nuclear layer (INL) were calculated by measuring the layer area and dividing it by the length of the area. The number of rows of photoreceptor nuclei was counted at the same positions. Statistical analysis was performed using Kruskal–Wallis analysis on ranks and pairwise comparison with Tukey's test in the SigmaStat 3.5 Software (Systat Software GmbH, Erkrath, Germany).
To evaluate the changes in the RPE autofluorescence, left eyes were processed for whole-eye flat mounts. Thereby, connective and muscle tissue was removed and an incision made at the ora serrata, followed by a circumpolar cut. The anterior part of the eye, together with the lens and sensory retina, were discarded, and the eyecup washed in PBS and flattened onto a glass slide by making four central cuts. The continuity of RPE fluorescence in these flat mounts was studied on a confocal microscope (Leica SP 2, Leica Microsystems, Heerbrugg SG, Switzerland) using an Argon laser (wavelength 488 nm), and digital images were acquired to compare control and MNU-treated specimens. Finally, the area without autofluorescence was quantified using imaging software (Image-Pro Plus; Media Cybernetics).
TUNEL and immunohistochemistry
Paraffin tissue sections were also used for TUNEL staining and immunohistochemistry. An in situ cell death detection kit, TMR red (Roche Applied Science, Rotkreuz, Switzerland; excitation wavelength 520–560 nm, emission maximum at 580 nm) was applied to detect TUNEL-positive cells within the retina. Immunohistochemistry was performed with rabbit anti-cleaved caspase-3 (Cell Signaling Technology, Danvers, MA, USA; 1:200) or caspase-6 (Cell Signaling Technology; 1:100) in TBS with 0.1% Triton X-100, 1% BSA and 2% goat serum, overnight at 4°C. Isotype control antibodies were used as negative controls. Retina sections of prph2/rds mice (postnatal day 14; kindly provided by Dr. Martin Reichel, formerly Department of Ophthalmology, University of Leipzig, Germany) served as a positive control [11]. To visualise retinal structures in sections with degenerated tissue, rhodopsin (mouse α-mouse opsin, Sigma-Aldrich; 1:10,000) was also stained. As secondary antibodies, goat α-rabbit / mouse Alexa 488 nm / 594 nm (LuBioScience, Luzern, Switzerland; 1:200/1:500 in TBS with 0.1% Triton X-100 and 1% BSA, for 1 h at RT) were applied.
Cued water maze measurement
For the cued water maze, a circular pool (1.8 m in diameter, 0.7 m in height) filled with water (23°C), made opaque with white non-toxic emulsion paint (Bahag AG, Mannheim, Germany), was used. Because of the opacity, the white platform (20 cm in diameter) placed inside the tank was invisible. The location of the platform was identified with a plastic cylinder (height 5 cm; radius 10 cm), which extended about 1.5 cm above the water surface, on top of the platform. The four release points for the mice were arranged around the pool and named 1, 2, 3 and 4. Prior to the tests, mice were familiarised with the pool and the platform for 60 s. Afterwards, the mice were trained twice with the platform and baseline measurements were recorded before the application of MNU.
Swim track recording was performed with a high-resolution camera (CCD-IRIA, Sony) placed above the pool and connected to a computer. Every test session including the baseline consisted of four trials, with the platform as well as the release point changed after every trial. Once a mouse reached the platform, it was allowed to rest there for 15 s before it was removed from the pool. Mice that failed to reach the platform were guided there manually and also allowed to rest for 15 s. From the recorded swim tracks, swim latency, path length and swim speed were calculated using Ethovision (Noldus Informa-tion Technology, Wageningen, The Netherlands). The measurements were always taken in morning sessions, and statistical analysis was performed using Kruskal–Wallis
analysis on ranks and pairwise comparison with Student– Neumann–Keuls in the SigmaStat 3.5 software.
OKR measurement
The OptoMotry System from CerebralMechanics (Lethbridge, AB, Canada) was used to measure the OKR. A virtual cylinder comprising a vertical sine wave grating was projected in 3D coordinate space on computer monitors (17” LCD computer monitors, Model 1703FP; Dell, Phoenix, AZ, USA) arranged in a square around and projecting to the testing area, consisting of a platform positioned 13 cm above a mirrored floor under a likewise mirrored lid. To record the behaviour of the mice, a video camera (DCR-HC26, Sony) was positioned directly above the platform and connected to a computer, allowing live video feedback. The computer was also used to project the virtual cylinder on the monitors in a 3D coordinated space, controlling the speed of rotation and geometry of the cylinder and spatial frequency of the stimuli. The image on the monitors was expanded by the mirrors on the floor and the ceiling, thereby simulating the monitors as windows to a surrounding 3D world.
During testing the mice stood unrestrained on the platform tracking the 3D pattern with a reflexive head movement. The movements of the mice on the platform were followed by the experimenter with a crosshair super-imposed on the video image to centre the rotation of the virtual cylinder with the x-y positional coordinates of the crosshair at the mouse’s viewing position, maintaining the pattern at a constant distance from the animal. Mice normally stopped moving when a grating perceptible to them was projected onto the cylinder wall and the cylinder was rotated and began tracking the pattern with reflexive head movements in concert with the rotation. The decision of whether the mouse tracks the pattern or not was made by the experimenter based on evident head movement against the stationary arm of the crosshair. Animals that slipped or jumped off the platform during the test trial were simply returned to the platform and testing was continued. The measurements were always taken in morning sessions, and all animals were acclimated to the testing by placing them on the platform for a few minutes without testing. Two independent experimenters were blinded to treatment and previous records whenever possible.
Tracking behaviour was assessed repeatedly for a few seconds until unambiguous tracking was observed, to reduce the possibility of adaptation to the stimulus and be sure that each animal was capable of tracking when a stimulus was present. The testing was initiated with a low spatial grating and, using a staircase procedure, the spatial frequency of the grating was increased randomly until the animal no longer responded. The spatial frequency of the test grating was changed repeatedly until the highest spatial
frequency the mouse could track was identified as the threshold. Statistical analysis was performed with a Krus-kal–Wallis analysis on ranks and a pairwise comparison using Student–Neumann–Keuls in the SigmaStat 3.5 software.
Quantitative polymerase chain reaction (qRT-PCR)
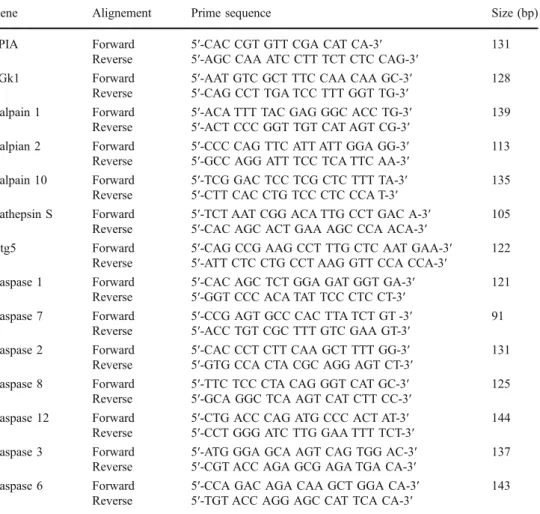
Mice were sacrificed 1, 3 and 7 days PI (45 mg/kg bodyweight MNU), and enucleated eyes were immedi-ately immersed in RNAlater (Qiagen, Hombrechtikon, Switzerland). Neurosensory retina tissue was prepared by an incision at the ora serrata followed by a circumpolar cut. The anterior part of the eye as well as the lens was discarded. The neurosensory retina was separated from the eyecup and further processed to cDNA with the μMACS™ RNA isolation kit and the μMACS™ one-step cDNA kit (Miltenyi Biotech GmbH, Bergisch-Gladbach, Germany) including a DNAse I (Ambion Inc., Austin, TX, USA) treatment as recommended by the manufacturer. All primers were quality controlled by sequencing the template on a genetic analyser ABI PRISM® 3100 (Applied Biosystems Inc., Foster City,
CA, USA). Primer sequences are depicted in Table 1. The PCR samples were cleaned up and labelled with the BigDye® Terminator V1.1 cycle sequencing kit (Applied Biosystems Inc.). Reference gene analysis was performed with a Mouse Endogenous Control Gene Panel (TATAA Biocenter AB, Gothenburg, Sweden). The following two reference genes were selected: phosphoglycerate kinase 1 (PGK) and peptidylpropyl isomerase A (PPIA).
Relative qRT-PCR was performed with iQ™ SYBR® Green Supermix (Bio-Rad Laboratories, Reinach, Switzerland) on a MyiQ™ single colour real-time PCR detection system (Bio-Rad Laboratories). PCR samples were preheated to 95°C for 5 min and internal calibration was performed. Fifty cycles were performed, each consisting of 30 s denaturation at 95°C, a 30 s annealing at 58°C and a 30 s extension at 72°C. To quantify the data, the following calculations were performed: first, the mean of sample duplicates, second, normalisation versus the two reference genes (see above), and third, fold changes compared with the controls. Separate control samples were prepared at each time point. Statistical analysis was performed with GenEx (MultiD Analyses AB, Gothenburg, Sweden) using an unpaired two-tailed t-test with multiple testing correction.
Gene Alignement Prime sequence Size (bp)
PPIA Forward 5′-CAC CGT GTT CGA CAT CA-3′ 131
Reverse 5′-AGC CAA ATC CTT TCT CTC CAG-3′
PGk1 Forward 5′-AAT GTC GCT TTC CAA CAA GC-3′ 128
Reverse 5′-CAG CCT TGA TCC TTT GGT TG-3′
Calpain 1 Forward 5′-ACA TTT TAC GAG GGC ACC TG-3′ 139
Reverse 5′-ACT CCC GGT TGT CAT AGT CG-3′
Calpian 2 Forward 5′-CCC CAG TTC ATT ATT GGA GG-3′ 113
Reverse 5′-GCC AGG ATT TCC TCA TTC AA-3′
Calpain 10 Forward 5′-TCG GAC TCC TCG CTC TTT TA-3′ 135
Reverse 5′-CTT CAC CTG TCC CTC CCA T-3′
Cathepsin S Forward 5′-TCT AAT CGG ACA TTG CCT GAC A-3′ 105
Reverse 5′-CAC AGC ACT GAA AGC CCA ACA-3′
Atg5 Forward 5′-CAG CCG AAG CCT TTG CTC AAT GAA-3′ 122
Reverse 5′-ATT CTC CTG CCT AAG GTT CCA CCA-3′
Caspase 1 Forward 5′-CAC AGC TCT GGA GAT GGT GA-3′ 121
Reverse 5′-GGT CCC ACA TAT TCC CTC CT-3′
Caspase 7 Forward 5′-CCG AGT GCC CAC TTA TCT GT -3′ 91
Reverse 5′-ACC TGT CGC TTT GTC GAA GT-3′
Caspase 2 Forward 5′-CAC CCT CTT CAA GCT TTT GG-3′ 131
Reverse 5′-GTG CCA CTA CGC AGG AGT CT-3′
Caspase 8 Forward 5′-TTC TCC CTA CAG GGT CAT GC-3′ 125
Reverse 5′-GCA GGC TCA AGT CAT CTT CC-3′
Caspase 12 Forward 5′-CTG ACC CAG ATG CCC ACT AT-3′ 144
Reverse 5′-CCT GGG ATC TTG GAA TTT TCT-3′
Caspase 3 Forward 5′-ATG GGA GCA AGT CAG TGG AC-3′ 137
Reverse 5′-CGT ACC AGA GCG AGA TGA CA-3′
Caspase 6 Forward 5′-CCA GAC AGA CAA GCT GGA CA-3′ 143
Reverse 5′-TGT ACC AGG AGC CAT TCA CA-3′
Table 1 Primer sequences used for qRT-PCR
Results
Morphometric measurements
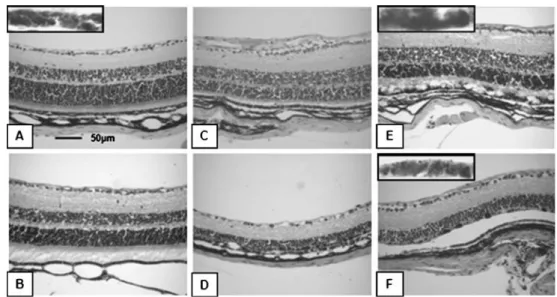
The lowest concentration of MNU (30 mg/kg) caused no significant changes in the mouse retina (Fig.1b) compared to normal retinal morphology (Fig.1a). However, damage caused by higher MNU dose (45 mg/ kg) was visible at day 3 PI (Fig. 1c) and sustained over time (Fig. 1d). Retinal structure was disturbed and swollen from day 3 PI, and the thickness of the ONL was significantly decreased compared with untreated control animals in the group that received
60 mg/kg MNU (Fig. 1e,f). Over time, the retina became thinner, eventually leading to the almost complete loss of the ONL in the 60 mg/kg group 1 week PI (Fig. 2a). Additionally, we also counted the number of nuclei per row in the ONL, and found comparable results (Fig. 2b). The INL was unaffected except with the highest dose (60 mg/kg MNU), where the INL also grew thinner (data not shown). To investigate a possible spatial distribution of MNU-induced changes, we also compared data from peripheral and more central areas within the retina. Thereby, degen-eration appeared more prominent in the periphery than at the area of the ONH (Table2depicts data at day 21 PI). In
Fig. 1 Representative examples of H&E-stained paraffin sections
(7μm). Control animals treated with 50 μl 0.9% NaCl i.p. display a
normal retina (a) with all cell layers fully preserved, including inner and outer segments (IS+OS). After treatment with 30 mg/kg MNU, no major changes in the retina were visible (b, day 14 PI). By comparison, the application of 45 mg/kg MNU induced the disruption of the outer segments at day 3 PI (c) and the ONL thickness was decreased, a process that was sustained until day 7 PI where only one
row of nuclei was left (d). A similar outcome was seen with the highest dose 60 mg/kg MNU (e: day 3 PI). At day 7 PI, there were no cells in the ONL remaining, only cell debris (f). RPE cells were unaffected by MNU, even with the highest dose used (see inserts in panels a, e, f). However, in the first phase of the degeneration, at day 3 PI (e), they looked swollen and vacuolated, but afterwards, from day 7 PI, the monolayer appeared normal and recovered (f)
Fig. 2 Morphometric analysis of the H&E-stained paraffin sections after the injection of MNU (black column=30 mg/kg, striped column=45 mg/kg, dotted column=60 mg/kg MNU). The thickness of the ONL was calculated by measuring the area of the ONL and dividing it by the length of the area
at six different locations in the retina (a). The number of rows of photoreceptor nuclei was counted at the same positions (b). Horizontal lines represent control values and significant differences were depicted by asterisks (p value <0.05). Data are shown as mean±SD (n=5/group)
contrast to the morphometric changes in the ONL, RPE cells did not seem to be affected by MNU treatment in the histological sections. Even though the RPE cells looked swollen 3 days PI, their morphology appeared normal after 1 week (see inserts in Fig. 1a,e,f). Furthermore, RPE autofluorescence was not significantly altered, with the area void of RPE cells remaining unchanged over time (e.g., 45 mg/ kg MNU vs control — d3 PI: 32.3×103 μm2vs 35.4×103μm2; d21 PI: 21.7×103μm2vs 20.9×103μm2). Visual function
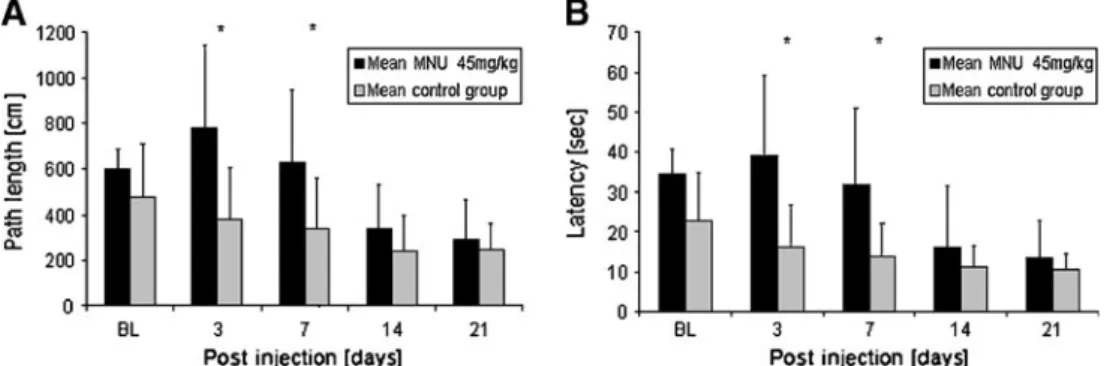
Cued water maze measurements did not reveal significant differences between treated and untreated animals with the lowest dose (30 mg/kg MNU) applied (data not shown). With 45 mg/kg MNU, a significant difference in path length (Fig.3a) and latency (Fig.3b) was detected 3 and 7 days PI. However, at later time points, as the number of trials increased, swim distance and escape latency decreased in both groups. The highest dose (60 mg/kg MNU) showed a significant difference compared with the control group in both parameters at all time points (data not shown). No significant difference in swim speed could be detected, indicating that MNU did not affect the physical ability to swim. Furthermore, neither change in body weight and behaviour nor any indication of tumour development was found. Survival rates for all experimen-tal animals also remained at 100% throughout the experimental period.
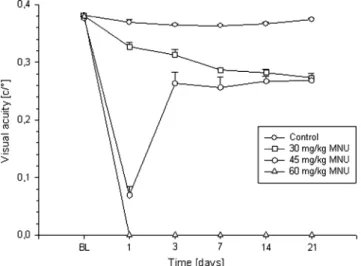
OKR measurements recorded significant differences in visual acuity in all treatment groups, confirming the OKR as a more sensitive method than the cued water maze (Fig.4). The first group (30 mg/kg MNU) showed significantly reduced visual acuity compared with the control group on day 1. The threshold decreased further over time. By contrast, the 45 mg/kg MNU group showed a significant decrease in OKR response also beginning on day 1, but the OKR threshold remained stable after a strong initial drop in visual acuity. Mice treated with 60 mg/kg MNU showed no optokinetic response from 1 day PI. In contrast to the cued water maze method, the OKR measurement showed no relearning effect, because optokinetic behaviour is an involuntary movement of the eyes.
Immunohistochemistry
TUNEL staining showed no positive results in control section (Fig. 5a) and after treatment with 30 mg/kg MNU (Fig.5b), but did so with 45 mg/kg MNU 3 and 7 days PI (Fig. 5c, d). However, for the 60 mg/kg group the latest positive immunostaining results obtained were 3 days PI (Fig. 5e) because of significant cell loss, with few assessable cells preserved in the ONL at later experimental time points (Fig.5f).
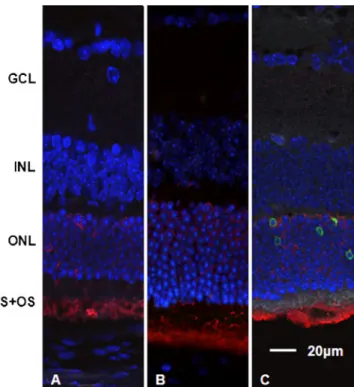
To have a deeper insight in the cell death pathway induced by MNU, cleaved caspase-3 staining was per-formed. No caspase-3-positive staining could be detected at all time points and concentrations applied. A representative example with 45 mg/kg MNU from day 7 is shown in Fig.6a.
Treatment Location I3 I2 I1 S1 S2 S3 Untreated 33.8±4.0 36.0±4.1 38.6±2.9 37.8±3.9 36.2±2.8 33.4±2.7 30 mg/kg 28.2±3.3 30.6±3.6 31.2±4.1 31.4±4.7 30.6±5.9 27.6±7.5 45 mg/kg 19.8±6.9 20.2±10.4 11.0±6.6 8.6±4.1 15.4±7.7 17.4±5.8 60 mg/kg 1.3±2.5 0±0 0±0 0±0 0±0 0±0
Table 2 ONL thickness in the C57/BL6 mice after treatment with different concentrations of MNU at the different measure-ment locations at day 21 (n=5; mean±SD)
400, 600, 1200μm superior
(S1-S3) and inferior (I1-I3) from ONH
Fig. 3 Mean path length and latency measured in the cued water maze after the application of 45 mg/kg MNU. The path length (a) and latency (b) both declined over time because of a learning effect in both groups, but the treated animals had significantly longer pathways and higher
latency at day 3 and 7 PI compared with the control (*, p value <0.05, n=5/group). The swim speed was not significantly altered after the application of MNU
The untreated control was negative (Fig. 6b), whereas the positive control (Fig.6c), a retina section from a mouse with the rds mutation that is known to induce caspase-3 cleavage, was positive [11]. Furthermore, we stained caspase-6, as an additional effector caspase in PCD. We observed a qualita-tive decrease in caspase-6-posiqualita-tive cells over time and with increasing MNU concentrations in the outer retina. Fig. 7
shows examples: from the untreated control group in 7a,
30 mg/kg at day 7 PI in7b, 45 mg/kg at day 3 PI in7cand 60 mg/kg at day 1 and day 3 PI in7dand7erespectively.
qRT-PCR
The reference gene analysis revealed three feasible candi-dates: Phosphoglycerate kinase 1 (PGK), peptidylpropyl isomerase cyclophilin A (PPIA), and hypoxanthine-guanine phosphoribosyltransferase (HPRT). For logistical reasons, only two of them, PPIA and PGK, were used.
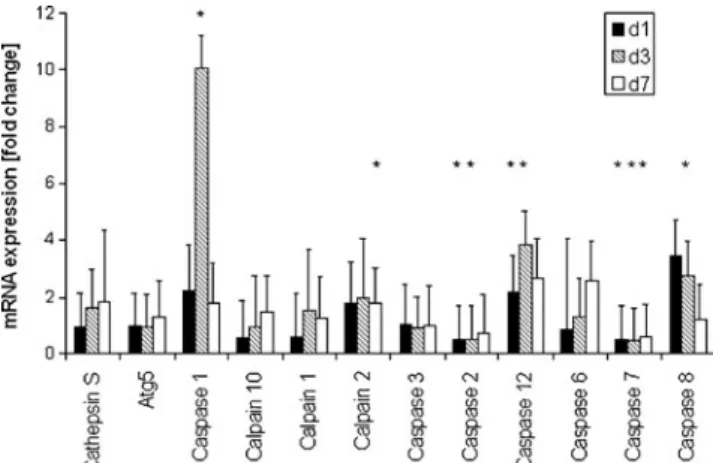
To identify the pathways involved in retinal cell death, the relative expression levels of several specific markers were assessed: calpain-1, -2 and -10 (neurodegeneration), cathepsin S (necrosis/lysosomal stress), Atg5 (autophagy), caspase-1 and -7 (inflammation), caspase-2, -8 and -12 (apoptosis/ initiator) and caspase-3 and -6 (apoptosis/execution). The analysis at three time points after the injection of 45 mg/kg MNU revealed changes in the gene expression of 50% of the genes of interest: four genes were upregulated, two were downregulated and six were not significantly altered com-pared to the controls (Fig.8). Table3 contains the specific values of the gene expression.
Discussion
These results show that an injection of MNU i.p. induces cell death in the mouse retina, as already reported by other
Fig. 4 OKR measurements for visual acuity in the control group (circles) and the 30 mg/kg (squares), 45 mg/kg (hexagons) and 60 mg/kg MNU (triangles) treatment groups. All measurements showed significant differences between treated and untreated animals (p value <0.05, n= 5/group) at all time points, except the baseline
Fig. 5 Paraffin sections stained with TUNEL (red, 580 nm) and DAPI (blue). No positive cells were observed in the retinas of the control
mice treated with 50μl 0.9% NaCl i.p. (a) as well as of the mice
treated with 30 mg/kg MNU (b). Three and 7 days after the application of 45 mg/kg MNU, positive cells appeared in the ONL
of the retinas (c, d). Note that panel d shows no discernable ONL. The
remaining row of photoreceptor nuclei (see Fig.1d) is directly adjacent
to the INL. 60 mg/kg MNU led to TUNEL-positive cells in the ONL on day 3 PI (e), whereas a severe decrease in cell numbers up to day 7 PI left no positive cells at this time point (f). GCL = ganglion cell layer
groups [6,7]. We showed that the damage in the ONL of the retina increased with time and concentration by staining histological sections at different time points. But compared with other pharmacological compounds inducing retinal injury, such as NaIO3 [9], the correlation is non-linear.
Although 30 mg/kg MNU is barely enough to induce significant retinal pathology, 45 mg/kg MNU results in severe damage, comparable to the highest dose used (60 mg/kg). In addition, the most significant cellular ablation was observed in the first 3 days PI. This has also been shown by others [7]. Consistent with the temporal course of this cellular loss, we found a high amount of TUNEL-positive cells and an immediate decline in the visual acuity, which remains more or less stable in the chronic phase of retinal pathology. By contrast, decrease of retinal thickness is delayed, most probably because of the deferred clearance of cellular debris. Furthermore, our morphometric data indicate that the peripheral retina is more prone to MNU-induced damage. However, others have seen an apoptotic index of the peripheral retina similar to those of the posterior pole [12]. As the retina shows physiological differences in this regard, conclusions should be drawn carefully.
The major contribution of this study is the investigation of functional changes associated with this experimental model of retinal degeneration. The use of OKR and cued water maze has already proved useful in the past to monitor the changes in visual function after the application of cell toxic substances, showing a rather expeditious course of degeneration. With the OKR, we were not able to measure any visual acuity in the mice treated with 60 mg/kg MNU beginning on day 1 PI. Furthermore, the same mice were unable to find the platform in the water maze, corroborating this acute loss of visual function following a single injection of MNU. In contrast to the highest dose, we could still measure the visual function in mice treated with 45 mg/kg MNU. Visual acuity in the OKR was already diminished significantly at day 1 PI, followed by a new surge of optokinetic response. The heavy drop of visual acuity might represent a block in DNA repair because of
Fig. 6 Staining for cleaved caspase-3 (green) and opsin (red) with DAPI nuclei staining (blue). Staining for cleaved caspase-3 was negative for all concentrations applied and all time points. In the section shown here as a representative example (45 mg/kg MNU, day 7 PI), only the red opsin staining in the ONL and the outer segments as well as the blue nuclei were detectable (a). The same result was seen in the control (b). As a positive control, rds mice (BL6 background), which are known to activate caspase-3, were used (c)
Fig. 7 Staining for caspase-6 (green) with DAPI nuclei staining (blue). Staining for caspase-6 was positive in control sections and after 30 mg/kg MNU treatment in the outer retina. In retina sections from mice treated with higher MNU concentrations, no caspase-6 staining was found at any investigated time point. Shown here are representative examples for different time points and MNU concentrations (a control group, b 30 mg/kg day 7, c 45 mg/kg day 3, d/e 60 mg/kg day 1/day 3)
accelerated poly(ADP-ribose) formation and energy depletion [13, 14]. This effect could then be partly equated, and recorded acuity increased minimally after the first onset. However, vision remained significantly reduced during the investigated time period. Furthermore, differences of visual acuity between the 45 and 60 mg/kg MNU groups do not correlate directly with the found changes at the structural level in these groups. Areas with remaining intact photo-receptors might be able to compensate functionally for lost cells in the ONL. Therefore, it appears that 45 mg/kg MNU lead to higher damage in morphology compared to measured visual function, at least at the level of the optic nerve head. This was not the case with the cued water maze, where the mice reached the same values in path length and latency as the control mice after an initial significant increase (day 3 and day 7 PI). This relearning effect has been described by other groups as well [15, 16], and led to a diminished sensitivity of this method. However, using the cued water maze one can measure the significant decrease in the visual
function to different degrees. Histology confirmed the functional outcome for low and high doses. The medium dose of MNU, however, showed decreased but stable visual acuity despite increasing damage to the retinal structure over time. This might be because of the remaining peripheral photoreceptors in other areas, since we performed morphometric measurements at one level only.
TUNEL staining was positive in our experiments, indicat-ing cell death after MNU treatment. However, this method is not specific for apoptosis, but only a detection system for cells with fragmented DNA that can be caused by many different pathways. Therefore, we wanted to gain more insight into the pathogenesis and mode of cell death induced. We chose 45 mg/kg MNU, because with a higher dose the degeneration takes place too fast and with a lower dose there is not enough damage to detect. Owing to the importance of the activation of caspase-3 in apoptosis, we first stained for cleaved caspase-3 in our tissue sections. The negative results indicated a caspase-3-independent pathway. By contrast, uncleaved caspase-6 was downregulated at higher MNU concentrations over time. An explanation for this effect could be caspase-6 activation by cleavage, protein degradation, or the inhibition of caspase-6 synthesis. Nevertheless, the involvement of caspase-6 might indicate an alternative apoptotic pathway, because this caspase has been demonstrated to bring about cell death in the absence of caspase-3 activity [17].
Additionally, we selected several genes of interest covering a broad spectrum of cell death pathways to investigate alternative PCD regulation after MNU via qRT-PCR. The expression of caspase-12 was significantly upregulated at day 1 and 3 PI, earlier than most of the other genes. Therefore, caspase-12, which is known to participate in endoplasmic reticulum (ER) stress-mediated apoptosis [18–20], is presum-ably involved in the early steps of cell death induction by MNU. Caspase-8, known as a pro-apoptotic initiator caspase, was upregulated at day 3 PI only. This observation is significant, in that it can activate calpain-2 [21, 22], which
d1 d3 d7
Calpain 1 Neurodegeneration −1.8 (1.6) 1.5 (2.1) 1.3 (1.4)
Calpain 2 Neurodegeneration 1.8 (1.5) 2.0 (2.1) 1.8 (1.3)
Calpain 10 Neurodegeneration −1.8 (1.3) −1.1 (1.8) 1.5 (1.3)
Cathepsin S Necrosis/ Lysosomal stress −1.1 (1.2) 1.6 (1.4) 1.8 (2.5)
Atg5 Autophagy −1.0 (1.2) −1.1 (1.2) 1.3 (1.2)
Caspase 1 Inflammation 2.3 (1.6) 10.1 (1.1) 1.8 (1.4)
Caspase 7 Inflammation −1.9 (1.1) −2.2 (1.2) −1.7 (1.1)
Casapase 2 Apoptosis/ Initiator −1.8 (1.1) −2.2 (1.2) −1.4 (1.3)
Caspase 8 Apoptosis/ Initiator 3.5 (1.2) 2.8 (1.2) 1.2 (1.3)
Caspase 12 Apoptosis/ Initiator 2.2 (1.3) 3.8 (1.2) 2.7 (1.4)
Caspase 3 Apoptosis/ Execution 1.1 (1.4) −1.1 (1.1) 1.0 (1.4)
Caspase 6 Apoptosis/ Execution −1.2 (3.2) 1.3 (1.4) 2.6 (1.4)
Table 3 Mean fold change in mRNA (±SD) measured by qRT-PCR. Significant changes are in bold
Fig. 8 Fold change in mRNA measured by qRT-PCR. Every gene is illustrated by three bars representing the time points analysed (days 1, 3 and 7 PI). Significant differences are indicated by asterisks [p value <0.05, n = 5 for the treatment group (45 mg/kg), n = 3 for the control group]
was also upregulated at the same time point in our experi-ments. Together they are thought to activate the effector caspase-3 and induce apoptosis. These data support the proposed role of calpain-2 in MNU-induced cell death as suggested by others [23]. The third upregulated caspase, caspase-1, is highly homologous to caspase-12 and a mediator caspase for innate inflammation [24–26]. Caspase-2, an initiator caspase activated by death receptors such as Fas, was downregulated, indicating that the extrinsic pathway of apoptosis is not involved [27]. As a member of the classical apoptotic pathway, caspase-7 was also downregu-lated. No significant regulation was found for Atg, a marker for autophagy, caspase-3 and -6, both effector caspases [28], and calpain-1 and -10, involved in calcium-induced cell death and known to participate in many forms of neurodegeneration [29]. Together with no detectable change in gene expression of caspase-3, the downregulation of caspase-7 indicated that the classical pathways are not switched on by MNU [28,30]. This confirms the immunohistochemical results, where we found no caspase-3 involvement. By contrast, the decrease of uncleaved caspase-6 after MNU treatment in the staining experiments could be explained by a lack of RNA upregulation of the enzyme seen in PCR (see above).
The increase of cathepsin S expression on day 3 PI was not significant. A significant upregulation of the expression of this gene would have pointed to necrosis or apoptosis induced by lysosomal stress, as indicated by others [31].
In summary, the results from immunohistochemistry and gene expression analysis indicate that the caspase-3-dependent apoptosis pathway is not triggered by MNU. Therefore, other apoptotic pathways have to be involved in MNU-induced photoreceptor degeneration. One candidate might be caspase-8, regarded as the key initiator of death receptor-mediated apoptosis [28]. The role of other cas-pases might not be essential for inducing cell death via MNU. Bax and Bcl-2 have been shown to be involved in the process as well [12]. Our data also indicated that most probably other pathways such as ER stress-mediated apoptosis or inflammation were involved. Further inves-tigations in this direction might lead to detailed insight into cell death pathways in retinal degeneration, but this was not the focus of the current study. Additionally, MNU provides a suitable pharmacological model for specific photoreceptor degeneration. By choosing the appropriate concentration, one can influence the scale of damage and use functional outcome measurements to quantify the efficiency of cell replacement or neuroprotective therapies.
Acknowledgements The authors thank Monika Kilchenmann for
her excellent technical assistance and Richard L. Benton for critically reading the manuscript. This work was partly supported by grants from the Fritz Tobler-Foundation (RZ) and the Berne University Research Foundation (VE).
References
1. Hartong DT, Berson EL, Dryja TP (2006) Retinitis pigmentosa. Lancet 368:1795–1809
2. Chang B, Hawes NL, Hurd RE, Davisson MT, Nusinowitz S, Heckenlively JR (2002) Retinal degeneration mutants in the mouse. Vis Res 42:517–525
3. Machida K, Urano K, TsutsumiH YM, Nomura T, Usui T (2008) Carcinogenic comparative study on rasH2 mice produced by two
breeding facilities. J Toxicol Sci 33:493–501
4. Morton D, Bailey KL, Stout CL, Weaver RJ, White KA, Lorenzen MJ, Ball DJ (2008) N-Methyl-N-Nitrosourea (MNU): a positive
control chemical for p53+/– mouse carcinogenicity studies. Toxicol
Pathol 36:926–931
5. Terracini B, Testa MC (1970) Carcinogenicity of a single administration of N-nitrosomethylurea: a comparison between
newborn and 5-week-old mice and rats. Br J Cancer 24:588–598
6. Yuge K, Nambu H, Senzaki H, Nakao I, Miki H, Uyama M, Tsubura A (1996) N-Methyl-N-nitrosourea-induced photoreceptor
apoptosis in the mouse retina. In Vivo 10:483–488
7. Nambu H, Yuge K, Nakajima H, Shikata N, Takahashi K, Miki H, Uyama M, Tsubura A (1997) Morphologic characteristics of N-Methyl-N-Nitrosourea-induced retinal degeneration in C57BL6 mice. Pathol Int 47:377–383
8. D'Hooge R, De Deyn PP (2001) Applications of the Morris water
maze in the study of learning and memory. Brain Res Rev 36:60–
90
9. Enzmann V, Row BW, Yamauchi Y, Kheirandish L, Gozal D, Kaplan HJ, McCall MA (2006) Behavioral and anatomical abnormalities in a sodium iodate-induced model of retinal pigment
epithelium degeneration. Exp Eye Res 82:441–448
10. Prusky GT, Alam NM, Beekman S, Douglas RM (2004) Rapid quantification of adult and developing mouse spatial vision using
a virtual optomotor system. Investig Ophthalmol Vis Sci 45:4611–
4616
11. Sarra GM, Sarra FG, Schlichtenbrede FC, Trittibach P, Estermann S, Tsiroukis E, Ali RR, Luthert PJ, Reichel MB (2005) Effect of steroidal and non-steroidal drugs on the microglia activation pattern and the course of degeneration in the retinal degeneration slow mouse. Ophthalmic Res 37:72–82
12. Yoshizawa K, Nambu H, Yang J, Oishi Y, Senzaki H, Shikata N, Miki H, Tsubura A (1999) Mechanisms of photoreceptor apoptosis induced by N-Methyl-N-nitrosourea in Sprague–Dawley rats. Lab
Invest 79:1359–1367
13. Carson DA, Seto S, Wasson DB, Carrera CJ (1986) DNA strand breaks, NAD metabolism, and programmed cell death. Exp Cell
Res 164:273–281
14. Miki K, Uehara N, Shikata N, Matsumura M, Tsubura A (2007) Poly (ADP-ribose) polymerase inhibitor 3-aminobenzamide rescues N-methyl-N-nitrosourea-induced photoreceptor cell apoptosis in
Sprague–Dawley rats through preservation of nuclear factor-kB
activity. Exp Eye Res 84:285–292
15. Morris R (1984) Developments of a water-maze procedure for
studying spatial learning in the rat. J Neurosci Meth 11:47–61
16. Block F (1999) Global ischemia and behavioural deficits. Prog
Neurobiol 58:279–295
17. Chee JLY, Guan XL, Lee JY, Dong B, Leong SM, Ong EH, Liou AKF, Lim TM (2005) Compensatory caspase activation in MPP+-induced cell death in dopaminergic neurons. Cell Mol Life Sci 62:227–238 18. Sancho-Pelluz J, Arango-Gonzalez B, Kustermann S, Romero FJ,
van Veen T, Zrenner E, Ekström P, Paquet-Durand F (2008) Photoreceptor cell death mechanisms in inherited retinal degeneration.
Mol Neurobiol 38:253–269
19. Morishima N, Nakanishi K, Takenouchi H, Shibata T, Yasuhiko Y (2002) An endoplasmic reticulum stress-specific caspase cascade
in apoptosis. Cytochrome c-independent activation of caspase-9
by caspase-12. J Biol Chem 277:34287–34294
20. Szegezdi E, Fitzgerald U, Samali A (2003) Caspase-12 and ER-stress-mediated apoptosis: the story so far. Ann NY Acad Sci 1010:186–194
21. Frisch SM (2008) Caspase-8: fly or die. Cancer Res 68:4491–4493 22. Maelfait J, Beyaert R (2008) Non-apoptotic functions of caspase-8.
Biochem Pharmacol 76:1365–1373
23. Oka T, Nakajima T, Tamada Y, Shearer TR, Azuma M (2007) Contribution of calpains to photoreceptor cell death in
N-methyl-N-nitrosourea-treated rats. Exp Neurol 204:39–48
24. Fan T-J, Han L-H, Cong R-S, Liang J (2005) Caspase family
proteases and apoptosis. Acta Biochim Biophys Sin 37:719–727
25. Lamkanfi M, Dixit VM (2009) Inflammasomes: guardians of
cytosolic sanctity. Immunol Rev 227:95–105
26. Yu HB, Finlay BB (2008) The caspase-1 inflammasome: a pilot of
innate immune responses. Cell Host Microbe 4:198–208
27. Krumschnabel G, Sohm B, Bock F, Manzl C, Villunger A (2009) The enigma of caspase-2: the laymen's view. Cell Death Differ 16 (2):195–207
28. Chowdhury I, Tharakan B, Bhat GK (2008) Caspases — an
update. Comp Biochem Physiol B Biochem Mol Biol 151:10–27 29. Czogalla A, Sikorski AF (2005) Spectrin and calpain: a 'target' and a 'sniper' in the pathology of neuronal cells. Cell Mol Life Sci
62:1913–1924
30. Kuribayashi K, Mayes PA, El-Deiry WS (2006) What are caspases 3 and 7 doing upstream of the mitochondria? Cancer
Biol Ther 5:763–765
31. Conus S, Simon HU (2008) Cathepsins: key modulators of cell death