Pflugers Arch - Eur J Physiol (2004) 448: 16–28 DOI 10.1007/s00424-003-1227-4
A C I D - B A S E R E G U L ATI O N
Brenda Bonnici . Carsten A. Wagner
Postnatal expression of transport proteins involved in acid–base
transport in mouse kidney
Received: 18 October 2003 / Revised: 24 November 2003 / Accepted: 1 December 2003 / Published online: 31 January 2004
# Springer-Verlag 2004
Abstract The kidney plays a major role in maintaining
and controlling systemic acid
–base homeostasis by
reabsorbing bicarbonate and secreting protons and
acid-equivalents, respectively. During postnatal kidney
devel-opment and adaptation to changing diets, plasma
bicar-bonate levels are increasing, the capacity for urinary
acidification maturates, and the final morphology and
distribution of intercalated cells is achieved. In adult
kidney, at least two types of intercalated cells (IC) are
found along the collecting duct characterised either by the
expression of AE1 (type A IC) or pendrin (non-type A IC)
where non-type A IC are found only in the convoluted
distal tubule, connecting tubule and cortical collecting
duct. Here we investigated in mouse kidney the relative
mRNA abundance, protein expression levels and
distribu-tion of several proteins involved in renal acid
–base
transport, namely, the Na
+/HCO
3−cotransporter NBC1
(SLC4A4), the Na
+/H
+-exchanger NHE3 (SLC9A3), two
subunits of the vacuolar H
+-ATPase [ATP6V0A4 (a4),
ATP6V1B1 (B1)], the Cl
−/HCO
3−exchangers AE1
(SLC4A1) and pendrin (SLC26A4). Relative mRNA
abundance of all transport proteins was lowest at day 3
after birth and increased thereafter in parallel with protein
levels. The numbers of type A and non-type A IC in the
cortical collecting duct (CCD) increased from day 3 to
days 18 and 24, whereas the number of IC in the CCD
with apical staining for the vacuolar H
+-ATPase subunits
a4 and B1 decreased from day 3 to days 18 and 24,
respectively. In addition, cells with characteristics of
non-type A IC (pendrin expression, basolateral expression of
vacuolar H
+-ATPase subunits) were found in the inner and
outer medulla 3 days after birth but were absent from the
medulla of 24-day-old mice. Taken together, these results
demonstrate massive changes in mRNA and protein
expression levels of several acid
–base transporters during
postnatal kidney maturation and also show changes in
intercalated cell phenotype in the medulla during these
processes.
Keywords Acid-base transport . Protein expression .
Kidney . Intercalated cells
Introduction
Together with respiration, the kidney is essential in
controlling acid
–base homeostasis. The proximal tubule
is responsible for the reabsorption of about 80% of filtered
bicarbonate [
6
,
14
,
40
], and contains among other acid
–
base transporters on the apical side, the Na
+/H
+exchanger
NHE3 (SLC9A3), vacuolar H
+-ATPases and on the
basolateral
membrane
the
Na
+/HCO
3−cotransporter
NBC1 (SLC4A4). Both NHE3 and vacuolar H
+-ATPases
are responsible for H
+secretion mediating the first step of
HCO
3−reabsorption [
14
], whereas NBC1 is expressed on
the basolateral membrane of the proximal tubule and
extrudes HCO
3−into the peritubular interstitium [
14
,
34
].
Fine regulation of acid
–base excretion and absorption
occurs in the connecting tubule (CNT), the cortical
collecting duct (CCD) and outer medullary collecting
duct (OMCD) [
14
,
47
]. The CNT and CCD either reabsorb
or secrete H
+and HCO
3−, respectively, whereas the
OMCD secretes only H
+[
14
,
47
]. At least three cell types
are present in the collecting duct: principal cells, type A
intercalated cells and non-type A intercalated cells.
Principal cells comprise about two-thirds of the cells in
the CNT and CCD [
22
,
43
] and are characterised by their
expression of the AQP2 water channel protein [
32
].
Intercalated cells are the main cells involved in acid
–
base transport along the collecting duct and they are
present in CNT, CCD, OMCD and the initial third of the
inner medullary collecting duct (IMCD) [
22
,
27
,
43
,
47
].
Based on morphological and functional characteristics, at
least two types of intercalated cells may be distinguished:
type A and non-type A intercalated cells. Some authors
B. Bonnici . C. A. Wagner (*)Institute of Physiology, University of Zurich, Winterthurerstr. 190,
8057 Zurich, Switzerland e-mail: [email protected] Tel.: +41-1-63-55032
have subdivided the non-type A intercalated into two
subtypes: type B cells and non-A-non-B cells (or
γ-cells)
characterised by bipolar or apical vacuolar H
+-ATPase
expression, respectively, in the absence of positive staining
for the Cl
−/HCO
3−exchanger AE-1 [
12
,
22
,
43
,
47
]. Type
A intercalated cells secrete H
+into urine and release
HCO
3−in exchange for Cl
−into the peritubular
intersti-tium, and can be identified by the presence of H
+-ATPase
on the apical plasma membrane and a band 3-like Cl
−/
HCO
3−exchanger AE1 (SLC4A1) on the basolateral
plasma membrane [
1
,
22
,
37
,
43
]. In contrast, non-type A
intercalated cells secrete bicarbonate into urine, and show
a basolateral or bipolar expression of the vacuolar H
+-ATPase and an apical Cl
−/HCO
3−exchanger, possibly
pendrin (SLC6A4) [
35
,
46
,
49
]. Type A cells are found in
the CNT, CCD, OMCD and initial IMCD, whereas
non-type A cells are present only in the CNT and CCD [
25
].
During pre- and postnatal kidney development,
matu-ration of both morphology and functional transport
processes occurs as demonstrated for several ion channels
and proteins involved in electrolyte and acid
–base
trans-port [
6
,
16
,
17
,
18
,
40
,
44
]. In newborns, nephrogenesis is
not complete and plasma HCO
3−is lower than that of
adults [
6
,
11
,
45
]. This is thought to be partly due to renal
tubular immaturity to reabsorb HCO
3−[
11
] or to a state of
relative volume expansion in early life [
45
]. Accordingly,
in rabbit neonates, it has been found that NHE3 activity in
the proximal tubule is one-third of that in adult and no
vacuolar H
+-ATPase activity has been found [
3
,
6
]. After
birth, carbonic anhydrase IV abundance and activity
increase as a prerequisite for urinary acidification in both
the proximal tubule and medullary collecting duct [
39
,
50
]. Similarly, in rats, carbonic anhydrase II in the initial
segment of the proximal tubule and in the CCD and
OMCD increases in parallel during the first weeks of life
[
19
].
During fetal development when intercalated cells (IC)
first appear, the cells in the CCD are not yet fully
differentiated [
20
]. It is thought that type A and non-type
A IC differentiate prenatally from precursor cells both in
the CNT and medullary collecting duct. Using electron
microscopy and morphological criteria, Kim et al. have
shown that in the rat OMCD, there is gradual
disappear-ance of non type-A cells from 1 to 3 weeks after birth [
20
].
To the contrary, the percentage of type-A IC in rat OMCD
increased during the first 3 postnatal weeks [
20
].
The aim of the present study was to investigate the
postnatal mRNA and protein expression levels of several
proteins involved in renal acid
–base transport. In addition,
we examined the localisation and relative abundance of
type A and non-type A IC during the first 3 weeks after
birth in mouse kidney. We focused on expression of
transport proteins in the proximal tubule, the main site of
HCO
3−reabsorption, and in the collecting duct, the site of
fine regulation of final urinary acidification. Three time
points were chosen: 3, 18 and 24 days after birth where 18
and 24 days represent time points when kidney maturation
is thought to be mostly completed but where a further
change in diet occurs during weaning at day 21. Our
results demonstrate the postnatal maturation of several
transport pathways involved in acid
–base transport and
changes in the expression pattern of IC over this period of
time.
Methods
Urine and blood analysis
Male C57BL/6 J mice (3 days, 18 days and 24 days old) were anaesthetised with ketamine–xylazine, and urine and blood was collected. Urine samples were collected from the urinary bladder: pH, creatinine, K+, Na+and Cl−concentrations measured. The pH was measured immediately after collecting urine using a pH microelectrode (PHR-146 Lazar, Lazar, Los Angeles, Calif.) connected to a pH meter (Thermo Orion model 290, Orion, Boston, Mass.), the samples were then diluted 1:1 with deionised water and K+, Na+and Cl−concentrations were measured using a blood-gas analyser (ABL 505, Radiometer, Copenhagen, Denmark). Creati-nine in urine was measured using a commercial creatiCreati-nine kit (Sigma, St. Louis, Mo.). Blood was taken from the vena cava of 18-and 24-day-old mice 18-and blood gases, K+, Na+and Cl− concentra-tions were measured using a blood-gas analyser (ABL 505). Creatinine in serum was measured using an enzymatic kit (Wako, Neuss, Germany). Blood analysis was not performed on 3-day-old mice because of difficulties in obtaining large enough sample volumes.
Real-time PCR
Male C57BL/6 J mice (3 days, 18 days and 24 days) were sacrificed and the kidneys were rapidly removed, frozen and stored at−80°C until further use.
RNA extraction
RNA was extracted from kidney using the RNeasy Microtest Kit (Qiagen, Cologne, Germany). The tissue was thawed in RNALater solution (Ambion, Austin, Tex.). About 10 mg of kidney was homogenised on ice according to manufacturer’s instructions. Quantity and purity of total RNA were assessed by spectrometry and on agarose gels, respectively.
Reverse transcription and PCR
Each RNA sample was diluted to 100 ngμl−1and 1μl was used as the template for reverse transcription using the Taqman Reverse Transcription kit (Applied Biosystems). The thermal cycle condi-tions used were 25°C (10 min), 48°C (30 min) and 95°C (5 min). Primers and probes were designed using Primer Express (Applied Biosystems) and purchased from Microsynth, Switzerland (Table1). The specificity of the primers was tested by conventional PCR using adult mouse kidney RNA. Each pair of primers resulted only in a single band of the expected size (data not shown). Probes were labelled with the reporter dye FAM at the 5′ end and the quencher dye TAMRA at the 3′ end. RT-PCR reactions were performed using Taqman Universal PCR Master Mix (Applied Biosystems). Reaction volumes of 25 μl were prepared using 1 μl of RNA template. Optical reaction plates (96-well) and caps (Applied Biosystems) were used with the Plate type 7700 Single reporter dye. Thermal cycles were set at 50°C (2 min), 95°C (10 min) and then 40 cycles at 95°C (15 s) and 60°C (1 min). Each reaction was carried out in triplicate and the average taken. Only results with less than 1 cycle difference were taken into consideration. Cross-point threshold (Ct
value) was taken as the earliest cycle number in the PCR amplification when fluorescence rises significantly above the background fluorescence. Each gene was quantified using GAPDH as the reference gene.
Data analysis
Data analysis was performed as described previously [33]. For standard curves, serial dilutions of 200 ng μl−1, 100 ng μl−1, 10 ngμl−1, 100 pgμl−1, 10 pgμl−1and 1 pgμl−1of RNA were used for 25μl reactions (in triplicate). Standard curves were calculated for each gene. Average cycle numbers were plotted against log quantity and the slope calculated. The efficiency was calculated using the following equation: efficiency (E)=10(−1/slope). The relative
expression ratio (R) to determine the relative quantification of the
target gene in comparison to the reference gene (GAPDH) was calculated using: R=(Etarget)^ΔCp,target (control−sample)/(Ereference) ^ΔCp,reference(control−sample), where ΔCpis the difference in the cycle number values, Etargetis the efficiency calculated for the gene of interest, Ereference is the efficiency calculated for the reference gene (GAPDH),ΔCpis the deviation of control−sample, control is the result for the gene of interest in adult kidney, sample is the result obtained for the gene of interest in experimental conditions.
Western blot
Male C57BL/6 J mice (3 days, 18 days and 24 days) were sacrificed and the kidneys perfused with sucrose–phosphate buffer (sucrose 140 mM, NaH2PO428 mM, Na2HPO4112 mM; pH 7.4) and rapidly removed. The kidneys were homogenised in ice-cold K-HEPES buffer (200 mM mannitol, 80 mM K-HEPES, 41 mM KOH, pH 7.5) with pepstatin, leupeptin, K-EDTA and PMSF added as protease inhibitors. The samples were homogenised with a sonicator, centrifuged at 1,000 g for 10 min at 4°C and the supernatant saved. Subsequently, the supernatant was centrifuged at 100,000 g for 1 h at 4°C and the resultant pellet resuspended in K-HEPES buffer containing protease inhibitors. After measurement of the total protein concentration (Biorad Protein kit, Richmond, Calif.), 50 µg of crude membrane protein was solubilised in SDS-buffer and loaded on 10% polyacrylamide gels. For some proteins (NHE3) the samples were heated at 80°C for 2 min before loading. The protein was transferred electrophoretically from the gel to PVDF mem-branes (Immobilon-P, Millipore, Bedford, Mass.). Memmem-branes were blocked with 5% milk powder in TBS for 1 h and incubated with primary antibody: rabbit anti-human ATP6V0A4 1:10,000 [48]; rabbit anti-bovine ATP6V1B1 1:1,000, kind gift of K. Finberg, R.
Fig. 1 Urinary pH of 3-, 18- and 24-day-old mice. Values presented as single values and means±SEM Table
1 Primers and probes used for real-time PCR Accession no. Forward primer Reverse primer Probe NHE3 (SLC9A3) AK033564 5′ -CACACCCC GCCCA TCT ACT 5′ -CCAGGCA T ACAGCACTGACA TT 5′ -TGGAGGC GTCTGTCTCA T A TTTCTTGAGGG NBC1 (SLC4A4) XM_132129 5′ -GTGA TTGT GAACAGGAAAGAGCA T 5′ -TGTCAA TG TGGGCAA TGGAG 5′ -ACCTGGA T CTGTTTTGGGTCGCCA T A TP6V0A4 NM_080467 5′ -AGCCAAGC ACCAGAAA TCTCA 5′ -GAGTGGTC ACCCTCCACAGC 5′ -CTGCAGTC TTTCACGA TCCACGAGGA A TP6V1B1 BC017127 5′ -AGGACAGT GTGCAGCGTCAA T 5′ -CCTGAACA A TGGCCTTGGTC 5′ -CCCAGT A T G CTGAGA TTGTCAACTTT ACCCTCC Pendrin (SLC4A4) NM_01 1867 5′ -GCCTTTGGG A T AAGCAACGTC 5′ -AACGA TG GCAACA TCACA 5′ -TGGA TTTT TCTCCTGTTTTGTGGCT ACCACT AE1 (SLC4A1) NM_01 1403 5′ -AGGACCTG GTGTTGCCAGAG 5′ -CGGTT A T G CGCC A TGGA 5′ -ACCTGAGG CTCCGCA TGTC GACT A T ACC GAPDH gi¦193x423¦ 5′ -GTCGTGGA TCTGACGTGCC 5′ -GA TGCCTG CTTCACCACCTT 5′ -CCTGGAGA AACCTGCCAAGT A TGA TGACA T
Lifton, Yale University, USA [13]; rabbit anti-rat pendrin 1:5,000, kind gift of P.S. Aronson, Yale University, USA [24,46]; rabbit anti-human AE1 1:3,000 (Chemicon, Temecula, Calif.); NBC1 1:5,000, kind gift of W. Boron, Yale University, USA; NHE3 1:5,000, kind gift of O. Moe, Dallas, Tex. [9]; and with monoclonal anti-actin 1:2,500 (42 kDa; Sigma) for either 2 h at room temperature or overnight at 4°C. Membranes were washed with TBS–Tween, blocked with 5% milk in TBS–Tween and the secondary antibody (donkey anti-rabbit conjugated to alkaline phosphatase 1:5,000, and sheep anti-mouse conjugated to alkaline phosphatase 1:5,000; Promega, Madison, Wis.) incubated for 1 h. Membranes were again washed. Antibody binding was detected with a chemilumi-nescence substrate kit (CDP-Star, Roche Diagnostics, Indianapolis, Ind.), and than exposed to X-ray film (Kodak). The films were scanned and the intensity of the bands was analysed using Scion Image software and compared to the corresponding actin bands. For the calculation of expression ratios Gauss’ law of error propagation
was used and all results were tested for significance using the unpaired Student’s t-test.
Immunohistochemistry
Male C57BL/6 J mice (3 days, 18 days and 24 days) were anaesthetised with ketamine–xylazine and perfused through the left ventricle with phosphate-buffered saline (PBS) followed by para-formaldehyde–lysine–periodate fixative [29]. Kidneys were re-moved and fixed in PLP overnight at 4°C. Each kidney was sliced into 2–3 pieces, washed with PBS, left in 2.3 M sucrose overnight for cryoprotection and then frozen in liquid nitrogen. Cryosections of 5 µm were cut. Immunostaining was carried out as described [46]. Briefly, slides were rehydrated in PBS for at least 15 min, then incubated with 1% SDS for 5 min, washed three times with PBS and incubated with PBS containing 1% bovine serum albumin for Table 2 Urine and blood
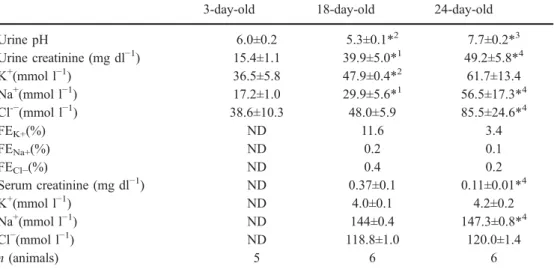
values for 3-, 18- and 24-day-old mice. Values are presented as means±SEM. Urine and ve-nous blood samples were col-lected and analysed immediately
*1P<0.001,*2P<0.05, signifi-cant differences between 3- and 18-day-old mice
*3
P<0.001, *4P<0.05,
signifi-cant differences between 18-and 24-day-old mice
3-day-old 18-day-old 24-day-old
Urine pH 6.0±0.2 5.3±0.1*2 7.7±0.2*3 Urine creatinine (mg dl−1) 15.4±1.1 39.9±5.0*1 49.2±5.8*4 K+(mmol l−1) 36.5±5.8 47.9±0.4*2 61.7±13.4 Na+(mmol l−1) 17.2±1.0 29.9±5.6*1 56.5±17.3*4 Cl-−(mmol l−1) 38.6±10.3 48.0±5.9 85.5±24.6*4 FEK+(%) ND 11.6 3.4 FENa+(%) ND 0.2 0.1 FECl−(%) ND 0.4 0.2 Serum creatinine (mg dl−1) ND 0.37±0.1 0.11±0.01*4 K+(mmol l−1) ND 4.0±0.1 4.2±0.2 Na+(mmol l−1) ND 144±0.4 147.3±0.8*4 Cl−(mmol l−1) ND 118.8±1.0 120.0±1.4 n (animals) 5 6 6
Fig. 2 Relative mRNA abun-dance of NHE3, NBC1, the a4 (ATP6V0A4) and B1
(ATP6V1B1) subunits of the vacuolar H+-ATPase, pendrin and AE1 in kidneys from 3-, 18-and 24-day-old mice. Relative abundance of mRNA was as-sessed by real-time PCR and calculated as described in Methods using GAPDH as ternal reference. Significant in-creases were found for all mRNAs investigated (with the exception of ATP6V1B1) be-tween day 3 and day 18 after birth, whereas no further signif-icant changes were found be-tween day 18 and day 24 after birth. *Significantly different from day 3 (P<0.05)
15 min prior to the primary antibody. The primary antibodies (the same as described for Western blotting) [rabbit anti-pendrin (1:500), rabbit anti-AE1 (1:200), rabbit anti-ATP6V0A4 (1:1,000), rabbit anti-ATP6V1B1 (1:300), NHE3 (1:5,000), NBC1 (1:5,000), goat anti AQP-2 (1:200)] were diluted in PBS (150 mM NaCl, 10 mM KCl, 40 mM NaH2PO4, pH 7.6) and applied for either 75 min at room temperature or overnight at 4°C. Sections were then washed twice for 5 min with hypertonic PBS (PBS+2.7% NaCl), once with PBS, and incubated with the secondary antibodies [donkey anti-rabbit, Alexa 594 (1:1,000) and donkey anti-goat, Alexa 488 (1:400); Molecular Probes, Eugene Ore.], for 1 h at room temperature. Sections were again washed twice with high-NaCl PBS and once with PBS before mounting with VectaMount (Vector Laboratories, Burlingame, Calif.) diluted 1:1 in TRIS–HCl pH 8.9. Sections were viewed with a confocal microscope (Leica SP1 UV CLSM). Pictures were processed and assembled using Adobe Photoshop. Cell counts were performed for pendrin, AE1, ATP6V1B1, ATP6V0A4 and AQP2 on at least ten fields (×400 magnification) per kidney per animal, with three animals for each time point analysed [41, 46]. Care was taken to observe similar regions in all kidneys.
Results
Urine and blood analysis
Urine and blood from 3-, 18- and 24-day-old C57BL/6 J
mice were analysed for pH, K
+, Na
+, Cl
−and creatinine
(Table
2
, Fig.
1
). Urine pH showed a significant
acidification from day 3 to day 18 and alkalinisation at
day 24 after birth. The fractional K
+excretion declined
from day 18 to day 24 (11.6% to 3.4%). The concentration
of electrolytes in serum and the fractional excretion of Cl
−and Na
+were not altered from day 18 to day 24 after birth
(Table
2
).
Changes in relative mRNA abundance of acid
–base
transporters
Real-time PCR was used to assess the relative abundance
of mRNAs of several transport proteins involved in renal
acid
–base transport to monitor developmental adaptation
and maturation. Total RNA was extracted from kidneys of
3- (n=5), 18- (n=5) and 24- (n=4) day-old mice. GAPDH
was taken as the internal reference gene and the ratio
relative to GAPDH and to the expression of the gene of
interest in adult kidney (12 weeks of age) was calculated.
GAPDH mRNA levels did not change significantly
between samples. In general, kidneys from 3-day-old
mice showed lower relative mRNA levels, as compared to
18- and 24-day-old mice. Relative mRNA levels for NHE3
(SLC9A3), NBC1 (SLC4A4), pendrin (SLC26A4) and
AE1 (SLC4A1) were lowest in kidneys from 3-day-old
mice, with an approximately two- to fourfold increase at
day 18 and no further significant increase at day 24
(Fig.
2
). Similarly, relative mRNA levels of two
kidney-specific
subunits
of
the
vacuolar
H
+-ATPase,
a4
(ATP6V0A4) and the IC-specific B1 (ATP6V1B1), were
also increasing from day 3 to day 18 (Fig.
2
).
Changes in protein levels of acid
–base transport
Western blotting was used to assess changes in levels of
acid
–base transporter-related proteins and was expressed
as ratio over actin and normalised against the expression
ratio obtained for day 24. In general, the expressed amount
of all proteins investigated increased in parallel to the
observations made on mRNA levels from day 3 to day 18
(Figs.
3
,
4
). The relative increase was parallel for both
subunits of the vacuolar H
+-ATPase and pendrin.
Expres-sion levels of NHE3 and AE1 did not increase
significantly between day 18 and day 24. Data were not
obtained for NBC1 because of the antibody.
Expression of proximal tubular acid
–base transport
proteins
Kidney sections from 3-, 18- and 24-day-old mice were
stained to examine the localisation of transport proteins. In
general, as an overview, only few proximal tubules in the
cortex stained positive for the acid
–base transporters
Fig. 3 Protein abundance of NHE3, the vacuolar H+-ATPase subunits ATP6V0A4 (a4), ATP6V1B1 (B1), the anion exchanger pendrin, the Cl−/HCO3−exchanger AE1 and actin in kidneys from 3-, 18- and 24-day-old mice. The protein abundance of NHE3, ATP6V0A4, ATP6V1B1, pendrin, AE1 and actin was assessed by Western blot in crude membrane fractions prepared from whole kidneys. A several-fold increase in protein abundance was observed for all transport proteins from day 3 to day 18 after birth. Actin was tested on the same membranes after stripping to control for loading
tested, indicating immaturity at 3 days after birth (data not
shown). In addition, the staining for all transport proteins
also appeared to be weaker at day 3 than at days 18 and
24. In the proximal tubule of 3-day-old mice, there was
very little NHE3 expression found according to the low
expression levels seen by Western blotting (Fig.
5
A). In
contrast, many thick ascending limbs were stained for
NHE3 (data not shown). Similarly, only few proximal
tubules were seen with staining for the a4 vacuolar H
+-ATPase subunit and the basolateral Na
+/HCO
3−cotran-sporter NBC1 (Fig.
5
C, E). Parallel with the increase in
abundance of these proteins as demonstrated by Western
blotting, more proximal tubules positive for NHE3, a4 and
NBC1 were seen in kidneys of 18-day-old mice and the
staining appeared more intensive (Fig.
5
B, D, F). There
was no further major difference noted in kidneys from
24-day-old mice (data not shown).
Abundance of type A and non-type A IC
AE1/AQP2 and pendrin/AQP2 double-stainings were
performed to assess changes in relative abundance and
localisation of principal cells and different types of IC
along the collecting duct. As a result of the difficulty in
distinguishing between the CNT and CCD in kidneys from
3-day-old mice, we analysed CNT and CCD together.
Several observations could be made: (1) the relative
abundance of AQP2 expressing cells in the CCD
decreased between day 3 and day 18 (Table
3
); (2)
AE1-positive cells (type A IC) increased in all segments
between day 3 and day 18 and remained constant between
18- and 24-day-old mice (Table
3
, Fig.
6
); (3) in the
OMCD and IMCD, cells were noted being negative for
both AQP2 and AE1 staining consistent with the
pheno-type of non-pheno-type A IC (Fig.
6
B, D, Table
3
); (4) in the
CCD, the relative abundance of pendrin-positive cells
(non-type A IC) increased between 3- and 18-day-old
mice but remained constant between 18- and 24-day-old
mice (Fig.
7
A, C) and (5) pendrin-positive cells were
found in the OMCD and IMCD in 3-day-old mouse
kidneys and less frequently in 18-day-old kidneys, but not
in 24-day-old kidneys (Table
3
, Fig.
7
B, D). In adult
kidney, pendrin-positive cells were found only in the CNT
and CCD [
35
,
46
,
49
]. The appearance of pendrin-positive
cells in OMCD and IMCD of 3-day-old mouse kidney is
consistent with the finding of AE1- and AQP2-negative
cells in the same segment at this developmental stage.
Subcellular localisation of the a4 and B1 vacuolar H
+-ATPase subunits
Staining of vacuolar H
+-ATPase subunits confirmed the
relative abundance of IC and principal cells as described.
The staining of IC for B1 and a4 was categorised
Fig. 4 Relative changes inprotein expression levels of NHE3, the vacuolar H+-ATPase subunits ATP6V0A4 (a4), ATP6V1B1 (B1), pendrin and AE1 in kidneys from 3-, 18- and 24-day-old mice. Relative changes in protein levels were calculated as a ratio over actin and expressed as percentages of the values obtained for 24 days. *Significantly different from day 3 (P<0.05)
according to their predominant subcellular localisation as
apical, subapical, diffuse, basolateral or bipolar as
described previously (Tables
4
,
5
) [
2
,
41
]. In the CCD,
there was a decrease in the relative abundance of apically
stained IC between 3 and 18 days, which remained
constant between 18- and 24-day-old kidneys. Both
basolateral and bipolar stainings were increased from
day 3 to day 18, and remained unchanged between days 18
and 24 (Fig.
8
A, B). Similar to the expression of pendrin
in IC of the OMCD and IMCD, basolateral staining of a4
and B1 was found in IC in the OMCD and IMCD in 3- and
18-day-old mice, with no staining in 24-day-old mice
(Fig.
8
C
–F, Tables
4
,
5
).
Discussion
After birth the kidney is not completely matured and
excretory and reabsorptive functions are not fully
devel-oped as evident from animal models as well as from
clinical measurements in newborns and infants [
6
,
10
,
11
,
28
,
51
]. In human newborns, small infants and in animal
models (with the exception of rabbits) it was noted that
plasma HCO
3−levels and the renal threshold for HCO
3−are lower [
11
,
38
] and that the renal capacity to excrete
protons and acid-equivalents is only acquired at a later
stage of development [
6
,
7
,
28
]. Accordingly, analysis of
transport processes in whole organisms as well as in
isolated brush border membranes or proximal tubules
showed increases in activity of NHE3 [
4
,
5
,
7
], paralleled
by increases in protein abundance [
4
]. Similar results have
been obtained investigating K
+secretion where renal K
+Fig. 5A–F Expression of the Na+/H+exchanger NHE3, the a4 (ATP6V0A4) vacuolar H+ -ATPase subunit and the Na+/ HCO3−cotransporter NBC1 in the proximal tubule in kidneys from 3- and 18-day-old mice. Only few proximal tubules were found and stained for NHE3, a4 and NBC1 in kidneys from 3-day-old mice, but the number of stained proximal tubules and the intensity of staining increased in kidneys from 18-day-old mice. A, B Na+/H+exchanger isoform 3 (NHE3). C, D a4 Vacuolar H+ -ATPase subunit. E, F Na+/ HCO3−cotransporter (NBC1). G glomerulum, PT proximal tubule, CCD cortical collecting duct. Original magnifications ×400–600
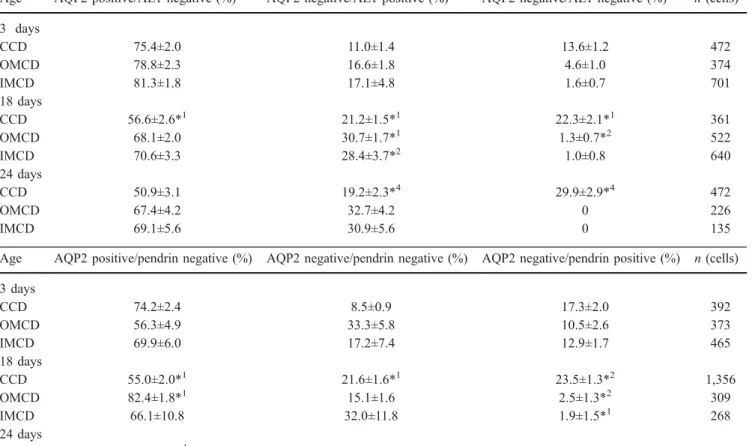
Table 3 Summary of the relative abundance of AE1-, pendrin- and AQP-2-stained cells along the collecting ducts of 3-, 18- and 24-day-old mice. Type A intercalated cells (IC) were identified based on a positive staining for AE1, non-type A IC were identified based
on a positive staining for pendrin, whereas principal cells were identified based on a positive staining for AQP-2. CCD cortical
collecting duct, OMCD outer medullary collecting duct, IMCD inner medullary collecting duct
Age AQP2 positive/AE1 negative (%) AQP2 negative/AE1 positive (%) AQP2 negative/AE1 negative (%) n (cells) 3 days CCD 75.4±2.0 11.0±1.4 13.6±1.2 472 OMCD 78.8±2.3 16.6±1.8 4.6±1.0 374 IMCD 81.3±1.8 17.1±4.8 1.6±0.7 701 18 days CCD 56.6±2.6*1 21.2±1.5*1 22.3±2.1*1 361 OMCD 68.1±2.0 30.7±1.7*1 1.3±0.7*2 522 IMCD 70.6±3.3 28.4±3.7*2 1.0±0.8 640 24 days CCD 50.9±3.1 19.2±2.3*4 29.9±2.9*4 472 OMCD 67.4±4.2 32.7±4.2 0 226 IMCD 69.1±5.6 30.9±5.6 0 135
Age AQP2 positive/pendrin negative (%) AQP2 negative/pendrin negative (%) AQP2 negative/pendrin positive (%) n (cells) 3 days CCD 74.2±2.4 8.5±0.9 17.3±2.0 392 OMCD 56.3±4.9 33.3±5.8 10.5±2.6 373 IMCD 69.9±6.0 17.2±7.4 12.9±1.7 465 18 days CCD 55.0±2.0*1 21.6±1.6*1 23.5±1.3*2 1,356 OMCD 82.4±1.8*1 15.1±1.6 2.5±1.3*2 309 IMCD 66.1±10.8 32.0±11.8 1.9±1.5*1 268 24 days CCD 54.1±2.1*4 18.6±2.2 27.3±1.0 1,154 OMCD 80.8±1.3 19.2±1.3 0 323 IMCD 84.3±4.2 15.8±4.2 0 114
*1P<0.001, *2P<0.05, significant differences between 3- and 18-day-old mice *3P<0.001, *4P<0.05, significant differences between 18- and 24-day-old mice
Table 4 Summary of the relative abundance of IC and principal cells and the subcellular localisation of the B1 vacuolar H+-ATPase subunits along the collecting ducts of 3-, 18- and 24-day-old mice. IC were identified based on a positive staining for B1 (ATP6V1B1)
vacuolar H+-ATPase subunits and being negative for the principal cell (PC)-specific AQP2 water channel. The predominant subcellu-lar localisation of B1 immunostaining was counted within each single IC.
Age IC (%) PC (%) Subapical (%) Apical (%) Basolateral (%) Bipolar (%) Diffuse (%) n (cells) 3 days CCD 37.0±6.9 63.0±6.9 1.8±1.8 59.9±8.0 6.3±6.3 0 32.1±7.9 180 OMCD 28.0±3.6 72.0±3.6 0 60.5±14.1 13.9±9.0 4.2±4.2 21.4±6.7 124 IMCD 29.4±2.7 70.6±2.7 1.8±1.8 78.9±3.5 1.5±1.5 0 17.8±4.9 297 18 days CCD 40.3±2.7 59.7±2.7 3.6±1.3 35.1±3.7* 26.9±4.4* 6.7±2.0* 27.7±3.1 814 OMCD 46.5±16.2 53.5±16.2 16.9±8.7 50.0±4.1 9.8±2.5 3.2±3.2 20.1±3.0 104 IMCD 25.2±4.4 74.8±4.4 4.7±4.7 71.4±10.6 0 1.0±1.0 22.9±8.6 210 24 days CCD 39.9±1.7 60.1±1.7 1.4±1.0 35.2±3.1 18.6±2.9 8.2±1.6 36.7±2.9** 1010 OMCD 31.0±1.9 69.0±1.9 2.4±1.7 51.4±6.2 0** 0 46.2±6.5** 445 IMCD 20.1±1.3 79.9±1.3 1.9±1.9 77.5±5.3 0 0 20.6±3.8 777
*P<0.05, significant difference between 3- and 18-day-old mice **P<0.05, significant difference between 18- and 24-day-old mice
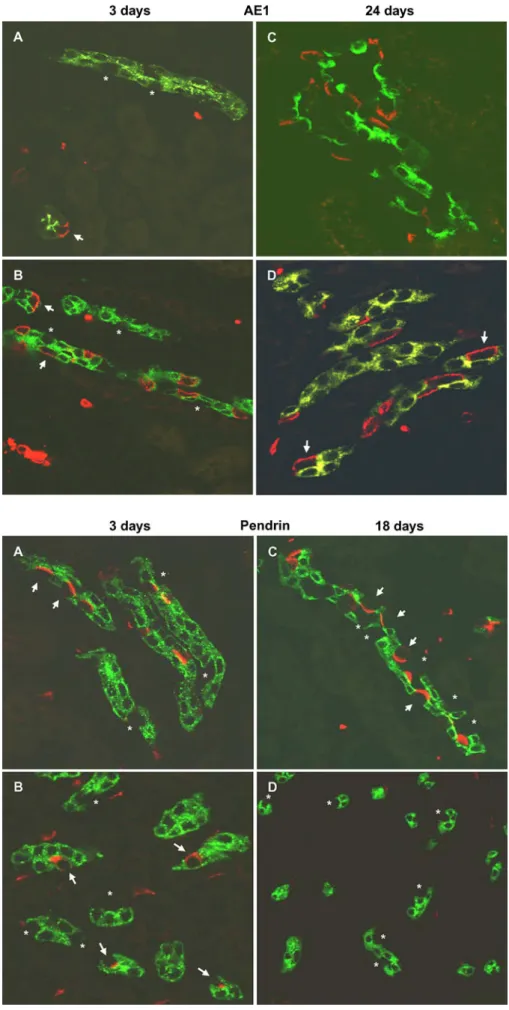
Fig. 6A–D Expression of AE1 in kidneys of 3- and 24-day-old mice. Kidneys were stained for the Cl−/HCO3−exchanger AE1, expressed only in type A inter-calated cells, and AQP2, a marker for principal cells. A, C Only few AE1 positive cells (arrow) were found in the CCD at 3 days but their number increased at 24 days. B, D In the outer medullary collecting duct (OMCD) AE1 and AQP2 nega-tive cells (*) were found in 3-day-old kidneys but not after 24 days after birth, indicating the disappearance of cells with characteristics of non-type A intercalated cells from the OMCD and inner medullary collecting duct (IMCD). Origi-nal magnifications ×400–600
Fig. 7A–D Expression of pendrin in kidneys of 3- and 18-day-old mice. Kidneys were stained for the Cl−/anion ex-changer pendrin, expressed only in non-type A intercalated cells, and AQP2 as a marker for principal cells. A, B Pendrin expression in kidneys from 3-day-old mice showed apical lo-calisation (arrow) in the CCD (A) and also in the OMCD and IMCD (B). Some cells were negative for AQP2 and pendrin staining (*) consistent with the type A intercalated cell pheno-type. C, D In 18-day-old mouse kidney, pendrin staining was seen in the CCD (C) (arrows pendrin, *pendrin- and AQP2-negative cells) similar that re-ported previously [35, 46, 49]. No staining for pendrin was visible in the IMCD (D) or OMCD. Original magnifications ×400–600
secretion increased together with mRNA or protein levels
of ROMK or maxi-K channels [
10
,
51
].
Our results indicate two major processes occurring
mainly between the first two time points investigated, the
increase in mRNA and protein expression levels from 3 to
18 days after birth and changes in the phenotype of IC in
the collecting duct during the same period. The increase in
mRNA and protein levels is paralleled by findings from
other groups showing similar increases for NHE3 [
4
,
40
],
NaPi-IIa [
44
], the maxi-K channel [
51
] and carbonic
anhydrase IV [
50
]. Taken together with the increased
protein levels found for the a4 and B1 vacuolar H
+-ATPase subunits, AE1 and the stronger intensity of NBC1
staining, it appears that there is a co-ordinated increase in
expression of proteins involved in the reabsorption of
bicarbonate and excretion of protons. The increase in
pendrin expression parallels the acquisition of bicarbonate
secretion in the cortical collecting duct [
30
], a process that
is thought to involve pendrin [
35
]. Also, a recent analysis
of changes in global gene expression patterns in
develop-ing and maturatdevelop-ing rat kidney revealed that mRNA levels
of several proteins related to transport functions, such as
SAT-1, all subunits of the Na
+/K
+-ATPase, 4F2hc,
Na/Pi-IIa, NHE3, several members of the organic cation/anion
transporter family, sugar transporters, and the ubiquitous c
(16 kDa) and B2 (58 kDa) subunits of the vacuolar H
+-ATPase, increased during these processes [
42
].
The second process, changes in IC phenotypes in the
collecting duct, also suggests maturation of acid- and
base-secretory functions in this nephron segment important for
final urinary acidification. The total number of IC in the
CCD increased significantly and the phenotype of IC
showed clear alterations. The increase in IC number was
evident only from the numbers presented in Table
3
but
Fig. 8A–F Subcellular local-ization of the a4 (ATP6V0A4) and B1 (ATP6V1B1) subunits of the vacuolar H+-ATPase in intercalated cells of 3- and 24-day-old mouse kidneys. Kid-neys from 3- and 24-day-old mice were stained against AQP2 as a marker for principal cells and against either the interca-lated cell-specific B1 vacuolar H+-ATPase subunit or the a4 subunit expressed along the en-tire nephron. The subcellular distribution of B1 in intercalated cells was similar to a4 at all time points. A At 3 days most intercalated cells in the CCD showed a predominantly apical distribution of the B1 subunit. B In the CCD 24 days after birth, intercalated cells with a distri-bution of B1 subunits to the apical (a) or basolateral (bl) pole or both membranes (bipolar, bp) are found. C, E In the OMCD and IMCD, intercalated cells with a clear basolateral staining (arrows) for the B1 subunit are found 3 days after birth. D, F No intercalated cells with a pronounced basolateral staining for the B1 subunit are seen in the OMCD and IMCD of kid-neys from 24-day-old mice. Original magnifications ×400– 600
not clear from data in Tables
4
and
5
where we had
focused mainly on nephron segments expressing many
cells positive for vacuolar H
+-ATPase staining. Four major
changes could be observed: (1) expression of IC in the
OMCD and IMCD being positive for pendrin or
expres-sing vacuolar H
+-ATPase subunits on the basolateral
membrane disappeared from day 3 to day 24 after birth,
(2) the relative abundance of IC with apical staining of
vacuolar H
+-ATPases in the CCD decreased from day 3 to
day 24 after birth, whereas the number of IC with
basolateral or bipolar staining increased, (3) the number of
IC in the CCD being positive for pendrin increased from
day 3 to day 18 after birth, and (4) the number of
AE1-positive cells in all collecting duct segments also
increased. Taken together these results indicate several
changes in IC function during this period of maturation.
First, there is evidence for the change of the IC phenotype
along the collecting duct with the disappearance of IC
from the OMCD and IMCD with characteristics of
non-type A IC, namely expression of pendrin and basolateral
vacuolar H
+-ATPases. This observation is consistent with
a previous examination of IC phenotype on the basis of
expression of AE1 and vacuolar H
+-ATPase distribution
describing the occurrence and later disappearance of
non-type A IC in rat kidney medulla [
20
]. The availability of
pendrin as a specific marker for non-type A IC confirms
now these previous results. Also the increase in
AE1-positive cells along the collecting duct is in agreement
with a maturation of IC subtypes as described previously
[
15
]. However, our results do not allow us to decide
whether these non-type A IC are removed by apoptosis as
suggested [
21
] or whether these findings may indicate a
conversion of phenotype of IC in the OMCD and IMCD.
Such plasticity between different subtypes of IC and even
more between IC and principal cells has been suggested by
several findings such as depletion from or appearance of
more IC in the medulla in animals with carbonic
anhydrase II [
8
] or AQP1 water channel [
23
] deficiencies,
respectively. Our observations on pendrin expression and
apical localisation of vacuolar H
+-ATPases are also in
agreement with the fact that urinary pH was lower in
younger mice and that other groups have described a
postnatal increase of cells with characteristics of non-type
A IC, i.e. apical binding of peanut-lectin, and maturation
of HCO
3−secretion over the first weeks of life [
30
,
31
,
36
]. The fact that pendrin protein expression and
basolat-eral localisation of vacuolar H
+-ATPases is strongest at
day 24 could also reflect the change in diet from mother
milk to normal mouse chow which has been shown to
provide a strong alkali load [
26
].
In summary, our findings demonstrate the parallel
increase in expression of several transport proteins
important for bicarbonate reabsorption in the proximal
tubule and the fine regulation of final urinary acidification
along the collecting duct. This increase in expression of
transport proteins was paralleled by changes in IC subtype
localisation and phenotype indicating the developmental
disappearance of IC with characteristics of non-type A IC
from the medulla and the full appearance of pendrin or
AE1-positive IC in the CCD as well as acquiring the
subcellular localisation of vacuolar H
+-ATPases in IC as
seen in adult kidney. These changes observed may
underlay the final postnatal maturation of acid
–base
transport by the kidney but require further investigation
to identify mechanisms governing and coordinating these
processes.
Acknowledgement This study was supported by a grant from the Swiss National foundation (31-68318.02) to C.A.W.
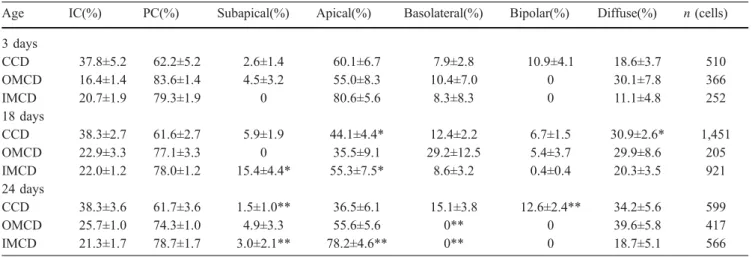
Table 5 Summary of the relative abundance of IC and principal cells and the subcellular localisation of the a4 vacuolar H+-ATPase subunits along the collecting ducts of 3-, 18- and 24-day-old mice. IC were identified based on a positive staining for the a4
(ATP6V0A4) vacuolar H+-ATPase subunits and being negative for the PC-specific AQP2 water channel. The predominant subcellular localisation of a4 immunostaining was counted within each single IC
Age IC(%) PC(%) Subapical(%) Apical(%) Basolateral(%) Bipolar(%) Diffuse(%) n (cells) 3 days CCD 37.8±5.2 62.2±5.2 2.6±1.4 60.1±6.7 7.9±2.8 10.9±4.1 18.6±3.7 510 OMCD 16.4±1.4 83.6±1.4 4.5±3.2 55.0±8.3 10.4±7.0 0 30.1±7.8 366 IMCD 20.7±1.9 79.3±1.9 0 80.6±5.6 8.3±8.3 0 11.1±4.8 252 18 days CCD 38.3±2.7 61.6±2.7 5.9±1.9 44.1±4.4* 12.4±2.2 6.7±1.5 30.9±2.6* 1,451 OMCD 22.9±3.3 77.1±3.3 0 35.5±9.1 29.2±12.5 5.4±3.7 29.9±8.6 205 IMCD 22.0±1.2 78.0±1.2 15.4±4.4* 55.3±7.5* 8.6±3.2 0.4±0.4 20.3±3.5 921 24 days CCD 38.3±3.6 61.7±3.6 1.5±1.0** 36.5±6.1 15.1±3.8 12.6±2.4** 34.2±5.6 599 OMCD 25.7±1.0 74.3±1.0 4.9±3.3 55.6±5.6 0** 0 39.6±5.8 417 IMCD 21.3±1.7 78.7±1.7 3.0±2.1** 78.2±4.6** 0** 0 18.7±5.1 566
*P<0.05, significant difference between 3- and 18-day-old mice **P<0.05, significant difference between 18- and 24-day-old mice
References
1. Alper SL, Natale J, Gluck S, Lodish HF, Brown D (1989) Subtypes of intercalated cells in rat kidney collecting duct defined by antibodies against erythroid band 3 and renal vacuolar H+-ATPase. Proc Natl Acad Sci U S A 86:5429–5433 2. Bastani B, Purcell H, Hemken P, Trigg D, Gluck S (1991) Expression and distribution of renal vacuolar proton-translocat-ing adenosine triphosphatase in response to chronic acid and alkali loads in the rat. J Clin Invest 88:126–136
3. Baum M, Quigley R (1995) Ontogeny of proximal tubule acidification. Kidney Int 48:1697–1704
4. Baum M, Biemesderfer D, Gentry D, Aronson PS (1995) Ontogeny of rabbit renal cortical NHE3 and NHE1: effect of glucocorticoids. Am J Physiol 268: F815–F820
5. Baum M, Dwarakanath V, Alpern RJ, Moe OW (1998) Effects of thyroid hormone on the neonatal renal cortical Na+/H+ antiporter. Kidney Int 53:1254–1258
6. Baum M, Quigley R, Satlin L (2003) Maturational changes in renal tubular transport. Curr Opin Nephrol Hypertens 12:521– 526
7. Beck JC, Lipkowitz MS, Abramson RG (1991) Ontogeny of Na/H antiporter activity in rabbit renal brush border membrane vesicles. J Clin Invest 87:2067–2076
8. Breton S, Alper SL, Gluck SL, Sly WS, Barker JE, Brown D (1995) Depletion of intercalated cells from collecting ducts of carbonic anhydrase II-deficient (CAR2 null) mice. Am J Physiol 269: F761–F774
9. Capasso G, Rizzo M, Pica A, Di Maio FS, Moe OW, Alpern RJ, De Santo NG (2002) Bicarbonate reabsorption and NHE-3 expression: abundance and activity are increased in Henle’s loop of remnant rats. Kidney Int 62:2126–2135
10. Delgado MM, Rohatgi R, Khan S, Holzman IR, Satlin LM (2003) Sodium and potassium clearances by the maturing kidney: clinical-molecular correlates. Pediatr Nephrol 18:759– 767
11. Edelmann CM, Soriano JR, Boichis H, Gruskin AB, Acosta MI (1967) Renal bicarbonate reabsorption and hydrogen ion excretion in normal infants. J Clin Invest 46:1309–1317 12. Emmons C, Kurtz I (1994) Functional characterization of three
intercalated cell subtypes in the rabbit outer cortical collecting duct. J Clin Invest 93:417–423
13. Finberg KE, Wagner CA, Stehberger PA, Geibel JP, Lifton RP (2003) Molecular Cloning and Characterization of Atp6v1b1, the Murine Vacuolar H+-ATPase B1-Subunit. Gene 318:25–34 14. Hamm LL, Alpern RJ (2000) Cellular mechanisms of renal tubular acidification. In: Seldin DW, Giebisch G (eds) The kidney: physiology and pathophysiology, 3rd edn. Lippincott Williams and Wilkins, Philadelphia, pp 1935–1979
15. Holthofer H (1987) Ontogeny of cell type-specific enzyme reactivities in kidney collecting ducts. Pediatr Res 22:504–508 16. Horster M (2000) Embryonic epithelial membrane transporters.
Am J Physiol 279: F982–F996
17. Horster MF, Braun GS, Huber SM (1999) Embryonic renal epithelia: induction, nephrogenesis, and cell differentiation. Physiol Rev 79:1157–1191
18. Huber SM, Braun GS, Segerer S, Veh RW, Horster MF (2000) Metanephrogenic mesenchyme-to-epithelium transition induces profound expression changes of ion channels. Am J Physiol 279: F65–F76
19. Karashima S, Hattori S, Ushijima T, Furuse A, Nakazato H, Matsuda I (1998) Developmental changes in carbonic anhy-drase II in the rat kidney. Pediatr Nephrol 12:263–268 20. Kim J, Tisher CC, Madsen KM (1994) Differentiation of
intercalated cells in developing rat kidney: an immunohisto-chemical study. Am J Physiol 266: F977–F990
21. Kim J, Cha JH, Tisher CC, Madsen KM (1996). Role of apoptotic and nonapoptotic cell death in removal of intercalated cells from developing rat kidney. Am J Physiol 270: F575– F592
22. Kim J, Kim YH, Cha JH, Tisher CC, Madsen KM (1999) Intercalated cell subtypes in connecting tubule and cortical collecting duct of rat and mouse. J Am Soc Nephrol 10:1–12 23. Kim YH, Kim J, Verkman AS, Madsen KM (2003) Increased
expression of H+-ATPase in innermedullary collecting duct of aquaporin-1-deficient mice. Am J Physiol 285:F550–F557 24. Knauf F, Yang CL, Thomson RB, Mentone SA, Giebisch G,
Aronson PS (2001) Identification of a chloride–formate exchanger expressed on the brush border membrane of renal proximal tubule cells. Proc Natl Acad Sci U S A 98:9425–9430 25. Kriz W, Kaissling B (2000) Structural organization of the mammalian kidney. In: Seldin D, Giebisch G (eds) The Kidney: physiology and pathopyhsiology, 3rd edn. Lippincott Williams and Wilkins, Philadelphia, pp 587–654
26. Lin SH, Cheema-Dhadli S, Chayaraks S, Chen CB, Gow-rishankar M, Halperin ML (1998) Physiological disposal of the potential alkali load in diet of the rat: steps to achieve acid–base balance. Am J Physiol 274: F1037–F1044
27. Madsen KM, Clapp WL, Verlander JW (1988) Structure and function of the inner medullary collecting duct. Kidney Int 34:441–454
28. Manz F, Kalhoff H, Remer T (1997) Renal acid excretion in early infancy. Pediatr Nephrol 11:231–243
29. McLean IW, Nakane PK (1974) Periodate–lysine–paraformal-dehyde fixative. A new fixation for immunoelectron microsco-py. J Histochem Cytochem 22:1077–1083
30. Mehrgut FM, Satlin LM, Schwartz GJ (1990) Maturation of HCO3−transport in rabbit collecting duct. Am J Physiol 259: F801–F808
31. Narbaitz R, Vandorpe D, Levine DZ (1991) Differentiation of renal intercalated cells in fetal and postnatal rats. Anat Embryol (Berl) 183:353–361
32. Nielsen S, DiGiovanni SR, Christensen EI, Knepper MA, Harris HW (1993) Cellular and subcellular immunolocalization of vasopressin-regulated water channel in rat kidney. Proc Natl Acad Sci U S A 90:11663–11667
33. Pfaffl MW (2001) A new mathematical model for relative quantification in real-time RT-PCR. Nucleic Acids Res 29:e45 34. Romero MF, Boron WF (1999) Electrogenic Na+/HCO3− cotransporters: cloning and physiology. Annu Rev Physiol 61:699–723
35. Royaux IE, Wall SM, Karniski LP, Everett LA, Suzuki K, Knepper MA, Green ED (2001) Pendrin, encoded by the Pendred syndrome gene, resides in the apical region of renal intercalated cells and mediates bicarbonate secretion. Proc Natl Acad Sci U S A 98:4221–4226
36. Satlin LM, Matsumoto T, Schwartz GJ (1992) Postnatal maturation of rabbit renal collecting duct. III. Peanut lectin-binding intercalated cells. Am J Physiol 262: F199–F208 37. Schuster VL, Fejes-Toth G, Naray-Fejes-Toth A, Gluck S
(1991) Colocalization of H+-ATPase and band 3 anion exchanger in rabbit collecting duct intercalated cells. Am J Physiol 260: F506–F517
38. Schwartz GJ, Evan AP (1983) Development of solute transport in rabbit proximal tubule. I. HCO3− and glucose absorption. Am J Physiol 245: F382–F390
39. Schwartz GJ, Olson J, Kittelberger AM, Matsumoto T, Waheed A, Sly WS (1999) Postnatal development of carbonic anhy-drase IV expression in rabbit kidney. Am J Physiol 276: F510– F520
40. Shah M, Gupta N, Dwarakanath V, Moe OW, Baum M (2000) Ontogeny of Na+/H+ antiporter activity in rat proximal convoluted tubules. Pediatr Res 48:206–210
41. Stehberger P, Schulz N, Finberg KE, Karet FE, Giebisch G, Lifton RP, Geibel JP, Wagner CA (2003) Localization and regulation of the ATP6V0A4 (a4) vacuolar H+-ATPase subunit defective in an inherited form of distal renal tubular acidosis. J Am Soc Nephrol 14:3027–3038
42. Stuart RO, Bush KT, Nigam SK (2001) Changes in global gene expression patterns during development and maturation of the rat kidney. Proc Natl Acad Sci U S A 98:5649–5654
43. Teng-umnuay P, Verlander JW, Yuan W, Tisher CC, Madsen KM (1996) Identification of distinct subpopulations of inter-calated cells in the mouse collecting duct. J Am Soc Nephrol 7:260–274
44. Traebert M, Lotscher M, Aschwanden R, Ritthaler T, Biber J, Murer H, Kaissling B (1999) Distribution of the sodium/ phosphate transporter during postnatal ontogeny of the rat kidney. J Am Soc Nephrol 10:1407–1415
45. Van der Heijden AJ, Guignard JP (1989) Bicarbonate reab-sorption by the kidney of the newborn rabbit. Am J Physiol 256: F29–F34
46. Wagner CA, Finberg KE, Stehberger PA, Lifton RP, Giebisch GH, Aronson PS, Geibel JP (2002) Regulation of the expres-sion of the Cl−/anion exchanger pendrin in mouse kidney by acid–base status. Kidney Int 62:2109–2117
47. Wagner CA, Geibel JP (2002) Acid–base transport in the collecting duct. J Nephrol [Suppl 5]:S112–127
48. Wagner CA, Lukewille U, Valles P, Breton S, Brown D, Giebisch GH, Geibel JP (2003) A rapid enzymatic method for the isolation of defined kidney tubule fragments from mouse. Pflugers Arch 446:623–632
49. Wall SM, Hassell KA, Royaux IE, Green ED, Chang JY, Shipley GL, VerlanderJW (2002) Localization of pendrin in mouse kidney. Am J Physiol 284: F229–F241
50. Winkler CA, Kittelberger AM, Watkins RH, Maniscalco WM, Schwartz GJ (2001) Maturation of carbonic anhydrase IV expression in rabbit kidney. Am J Physiol 280: F895–F903 51. Woda CB, Miyawaki N, Ramalakshmi S, Ramkumar M, Rojas
R, Zavilowitz B, Kleyman TR, Satlin LM (2003) Ontogeny of flow-stimulated potassium secretion in rabbit cortical collecting duct: functional and molecular aspects. Am J Physiol 285: F629–F639