PHARMACOEPIDEMIOLOGY AND PRESCRIPTION
Performance of different data sources in identifying adverse
drug events in hospitalized patients
Marco Egbring&Elmira Far&Alexander Knuth& Malgorzata Roos&Wilhelm Kirch&
Gerd A. Kullak-Ublick
Received: 26 November 2010 / Accepted: 17 February 2011 / Published online: 11 March 2011 # Springer-Verlag 2011
Abstract
Purpose The incidence of adverse drug events (ADE) is an important parameter in determining the quality of medical care. We identified the probability that a specific data source would identify ADEs in patients on the oncology ward, that could be assigned to one substance.
Methods We captured all medical adverse events (AE) from five different data sources. Each AE was determined to be drug-related according to the WHO criteria and classified according to the severity, category, and causality of the ADE.
Results The study recorded 129 patients with 252 hospitalizations over a 5-month period. A total of 3,341 medical events were captured and resulted in 1,121 ADEs. In 122 patients, at least one ADE (95%) was observed. Only 39 hospitalizations were believed not to have an ADE (15%). No ADE was captured by all data sources. The patient record captured 550, the nursing record 569, the laboratory tests 387, the questionnaire 63, and the event monitoring during grand rounds 141 ADEs. Only the nursing record and the laboratory tests had a significantly different probability of observing indicative ADEs.
Conclusion For all AEs reported in the data sources, physicians and nurses were the best source for ADEs. Data sources differed in identifying indicative ADEs and were influenced by specific patient parameters.
Keywords Adverse drug event . Chemotherapy . Oncology . Monitoring . Data sources
Introduction
At the time of drug registration, a comprehensive safety profile is often not available for patients with multiple risk factors [1]. After market authorization, the spontaneous reporting system records serious and unknown adverse drug events (ADE) and enhances the existing safety profile. However, this type of data allows no reliable estimation of the frequency of ADEs [2] because not all ADEs are reported. Epidemiological studies can determine the inci-dence of ADEs and provide further information on causality, preventability, and costs for the health care system. All available data sources have to be monitored and analyzed if all ADEs are to be captured. More data
Marco Egbring and Elmira Far contributed equally to this article. M. Egbring (*)
:
E. Far:
G. A. Kullak-UblickDepartment of Clinical Pharmacology and Toxicology, University Hospital Zurich,
Rämistrasse 100, 8091 Zurich, Switzerland e-mail: [email protected] E. Far e-mail: [email protected] A. Knuth
Department of Oncology, University Hospital Zurich, Rämistrasse 100,
8091 Zurich, Switzerland M. Roos
Biostatistics, ISPM, University Zurich, Hirschengraben 84,
8001 Zurich, Switzerland e-mail: [email protected] W. Kirch
Institute for Clinical Pharmacology, Medical Faculty Carl Gustav Carus, Technical University Dresden, Fiedlerstrasse 27,
01307 Dresden, Germany
sources [3] or better algorithms for detection result in a higher incidence of captured ADEs [4,5].
Variations in the number of data sources, detection methods, and variations in study populations have a major impact on the reported incidence of ADEs [6]. A meta-analysis of Lazarou et al. has been controversially discussed because of the variability within 39 included studies. But this controversy can not cloud the fact that ADEs ranked as the fourth to sixth leading cause of death in the U.S. [7]. A prospective cohort study in Switzerland reported clinically relevant ADEs in 11% of all hospitalizations on the internal ward [8], but the patients with chemotherapy had a higher incidence due to the cytotoxic properties and low therapeutic range of the agents. Additional risk factors include morbidity, sex, age, unknown co-medication, and noncompliance [9–11]. Even the reported risk in a seemingly homoge-neous population on the oncology ward ranges from 5.0 and 74.3% [12, 13]. Common ADEs caused by chemo-therapy are hematological problems, opportunistic infec-tions, signs of cardiac toxicity, nausea or vomiting, skin reactions, stomatitis, alopecia, fatigue, constipation, and diarrhea [13,14]. A portion of these ADEs are preventable [13, 14], though published protocols differ in dosage, duration of treatment, and applied cycles. Ambiguous information in the literature concerning the correct administration of the drugs can impair reproducibility [15] and reduce the effectiveness of therapy, which results in increased hospital days and reduced life span [16]. Additional hospital days add major costs to the health care system [17]. A British study estimated additional costs of about 706 million EUR per year for the National Health Service with a 6.5% incidence of ADEs [18]. The U.S. estimated extra costs total $17 billion to $29 billion per year [19]. These extra costs may be reduced by supportive therapy or improved monitoring of ADEs [20]. Avoiding ADEs has great potential. A British study defined 72% of the ADEs as preventable [18].
We monitored the ADEs of hospitalized patients in two oncology wards of the University Hospital Zurich over a period of 5 months (April through September 2008) and determined the probability that a specific data source would identify an indicative ADE in the hospitalized patient and whether patient-specific parameters were relevant.
Methods Study population
We monitored the ADE of hospitalized patients on two oncology wards over a period of 5 months (April through September 2008) and calculated the probability that a specific data source would identify an indicative ADE.
Ethics approvals (EK-1488) for this study were obtained from the Clinical Research and Ethics Committee at the University Hospital Zurich and University of Zurich. We included all inpatients who were 18 years or older at the time of admission to the oncology wards “G-West” and “H-West” of the University Hospital Zurich between April and September 2008 and signed the informed consent. We did not exclude any patients.
Adverse drug event
According to the WHO an adverse event (AE) is defined as “any untoward medical occurrence that may present during treatment with a pharmaceutical product but which does not necessarily have causal relationship with this treatment” and an adverse drug reaction (ADR) as “any noxious, unintended and undesired effect of a drug that occurs at doses used in humans for prophylaxis, diagnosis or therapy of disease or for the modification of physiologic function.” ADRs and AEs due to medication errors are defined as ADEs or any “injury resulting from medical intervention related to a drug” [21]. Therefore ADEs also include errors in administration, non-compliance, therapeutic failures, and accidental poisoning.
Causality
The causality assessment was based on the classification of the WHO Uppsala Monitoring Centre and comprised the categories“certain,” “probable,” “possible,” “unlikely,” “con-ditional/unclassified,” and “other.” The temporal relationship of the use of the drug, the plausibility, and the likelihood of alternative causes was taken into account in the identification of an ADE. In this study, the causality terms “unlikely,” “conditional/unclassified,” and “unassessable/unclassifiable” were grouped under the term“unlikely” (Fig.1). The study physician collected all AEs and assessed the causality and severity after data closure. The investigator reviewed the cases. Special or complicated cases were discussed, and resolutions were reached unanimously. An ADE was considered an indicative ADE if the causality was probable or certain and the ADE could be assigned specifically to one substance.
Severity
The classification of the severity is derived from the Common Terminology Criteria for Adverse Events v3.0 (CTCAE) and includes five grades (grade 1: mild AE; grade 2: moderate AE; grade 3: severe AE; grade 4: life-threatening or disabling AE; and grade 5: death related to AE) [22]. Grades 3 to 5 of the CTCAE correspond to the definition of a serious ADE by the WHO (results in death,
requires inpatient hospitalization or prolongation of existing hospitalization, results in persistent or significant disability/ incapacity, life-threatening). The CTCAE lists the possible AEs that may occur during chemotherapy. The AEs of the CTCAE are derived from the MedDRA terminology (Medical Dictionary For Regulatory Activities), which in turn integrates
the terminology of the WHO-ART (WHO – Adverse
Reactions Terminology). The MedDRA terminology is currently accepted by the European Union, the U.S., and Japan for the reporting of AEs.
Data sources
Medical events were collected regardless of possible relationships to a potential drug treatment to ensure the detection of a large number of ADEs that were not initially detected and incorrectly, unwittingly, or spontaneously attributed to a different cause.
Monitoring on the ward round
All AEs that were communicated verbally by the medical staff at the regular ward rounds were written down by the accompanying study physician on a data entry form. These AEs were recorded in order to detect possible ADEs that
were not declared as such in writing in the medical documentation, due to falsely assumed lack of relevance. Manual review of medical records
All AEs from the paper-based medical documentation of the patients were copied. The medical documentation consisted of the medical report, medical history, lab results, consultations, nursing report, and patient charts. The nursing documentation provided the necessary additional information on the entire medication, including time and date of administration and dosage.
Laboratory values
Values above or below the normal range (reference values from the University Hospital Zurich) were documented as an AE by the study physician after monitoring all lab values. Values outside the normal range with no pathological meaning were not considered as an AE.
Patient questionnaire
Each patient hospitalized on the oncology ward received a questionnaire after signing the informed consent that
Temporal relationship? Adverse event and
substance
ADE unlikely ADE possible ADE probable ADE certain Dechallenge? Alternative cause? Rechallenge? Known ADE? Alternative cause? Plausible mechanism? Alternative cause? No Yes Yes Yes Yes Yes Yes Yes Yes No No No No No No No
Fig. 1 Flowchart visualizing the algorithm for rating the causality of a drug based on the WHO classification
inquired about possible co-medications, use of phytotherapy, consumptions of fruit juices, and the current general condition. The morbidity was rated according to the Karnofsky index. The patient received an additional questionnaire from the study physician at each following hospitalization regarding any AEs experienced at home prior to the current hospitalization. The questionnaire was designed to be a sensitive surrogate parameter in case many patients were discharged from the hospital before the onset of ADEs.
Statistical methods Data collection
The data were recorded in a Microsoft Access 2003 database. Relevant patient data, such as laboratory values or medical documentation, were imported into the database. Paper-based patient data, such as questionnaires or inpatient medical records and patient charts, were copied and archived. All recorded AEs in the observation period were documented. For the mapping of data in the database, patients were linked relationally to the hospitalizations, and the hospitalizations to the AE in a“1−n” relationship. Data analysis
We performed queries within the database and extracted data into Excel spreadsheets. We used Talend Open Studio (version 3.04) to extract, transform, and analyze the data with SPSS. For descriptive statistics, transformation of skewed distribution and linear regression, we applied SPSS (version 17.02), and for the control of clustering at the patient level, we used STATA (version 10). For all analyses, a P-value <0.05 was considered to be significant.
Descriptive statistics
The patient population was described according to patient characteristics, number of hospitalizations, and the ADE-related hospitalizations, as well as reasons for hospitalization excluding chemotherapy. Diagnoses were grouped by organ systems, and medical therapy was described by a descending list of the total treatment days of each chemotherapeutic agent with a cumulative 90% cut off (DU90) [23]. ADEs were classified according to organ systems, causality, and severity. The predictability of ADEs was listed in a frequency table. Descriptive patient characteristics (BMI, age, general condition, hospital stay, and number of drugs) were evaluated with mean, standard deviation (SD), median, first quartile (Q1), third quartile (Q3), and interquartile range (IQR). Patient characteristics and the diagnosis groups were analyzed according to the frequency and causality of ADEs.
Medication was evaluated according to drug utilization and causality of the ADEs. The expected (calculated) values were compared with the observed values (frequencies). The significance was calculated by using a chi-squared test. Regression analysis
We assessed the performance of the data sources with respect to detection of ADEs in relation to the binary target variable “possible ADE detected” and “certain or probable ADE detected” using logistic regression and the associated odds ratio (OR) with its 95% confidence interval (CI). The results were shown in tables. A Venn diagram illustrates the overlap of ADEs for the categories “patient record,” “laboratory,” and “nursing record.” Next, we noted whether patient characteristics influenced the performance of the data sources. We used univariate regression and defined the data sources“patient record,” “nursing report,” “laboratory,” “monitoring,” and “questionnaire” as the dependent variable and the patient characteristics [gender, BMI, chemo-naive, general condition, log(hospitalization), number of drugs, chemotherapy (yes/no), number of ADEs, severity, causality, ADE-related hospitalization, diagnosis of malignancy, and category of ADE by organ system] as the independent variable. After finding the optimal model for the univariate logistic regression, we used STATA to correct for clustering. The duration of hospital stay was transformed using the logarithmic function due to a skewed distribution. We developed the optimal model using Enter, Forward, and Backward proce-dures for every dependent variable. The discriminator of the multiple logistic regressions was expressed with ROC curves and with the AUC (area under the ROC curve).
We corrected the clustering for different numbers of hospitalizations per patient with the procedure “logit” and the option “vce” (Cluster) in STATA. The bivariate Spearman’s correlation was tested if the covariates of the optimal model correlated with each other.
Results
During the observation period, 81 male and 48 female patients were monitored during 252 hospital admissions. The median (Q1, Q3) age was 57 (44, 63) years and the median BMI 23.6 (20.8, 26.6). The median Karnofsky index was 80 (70, 80) and the median duration of hospitalization 5 (3, 8) days. Seventy-two patients were recorded with a single hospitalization (n= 72) and 57 patients with multiple hospitalizations (n=180). The median number of all substances per hospitalization was 10 (8, 14) consisting of 2 (2,3) chemotherapeutic, 3 (3,4) supportive, and 4 (2,8) concomitant agents. Chemotherapy was not administered in 39 hospitalizations.
The admission of the patient was due to an ADE in 14 cases, palliative therapy in 4 cases, further medical examina-tions in 6 cases, stem cell apheresis in 7 cases, and other reasons in 8 cases. Forty-three of the 129 patients received a cytotoxic drug for the first time and were labelled “chemo-naive.” Sixty-eight patients had already been under treatment and were labelled “chemo-experienced.” A total of 129 patients refused or were not able to give informed consent. A total of 25 hospitalizations (9.2% of all hospitalizations) were ADE-related. In some cases, the scheduled chemo-therapy could be continued in these hospitalizations due to the improved general condition of the patient. The most frequent cause of an admission was a severe ADE from the category gastrointestinal symptoms or infectious diseases. Most common sites of malignancy were the lymphatic system (27%), lung (23%), and gastrointestinal system (13%). Other groups were head/neck (9%), CNS (6%), urology (6%), hematology (6%), sarcoma (4%), breast (4%) and other (2%). The applied 214 substances consisted of 42 chemotherapeutic agents, 14 supportive agents, and 158 concomitant substances. Besides the chemotherapeutic agents, only morphine and dexamethasone
had a frequent use. Of the chemotherapeutic agents, a mere 18 substances contributed to more than 90% of treatment days. Adverse drug events
A total of 3,341 AEs were recorded and 1,121 distinct ADEs were identified in all data sources. Most ADEs were mild in severity (67%) or rated with causality “possible” (68%). Only one-third of the ADEs were assessed with causality“probable” or “certain” and were rated indicative
Gastrointestinal ADE - Category 30.33% Metabolic/Laboratory Infection Haematological Gastrointestinal 30.33% 11.24% 11.33% 21.68% Nervous system Cardiovascular Metabolic/Laboratory Infection Haematological Gastrointestinal 30.33% 6.07% 11.24% 11.33% 21.68% 5.44% Dermatology/Skin Constitutional symptoms Nervous system Cardiovascular Metabolic/Laboratory Infection Haematological Gastrointestinal mild moderate 30.33% 6.07% 11.24% 11.33% 21.68% 3.75% 5.26% 5.44% Pulmonary/Upper Respiratory Miscellaneous Special senses Dermatology/Skin Constitutional symptoms Nervous system Cardiovascular Metabolic/Laboratory Infection Haematological Gastrointestinal mild moderate severe life-threatening death 30.33% 6.07% 11.24% 11.33% 21.68% 0.89% 1.69% 1.69% 3.75% 5.26% 5.44% 0 50 100 150 200 250 300 350 Renal/Genitourinary Pulmonary/Upper Respiratory Miscellaneous Special senses Dermatology/Skin Constitutional symptoms Nervous system Cardiovascular Metabolic/Laboratory Infection Haematological Gastrointestinal mild moderate severe life-threatening death 30.33% 6.07% 11.24% 11.33% 21.68% 0.89% 1.69% 1.69% 3.75% 5.26% 5.44% 0.62% Renal/Genitourinary Pulmonary/Upper Respiratory Miscellaneous Special senses Dermatology/Skin Constitutional symptoms Nervous system Cardiovascular Metabolic/Laboratory Infection Haematological Gastrointestinal Number of ADE (n = 1121) mild moderate severe life-threatening death 30.33% 6.07% 11.24% 11.33% 21.68% 0.89% 1.69% 1.69% 3.75% 5.26% 5.44% 0.62%
Fig. 2 Percentage of ADEs for each ADE category. Each category is subdivided according to the severity rating of the ADE
Table 1 Characteristics of patients with ADE
Parameter Median IQR Mean SD Missing BMI 4.23 9.4 24 4.3 4 Age (years) 59 13 53.8 2.14 0 Karnofsky index 70 10 75.1 4.14 92 Hospital stay (days) 13.0 20 4.18 19.0 0 All drugs (n) 15.0 13 17.0 9.0 0 IQR Interquartile range, SD standard deviation, BMI body mass index, n number
ADEs. Only 0.4% of ADEs were assessed“certain” after de-and re-challenge. The ADEs were mostly predictable de-and well-known for the substance. Uncommon types of reactions included a morphine-withdrawal syndrome and two cases of allergic reactions. The disease was the underlying cause in 2,220 AEs. The median number of ADEs was 3 (1, 5) ADEs per hospitalization and 6 (3, 13) per patient (irrespective of the number of hospitalizations). No ADEs were seen in 39 hospitalizations. A total of 122 of 129 patients experienced at least one ADE. The most common ADEs were gastrointes-tinal and hematological ADEs (Fig.2).
Patient characteristics of ADEs are shown in Table 1. The characteristics female gender and “chemo-naive” occurred in 38 and 14% of ADEs, respectively.
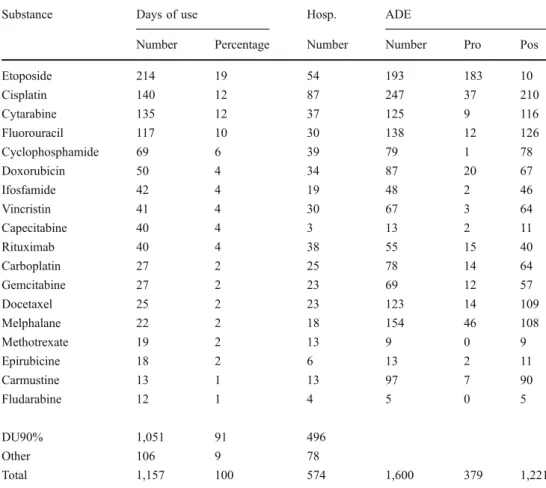
Of the 214 different substances, 112 substances (2,207 products) caused ADEs. Thirty-two substances were respon-sible for 91% of ADEs and the remaining 80 substances caused the remaining 9% of ADE. One ADE could be caused by more than one substance. The chemotherapeutic agents, which caused 73% of ADEs, are listed in Table2.
Performance of data sources
The data sources “patient record,” “nursing record,” “laboratory,” “monitoring,” and “questionnaires” were compared according to their ability to capture indicative
ADEs. The three major data sources that captured most of the ADEs are shown in Fig.3. The data sources“questionnaires” and “monitoring” captured only 34 additional ADEs. Of these ADEs the “questionnaires” captured 23 of 87 and
Substance Days of use Hosp. ADE
Number Percentage Number Number Pro Pos
Etoposide 214 19 54 193 183 10 Cisplatin 140 12 87 247 37 210 Cytarabine 135 12 37 125 9 116 Fluorouracil 117 10 30 138 12 126 Cyclophosphamide 69 6 39 79 1 78 Doxorubicin 50 4 34 87 20 67 Ifosfamide 42 4 19 48 2 46 Vincristin 41 4 30 67 3 64 Capecitabine 40 4 3 13 2 11 Rituximab 40 4 38 55 15 40 Carboplatin 27 2 25 78 14 64 Gemcitabine 27 2 23 69 12 57 Docetaxel 25 2 23 123 14 109 Melphalane 22 2 18 154 46 108 Methotrexate 19 2 13 9 0 9 Epirubicine 18 2 6 13 2 11 Carmustine 13 1 13 97 7 90 Fludarabine 12 1 4 5 0 5 DU90% 1,051 91 496 Other 106 9 78 Total 1,157 100 574 1,600 379 1,221 Table 2 Utilization of chemotherapy agents
Pro Probable, Pos possible, n number, Hosp hospitalization
254
Nursing care record (n=569) Patient medical record (n=550) Laboratory (n=387) 255 191 35 25 69 258
Fig. 3 Venn diagram with the best performing data sources. If an ADE was captured by more than one data source, the count is displayed at the intersections. The three data sources captured 1,087 distinct ADEs from a total of 1,121 distinct ADEs
“monitoring” 10 of 152 alone. Only one ADE was captured by both sources simultaneously. No ADE was captured by all data sources.
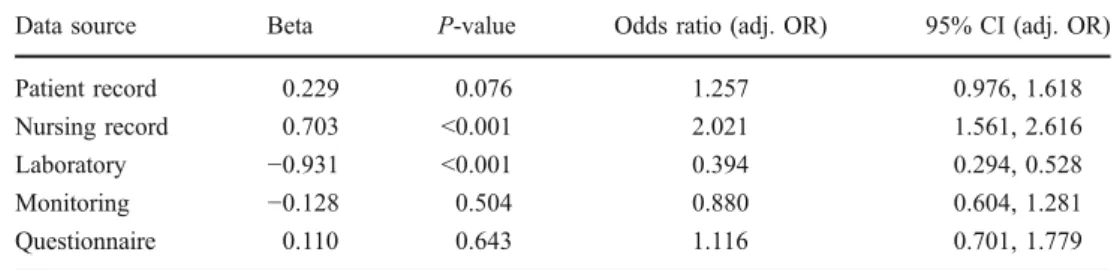
Relevant for the performance is the sensitivity and specificity of the data sources, which were tested using a cross table and logistic regression. Of 1,121 ADEs, only 353 (32%) had the causality “probable” or “certain” and were considered relevant information. The“nursing record” alone captured 31% of the indicative ADEs, which was significantly higher than expected. We calculated 80 indicative ADEs and observed 109. In contrast, we calculated 81 indicative ADEs for the “laboratory,” but observed 41. The “patient record” closely matched the calculated values with expected 60 and observed 65 ADEs, and the data sources “monitoring” and “questionnaire” exactly matched the calculated numbers. We confirmed the findings with logistic regression, and results are shown in Table 3. “Laboratory” shows a negative influence on the capturing of indicative ADEs with beta −0.9, OR 0.394, and P-value<0.001. The “nursing record” increased the probability of capturing indicative ADEs with beta 0.7 and OR 2. The other data sources were not significantly better or worse at capturing indicative ADEs.
Patient characteristics also influenced the performance of the data sources. In order to identify the respective patient parameter for the groups “neoplasm diagnosis” and “ADE category,” we defined a baseline using the most common
parameters“lymphoma” and “gastrointestinal,” respectively. Patient parameters that were found to have a statistically significant influence on the performance of the data sources are shown in Tables4,5, and6.
Discussion
Many studies [7,8,17,18] have reported on the incidence and category of ADEs. In order to be comparable, we also report the standard evaluation and analysis of ADEs and drugs. Detailed information [12, 15, 16] on ADEs in oncology has been rarely published. Our study focuses primarily on the performance of different data sources in capturing ADEs, similarly to the study of Classen [4]. In addition we also took the influence of the patient’s specific parameters on the performance of data sources into account and calculated the probability of each data source to detect indicative ADEs.
In oncology the delayed appearance of ADEs is a problem. Some ADEs only occur after discharge [24], and the questionnaires captured the interval between hospitalizations. We did not expect added value during hospital stay, but our results support the conclusion of Basch and Weingart, who proposed regular patient diaries as an important additional data source in patients with chemotherapeutic therapy [25]. However, the use of questionnaires for patients with a
Data source Beta P-value Odds ratio (adj. OR) 95% CI (adj. OR) Patient record 0.229 0.076 1.257 0.976, 1.618 Nursing record 0.703 <0.001 2.021 1.561, 2.616 Laboratory −0.931 <0.001 0.394 0.294, 0.528 Monitoring −0.128 0.504 0.880 0.604, 1.281 Questionnaire 0.110 0.643 1.116 0.701, 1.779 Table 3 Multiple logistic
regression of the performance of the data sources
Adj. OR Adjusted odds ratio, 95% CI 95% confidence interval
Parameter Beta P-value Adj. OR 95% CI (adj. OR) Log(hospital stay) 0.215 0.014 1.239 1.044, 1.472 Severity of ADE 0.490 <0.001 1.632 1.329, 2.005 Cause of hospitalization 1.829 0.004 1.803 1.802, 21.536 Neoplasm diagnosis 0.767 0.06 2.154 0.967, 4.796 Gastrointestinal −0.275 0.634 0.759 0.244, 2.358 Head/neck 0.841 0.085 2.320 0.890, 6.043 Pulmonary 0.169 0.691 1.185 0.514, 2.728 ADE category −0.859 0.017 0.423 0.220, 0.856 Dermatology 0.279 0.572 1.321 0.503, 3.469 Hematology −2.248 < 0.001 0.106 0.049, 0.225 Metabolic −2.054 < 0.001 0.128 0.054, 0.303 Special senses 0.706 0.341 2.026 0.474, 8.654 Table 4 Multiple logistic
regression of optimal model “patient record” with ADEs (n=1,025)
Adj. OR Adjusted odds ratio, 95% CI 95%
potentially fatal disease can confer a high psychological burden. Fattinger et al. [8] reported at least one clinically relevant ADE in one-third of all hospitalizations with chemotherapy. In this study, ADEs were found in 213 (85%) hospitalizations. Chemotherapeutic agents caused 889 (79%), concomitant therapy 223 (20%), and supportive therapy 95 (8%) of the total of 1,121 ADEs. Cisplatin was a common chemotherapeutic agent and caused most of the ADEs as listed in Table2. Dexamethasone from the group of supportive therapy and morphine from the group of concomitant therapy caused the most ADEs in the respective subgroups. The incidence of ADEs was not normalized for the prescription frequencies.
The performance of data sources is hampered by the missing use of standards and the lack of discrimination between relevant and irrelevant information. The heteroge-neity of data collection and nonstandardized assessment methods in previous studies interfere with the extraction of relevant information [6].
In previous studies in oncology the incidence of ADEs has ranged widely from 5.0 to 74.3%, depending on the patients and methods used [12–14]. We captured at least one ADE in more than 95% of the patients but found indicative information in only 30% of the ADEs. We
observed the causality“certain” in only 0.4% of the ADEs. The low result is explained by the missing re-challenge in daily clinical practice, which is only feasible if no alternative therapy is available. We did not discover any yet unknown ADEs. In order to capture the maximum number of ADEs, all data sources have to be considered [3]. No one data source detected all 1,121 ADEs in our study. Even the most sensitive data sources“patient record” and “nursing record” captured only 49 and 51% of all ADEs, respectively. Therefore no data sources can be omitted because each has unique information. “Patient record,” “nursing record,” and “laboratory” captured 1,087 of 1,121 ADEs, but captured only 35 concurrent ADEs. In addition the data sources each provided a different degree of structured information. The “nursing record” has a large amount of detailed free text as compared to the “patient record,” which contains a very succinct summary of the information. The“laboratory” is structured, but values were considered as an ADE if outside the normal range and were not adapted to the special clinical situation in chemotherapy. “Monitoring” on ward rounds provided added value but was limited by the fact that the data also occurred in the“patient record.” On the ward many mild to moderate expected and known ADEs were not specifically mentioned. Observations
Parameter Beta P-value Adj. OR 95% CI (adj. OR) Log(hospital stay) 0.513 0.001 1.670 1.251, 2.230 No. of drugs 0.047 0.018 1.048 1.008, 1.089 No. of ADE −0.048 0.006 0.953 0.922, 0.986 Indicative ADE 0.565 <0.001 1.760 1.322, 2.343 ADE category 0.455 0.119 1.576 0.889, 2.795 Dermatology −0.517 0.229 0.596 0.257, 1.385 Hematology −2.044 <0.001 0.130 0.063, 0.264 Infection −1.286 <0.001 0.276 0.145, 0.528 Metabolic −3.204 <0.001 0.041 0.018, 0.090 Nervous system −0.277 0.492 0.758 0.345, 1.669 Renal −3.058 0.002 0.047 0.007, 0.328 Special senses −1.877 0.005 0.153 0.041, 0.574 Table 5 Multiple logistic
regression of optimal model “nursing record” with ADEs (n=1,121)
Adj. OR Adjusted odds ratio, 95% CI 95% confidence interval
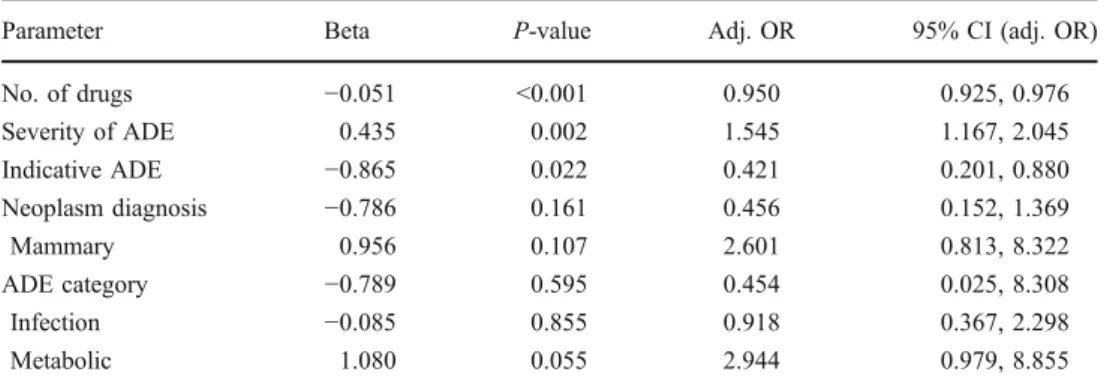
Parameter Beta P-value Adj. OR 95% CI (adj. OR) No. of drugs −0.051 <0.001 0.950 0.925, 0.976 Severity of ADE 0.435 0.002 1.545 1.167, 2.045 Indicative ADE −0.865 0.022 0.421 0.201, 0.880 Neoplasm diagnosis −0.786 0.161 0.456 0.152, 1.369 Mammary 0.956 0.107 2.601 0.813, 8.322 ADE category −0.789 0.595 0.454 0.025, 8.308 Infection −0.085 0.855 0.918 0.367, 2.298 Metabolic 1.080 0.055 2.944 0.979, 8.855 Table 6 Multiple logistic
regression of optimal model “laboratory” with ADE (n=1,121)
Adj. OR Adjusted odds ratio, 95% CI 95% confidence interval
by the investigator were discarded in order not to bias the study results. For example, alopecia was regularly observed by the investigator but was not mentioned in any data sources, since it had no bearings on clinical practice.
The patient characteristics play an important role in capturing ADEs. The“patient record” captured more ADEs if the patient stayed longer in the hospital, experienced a serious ADE, or if the admission was ADE-related. ADEs in the categories “hematology” and “metabolic” were not well perceived because the ADEs often did not require medical action (Table4). The “nursing record” was more influenced by patient parameters. If a patient had a longer “duration of hospitalization,” a higher “number of drugs,” or previous ADEs with causality “probable” and “certain” the next ADE was more likely to be captured. Complex patients were more closely supervised by the nurses. A negative impact on the capturing of ADEs in the“nursing record” was seen with a high number of previous ADEs in this patient or with an ADE from the categories“hematology,” “infectiology,” “metabolic,” “renal,” or “special senses” (Table5). The“laboratory” primarily captured serious ADEs. If a patient had serious nausea and vomiting for several days, the imbalance of electrolytes became evident in the lab. Therefore lab examinations contained more relevant infor-mation if a clinical problem preceded. The “monitoring” captured more ADEs if a patient was older, stayed longer in the hospital, or was admitted due to an ADE. This closely resembled the patient characteristics of the“patient record.” If the patient had never received chemotherapy before, the probability that a physician recorded the ADE was reduced. The“questionnaire” captured ADEs in patients, particular if the patient had a previous chemotherapy, presented a serious ADE, or was hospitalized due to an ADE. Experiencing an ADE raised the awareness of the patient. A negative relationship was seen with the characteristics“chemo-naive” and “duration of hospitalization.” Apparently the patient seemed less sensitive to perceiving an ADE before chemo-therapy but also seemed to tolerate ADEs better in a prolonged hospital stay. The questionnaires should have been issued on a daily basis and not at the beginning of the hospitalization.
Conclusions
The occurrence of ADEs has to be detected and managed to achieve high quality care. Therefore an efficient method to capture ADEs is required. The more data sources are used, the greater the incidence of captured ADEs. For all AEs reported in the data sources, physicians and nurses are the best source for ADEs in the oncology ward. Data sources perform differently at identifying indicative ADEs and are influenced by specific patient parameters. According to our
study the“nursing record” is an important source for ADEs and for indicative ADEs. The “patient record” is a valuable source for serious ADEs and ADEs in complex patients. The “questionnaire” may have additional infor-mation but should be issued on a daily basis. Other data sources such as “laboratory” or electronic information systems alone are unlikely to discover additional infor-mation. We provide a rational approach towards identi-fying the patient’s adverse events that can be assigned specifically to one cause. The approach should reduce the clinical complexity of multiple adverse events in patients with chemotherapy.
References
1. Ahmad SR (2003) Adverse drug event monitoring at the Food and Drug Administration. J Gen Intern Med 18(1):57–60
2. Cullen DJ et al (1995) Incident reporting system does not detect adverse drug events The: a problem for quality improvement. Jt Comm J Qual Improv 21(10):541–548
3. Olsen S et al (2007) Hospital staff should use more than one method to detect adverse events and potential adverse events: incident reporting, pharmacist surveillance and local real-time record review may all have a place. Qual Saf Healtch Care 16 (1):40–44
4. drug events in hospital patients. Qual Saf Health Care 14:221–226 5. Rozich JD, Haraden CR, Resar RK (2003) Adverse drug event
trigger tool: a practical methodology for measuring medication related harm. Qual Saf Health Care 12(3):194–200
6. Kvasz M et al (2000) Adverse drug reactions in hospitalized patients: a critique of a meta-analysis. MedGenMed 2(2):E3 7. Lazarou J, Pomeranz BH, Corey PN (1998) Incidence of adverse
drug reactions in hospitalized patients: a meta-analysis of prospective studies. JAMA 279(15):1200–1205
8. Fattinger K et al (2000) Epidemiology of drug exposure and adverse drug reactions in two Swiss departments of internal medicine. Br J Clin Pharmacol 49(2):158–167
9. Evans RS et al (2005) Risk factors for adverse drug events: a 10-year analysis. Ann Pharmacother 39(7–8):1161–1168
10. Rieger K et al (2004) High prevalence of unknown co-medication in hospitalized patients. Eur J Clin Pharmacol 60 (5):363–368
11. Meijerman I, Beijnen JH, Schellens JH (2006) Herb-drug interactions in oncology: focus on mechanisms of induction. Oncologist 11(7):742–752
12. Lapeyre-Mestre M et al (1997) Incidence and cost of adverse drug reactions in a French cancer institute. Eur J Clin Pharmacol 53 (1):19–22
13. Lau PM, Stewart K, Dooley M (2004) The ten most common adverse drug reactions (ADRs) in patients oncology: do they matter to you? Support Care Cancer 12(9):626–633
14. Poole SG, Dooley MJ (2000) Establishing a baseline incidence of adverse drug reactions in hospitalized oncology patients. J Oncol Pharm Pract 6(2):55–59
15. Dooley M, Vernon J (2000) Reproducibility of treatment methodologies detailed in contemporary reports clinical trial. J Oncol Pharm Pract 6(2):50–54
16. Lyman GH (2006) Chemotherapy dose intensity and quality cancer care. Oncol Williston Park 20(9 Suppl 14):16–25
17. Classen DC et al (1997) Adverse drug events in hospitalized patients. Excess length of stay, extra costs, and attributable mortality. JAMA 277(4):301–306
18. Pirmohamed M et al (2004) Adverse drug reactions as cause of admission to hospital: prospective analysis of 18 820 patients. BMJ 329(7456):15–19
19. Thomas EJ et al (1999) Costs of medical injuries in Utah and Colorado. Inquiry 36(3):255–264
20. White TJ, Arakelian A, Rho JP (1999) Counting the costs of drug-related adverse events. Pharmacoeconomics 15(5):445–458 21. Bates DW et al (1995) Incidence of adverse drug events and
potential adverse drug events. Implications for prevention. ADE Prevention Study group. JAMA 274(1):29–34
22. Trotti A et al (2003) CTCAE v3.0: development of a comprehensive grading system for the adverse effects of cancer treatment. Semin Radiat Oncol 13(3):176–181
23. Bergman U et al (1998) Drug utilization 90% - a simple method for assessing the quality of drug prescribing. Eur J Clin Pharmacol 54:113–118
24. Weingart SN et al (2005) What can hospitalized patients tell us about adverse events? Learning from patient-reported incidents. J Gen Intern Med 20(9):830–836
25. Basch E et al (2006) Patient versus clinician symptom reporting using the National Cancer Institute Common Terminology Criteria for Adverse Events: results of a questionnaire-based study. Lancet Oncol 7(11):903–909