Free-Choice Profiling of OR-I7 Agonists and Homologues
Using GCO
Katherine M. Kittel&Anne J. Kurtz&John Barnard& Terry E. Acree
Received: 11 July 2008 / Accepted: 9 October 2008 / Published online: 11 November 2008
# 2008 Springer Science + Business Media, LLC
Abstract Straight chain aldehydes C-7 to C-10 excite olfactory receptor I-7 (OR-I7), while aldehydes C-6, C-11, and C-12 do not. Odorants C-6 to C-12 were analyzed using free-choice profiling to determine differences in olfactory perceptions. A panel of 12 subjects, two male and ten female, analyzed a set of seven saturated straight chain aldehydes of increasing length (C-6 to C-12). Panelists were trained with pure standards and tested in two trials using a seven-odorant probe delivered via gas chromatography–olfactometry. Generalized procrustes anal-ysis of the panelists’ scores provided information on differences of perceived odor quality. C-6 was characterized by green and grassy aromas, while C-7 to C-12 were characterized as citrus aromas with additional odor notes varying from floral, fresh, and soapy (C-7) to nutty, oily, and rancid (C-12). Differences in odor quality suggest that
several different olfactory receptors including OR-I7 are involved in the processing of aldehydes C-6 to C-12.
Keywords Olfactory Perception . Free-Choice Profiling (FCP) .
Gas Chromatography–Olfactometry (GCO) . Generalized Procrustes Analysis (GPA) . Olfactory Receptor I-7 (OR-I7)
Introduction
An odorant must bind to an olfactory receptor protein (OR) located within the olfactory epithelium in order to stimulate a perception. There are approximately 1,000 OR genes in the human genome, roughly 400 of which are full-length odorant receptor genes (Crasto et al. 2001; Glusman et al. 2001; Zozulya et al.2001; Olender et al.2004). Activation of an OR can occur via binding with a specific odorant or with any-one of a group of related chemicals (Araneda et al. 2000). The first in vivo identification of specific odorant– receptor interactions was OR-I7 in the rat (Zhao et al. 1998). When OR-I7 was over-expressed in a rat using modified rhinovirus, sensitivity to octanal (C-8) was greatly increased. Further testing showed elevated responses to heptanal (C-7), nonanal (C-9), and decanal (C-10) alde-hydes, although C-8 elicited the greatest response. There was very little response to the larger homologues undecanal (C-11) and dodecanal (C-12). When smelled by humans, this C-7 to C-10 subset of straight-chain aldehydes often have percepts with citrus-like descriptors while the smaller homologue hexanal (C-6) has a green grassy aroma without any citrus character, and the larger homologue C-11, also free of citrus character, is oily, sweet, and pungent (http://
www.flavornet.org, Arn and Acree1998).
DOI 10.1007/s12078-008-9033-1 K. M. Kittel Cadbury Adams, 941 Route 10, Whippany, NJ 07981, USA A. J. Kurtz
:
T. E. Acree (*)Department of Food Science and Technology, Cornell University,
630 West North Street, Geneva, NY 14456, USA e-mail: [email protected]
A. J. Kurtz
e-mail: [email protected] J. Barnard
Division of Computer Services, Cornell University,
630 West North Street, Geneva, NY 14456, USA e-mail: [email protected]
Olfactory receptor specificity is not a simple one-to-one association between an OR and a molecule. Many features both molecular and genetic determine the receptive range of an OR and the range of ORs activated by an odorant. Molecular features that predict specificity at the receptor include functional groups and molecular topology (Araneda et al.2000). Furthermore, a range of activation patterns in rat ORs, including at least ten different receptors for octanal, were observed when multiple receptors were studied using a panel of odorants similar to octanal. This observation implies that higher level processing may be required to discriminate between some odorants even though there is a great deal of specificity at the periphery of the olfactory system (Amoore1967).
Documented instances of decreased ability to detect specific odorants (also known as odorant-specific sensory deficits, or OSDs), are believed to be due to the expression (or lack thereof) of specific OR genes (Amoore1967; Amoore et al. 1968; Wysocki and Beauchamp 1984; Lawless et al. 1995; Cain and Schmidt 2002; Menashe et al. 2003). However, the existence of OSDs indicates that only one or at most a few specifically tuned ORs are directly responsible for at least some odorant responses. The narrow specificity of the OR-7D4 to just two very similar ligands is a notable example (Keller et al. 2007). For a group of individuals, odorants will seldom be expected to have the same percept and almost never invoke percepts with both the same quality and intensity. Nevertheless, there must be a latent similarity in olfactory response that reflects the most common OR expressions in a group and descriptive sensory techniques can be used to investigate these similarities.
Descriptive analysis, a sensory technique, often involves a long, elaborate training process designed to make panelists behave as reproducible instruments by using the same terminology (Lawless 1999). Free-choice profiling (FCP) is a sensory method that allows panelists to generate and utilize their own set of descriptors when assessing a set of samples (Williams and Langron 1984). Training is reduced to descriptor generation. The panelists use these sets of descriptors to rank the intensity of percepts (Oreskovich et al. 1991; Heymann 1994). The resulting data is then transformed using Generalized Procrustes Analysis (GPA) to a consensus configuration revealing relationships between samples. In this study, gas chroma-tography–olfactometry (GCO) was used to deliver target compounds free from impurities to the subjects. GCO can separate an odorant from a potential array of the impurities often present in commercial preparations. GCO also delivers a variety of odorants, in a precise Gaussian dose, with limited odorant exposure (Acree1997).
The striking similarity between the pattern of OR-I7 activity in the rat and the pattern of human odor responses to the OR-I7 agonists led to this study of the odor quality of
C-6 to C-12 using the same subjects, FCP and GCO. Although C-6 to C-12 have all been reported to create different odor perceptions, the precise relationship between their percepts has not. This research aims to identify shifts in perceptual classification within this series of straight-chain aldehydes. It was hypothesized that there would be perceptual differences between odorants that excite OR-I7 and those producing no response. Three sets of aldehydes were examined: C-6, the set of C7 to C-10, and finally the C-11 and C-12.
Materials and Methods
Odorant Standards A series of C-6 to C-12 straight-chain aldehydes were obtained from Sigma-Aldrich (St. Louis, MO, USA). These compounds were chosen for good chromatographic separation, closely related chemical struc-ture, functionality, and previous examination in specific rodent OR-I7–ligand interaction studies (Zhao et al. 1998; Araneda et al. 2000, 2004). Table 1 lists the experimental concentrations of odorants in the test set. Initial olfactory potency studies were carried out on a 28-year-old female using GCO at a starting concentration of 250 ppm in Freon 113™ for all compounds. From this data, an initial odorant set was created and 1/3 dilutions were sniffed in duplicate to determine potency. An adjusted set was created, by modify-ing the concentrations of each odorant to produce equal odor potency to the reference individual, and tested for equal potency by dilution to threshold (Acree et al. 1984). The final concentrations selected, listed in Table1, ranged from 5 to 50× the concentration of the GCO sample standards.
For the creation of authentic standards, 10% stock solutions of each chemical were prepared in 95% ethanol and stored in amber vials with PTFE lined caps. Initial sample concentra-tion levels for headspace analysis were prepared in propylene glycol (PG) (Sigma-Aldrich, St. Louis, MO). To test the concentration levels of the compounds, Aldrich Flavors & Fragrances Test Strips (Aldrich Chemical Company, Inc., Milwaukee, WI) were dipped in PG standards to a depth of
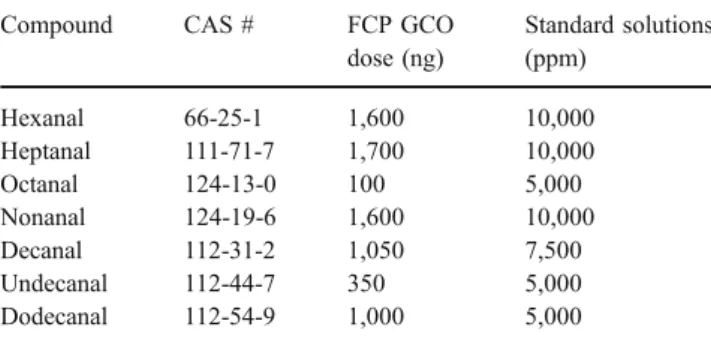
Table 1 Odorants used in the free-choice profiling (FCP), their CAS number, their GCO dose, and their Freon 113™ concentrations in the standard solutions used for training sessions
Compound CAS # FCP GCO dose (ng) Standard solutions (ppm) Hexanal 66-25-1 1,600 10,000 Heptanal 111-71-7 1,700 10,000 Octanal 124-13-0 100 5,000 Nonanal 124-19-6 1,600 10,000 Decanal 112-31-2 1,050 7,500 Undecanal 112-44-7 350 5,000 Dodecanal 112-54-9 1,000 5,000
2 cm, placed in individual pre-cleaned 22 cc. clear screw cap vials (Supelco, Bellefonte, PA), and left to equilibrate for 1 hour. After equilibration, the cap was removed from the vial, and the headspace was sniffed. The odorant concentration selected from the dilution series (1/2 dilutions) for FCP was chosen by the panelist as neither overpowering or faint.
Free-Choice Profiling Three sets of authentic standards were prepared for FCP training sessions and were labeled with random three-digit numbers. The samples were given 4 h to equilibrate. New samples were prepared for each training session. In the first FCP training session, panelists were asked to individually smell the headspace of a randomly presented set of samples and to generate a concise list of descriptors that matched their perceptions. They were advised to use terms with which they were familiar and could use consistently. A sample list of general odor classes was provided as a starting point for descriptor generation, based on the ASTM Atlas of Odor Character Profiles, (Dravnieks1985; Jeltema and Southwick1986).
During the second training session, panelists were provided with a set of authentic standards and the individual list of
terms they had generated in the first session. They were asked to decide if their list of descriptors was still an appropriate representation of their olfactory experiences, and were encouraged to refine, add, and/or remove descriptive terms as needed. This final list of descriptors was used to generate individual ballots for the two FCP testing sessions.
GCO Analysis and Data Collection GCO protocols used an Agilent 6890GC (Agilent Technologies, Palo Alto, CA, USA) modified for GCO, equipped with a 30 m×0.32 mm HP-5 column (Agilent Technologies). Data for development of the standard set was collected on a Macintosh™ computer running Charmware™ software (Datu Inc., Geneva, NY,
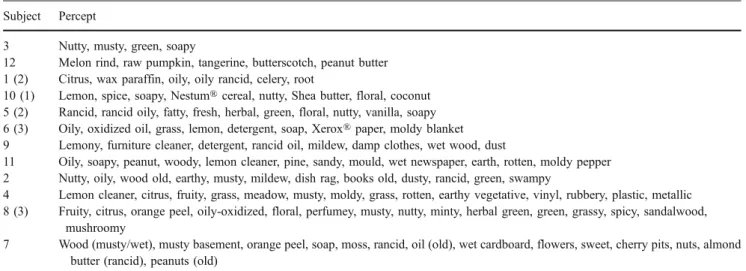
Table 2 Descriptors used by each panelist during free-choice profiling of the straight-chain aldehydes Subject Percept
3 Nutty, musty, green, soapy
12 Melon rind, raw pumpkin, tangerine, butterscotch, peanut butter 1 (2) Citrus, wax paraffin, oily, oily rancid, celery, root
10 (1) Lemon, spice, soapy, Nestum® cereal, nutty, Shea butter, floral, coconut 5 (2) Rancid, rancid oily, fatty, fresh, herbal, green, floral, nutty, vanilla, soapy 6 (3) Oily, oxidized oil, grass, lemon, detergent, soap, Xerox® paper, moldy blanket 9 Lemony, furniture cleaner, detergent, rancid oil, mildew, damp clothes, wet wood, dust
11 Oily, soapy, peanut, woody, lemon cleaner, pine, sandy, mould, wet newspaper, earth, rotten, moldy pepper 2 Nutty, oily, wood old, earthy, musty, mildew, dish rag, books old, dusty, rancid, green, swampy
4 Lemon cleaner, citrus, fruity, grass, meadow, musty, moldy, grass, rotten, earthy vegetative, vinyl, rubbery, plastic, metallic 8 (3) Fruity, citrus, orange peel, oily-oxidized, floral, perfumey, musty, nutty, minty, herbal green, green, grassy, spicy, sandalwood,
mushroomy
7 Wood (musty/wet), musty basement, orange peel, soap, moss, rancid, oil (old), wet cardboard, flowers, sweet, cherry pits, nuts, almond butter (rancid), peanuts (old)
Values in parentheses indicate the number of unused terms in a panelist lexicon
Table 3 Procrustes analysis of variance of the aldehyde series indicating the contribution of each dimension to the model
Dimension Consensus Residuals Total
1 29.62 8.33 37.96 2 18.97 7.37 26.34 3 13.12 4.40 17.51 4 6.42 2.83 9.25 5 4.48 1.80 6.28 6 1.88 0.79 2.66 Total 74.48 25.52 100.00 The first three dimensions contained 82% of the variance
Fig. 1 Free-choice profiling of straight-chain aldehydes using Generalized Procrustes Analysis. Axis 1 separates odorants on a floral fresh soapy to oily rancid nutty scale (38.0% variance). Axis 2 separates odorants on a green grassy to citrus scale (26.3% variance). Total variance accounted for is 64.3%. C-6 hexanal, C-7 heptanal, C-8 octanal, C-9 nonanal, C-10 decanal, C-11 undecanal, C-12 dodecanal
USA). For each run, a 1-mm sample was injected into the GCO instrument which was operated at 35 °C isothermally for 3 min, increased at 6 °C/min to 200 °C, then at 30 °C/min to 240 °C, and held at 240 °C for 3 min. The injector inlet temperature was 250 °C; the purge time was set to 0.5 min. GC effluent was combined with a stream of humidified olfactometer air (7 l/min, 1 cm diameter) and presented to the panelist. The retention time of each odorant was converted to its Kovats retention index using n-paraffin references of 7–18 carbons (Acree et al. 1984; Kovats 1965). During the experiment, VirtualCharmAnalysis™ software alerted panel-ists when an odorant of interest eluted (Datu Inc.). Data was collected using paper ballots, and panelists sniffed the sample set in duplicate.
The panelists were tested via GCO in two sessions of one run each over 2 days. Each session lasted 20 min. During the experimental testing period, each panelist utilized a paper ballot with the personal lexicon developed during the training sessions, rating the intensity of each descriptor using a nine-point scale. The scale was presented as a series of nine boxes anchored with the terms‘weak’ on the left and ‘strong’ on the right (Lawless and Malone 1986). Panelists were instructed to familiarize themselves with their list of descriptors as well as the air coming from the GCO, to acclimatize to any background odor in the air stream. The computer monitor indicated when an odorant of interest labeled with a random three-digit code eluted from the GCO. Panelists were advised that all descriptors from their list were not likely to occur in every odorant, and were asked to judge each odorant independently.
Panelists Panelists were recruited via emails to the Depart-ment of Food Science and Technology, Cornell University, Geneva, NY. Twelve panelists volunteered: ten females and two males, with an age range of 26 to 47 and an average age of 32. All had previous sensory experience; panelists with previous experience have been shown to be more discrimi-nating than naïve panelists when using FCP (Heymann1994). Five of the panelists had previous GCO experience. The Cornell University Committee on Human Subjects reviewed and approved all human subject protocols.
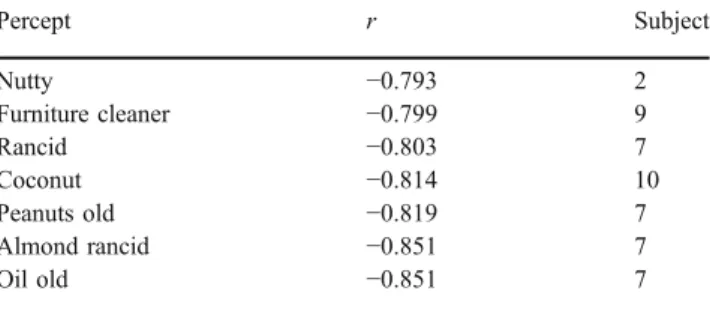
Table 4 Correlation coefficients of percepts used by each subject with the first axis of the consensus configuration
Percept r Subject Floral 0.855 5 Metallic 0.797 4 Detergent 0.78 6 Wax paraffin 0.772 1 Dump clothes 0.758 9 Mildew 0.758 9 Lemon 0.72 6 Soapy 0.705 3 Soap 0.691 7 Oily 0.682 11 Lemon 0.668 10 Fresh 0.63 5 Green 0.61 2 Perfumey 0.545 8 Floral 0.533 8 Flowers 0.522 7 Orange peel 0.522 8 Fruity 0.494 8 Woody 0.43 11 Wood wet 0.422 9 Minty 0.421 8 Soapy 0.421 5 Swampy 0.409 2 Peanut 0.402 11 Rotten 0.383 11 Melon rind 0.365 12 Green −0.303 5 Xerox paper −0.346 6 Raw pumpkin −0.391 12 Wood old −0.42 2 Nutty −0.481 10 Plastic −0.507 4 Nuts −0.538 7 Mould −0.54 11 Musty −0.568 3 Fatty −0.578 5 Spice −0.578 10 Oily −0.593 1 Musty −0.596 8 Earth −0.609 11 Rancid −0.633 2 Wet newspaper −0.641 11 Rubbery −0.692 4 Moldy pepper −0.718 11 Oily −0.76 2 Moldy blanket −0.768 6 Nutty −0.768 8 Lemony −0.772 9 Nutty −0.775 3 Oily rancid −0.78 1 Oxidized oil −0.78 6 Vanilla −0.78 5 Vinyl −0.78 4 Oily −0.78 6 Oily/oxidized −0.78 8 Table 4 (continued) Percept r Subject Nutty −0.793 2 Furniture cleaner −0.799 9 Rancid −0.803 7 Coconut −0.814 10 Peanuts old −0.819 7 Almond rancid −0.851 7 Oil old −0.851 7
Data Analysis FCP data was analyzed by General Procrus-tes Analysis (GPA) SensoMineR 1.03 software (http://
sensominer.free.fr, Pagés and Husson 2005).
Results
Table 2 lists the terms used by panelists during the GCO testing sessions. The total number of terms used to describe the set of odorants during headspace training sessions ranged from four to 18, with an average of ten descriptors per panelist. However, during the FCP assessment of the odor-ants via GCO, five of the panelists did not completely utilize their lexicons. The terms used during GCO testing sessions ranged from four to 15, with an average of nine descriptors. Most panelists used at least one descriptive term from the odorant classes: citrus, fatty-oily, green, or musty. Several panelists reported detecting odorants matching descriptors generated from the headspace samples eluting from the GCO in between the odorants of interest, reaffirming the ability of GCO to present purer odorants to panelists. All subjects were able to detect the odorants as they eluted from the GCO.
GPA resulted in a consensus configuration with three axes accounting for a total of 82% of the variation in the FCP scores (see Table3). Panelist agreement with the consensus configuration ranged from 45% to 87%, with an average agreement of 73%. Correlation analysis (P=0.05) showed that neither age nor gender affected panelist agreement, though there was a significant relationship between the number of descriptors used and the percentage agreement with the consensus configuration, i.e., panelists who used more descriptors had a better consensus agreement.
Figure1shows the aldehydes plotted in the space created by the first two axes of the GPA. Each axis is a function of the intensities of all the descriptors used by the panelist: ovals represent 95% confidence intervals. The correlations for each descriptor with the consensus configuration for the two axes
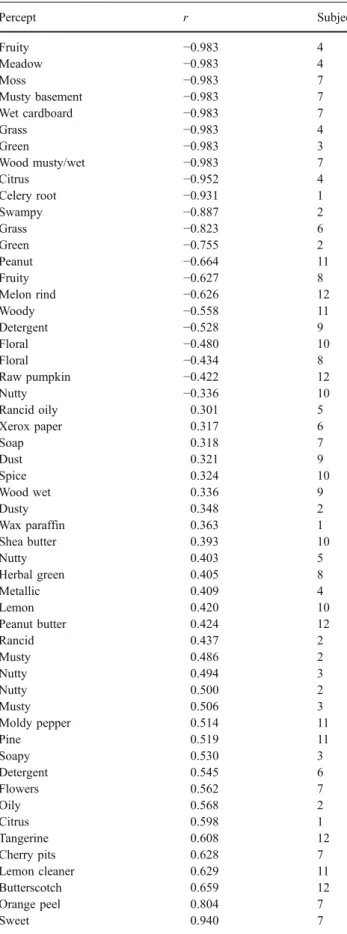
Table 5 Correlation coefficients of percepts used by each subject with the second axis of the consensus configuration
Percept r Subject Fruity −0.983 4 Meadow −0.983 4 Moss −0.983 7 Musty basement −0.983 7 Wet cardboard −0.983 7 Grass −0.983 4 Green −0.983 3 Wood musty/wet −0.983 7 Citrus −0.952 4 Celery root −0.931 1 Swampy −0.887 2 Grass −0.823 6 Green −0.755 2 Peanut −0.664 11 Fruity −0.627 8 Melon rind −0.626 12 Woody −0.558 11 Detergent −0.528 9 Floral −0.480 10 Floral −0.434 8 Raw pumpkin −0.422 12 Nutty −0.336 10 Rancid oily 0.301 5 Xerox paper 0.317 6 Soap 0.318 7 Dust 0.321 9 Spice 0.324 10 Wood wet 0.336 9 Dusty 0.348 2 Wax paraffin 0.363 1 Shea butter 0.393 10 Nutty 0.403 5 Herbal green 0.405 8 Metallic 0.409 4 Lemon 0.420 10 Peanut butter 0.424 12 Rancid 0.437 2 Musty 0.486 2 Nutty 0.494 3 Nutty 0.500 2 Musty 0.506 3 Moldy pepper 0.514 11 Pine 0.519 11 Soapy 0.530 3 Detergent 0.545 6 Flowers 0.562 7 Oily 0.568 2 Citrus 0.598 1 Tangerine 0.608 12 Cherry pits 0.628 7 Lemon cleaner 0.629 11 Butterscotch 0.659 12 Orange peel 0.804 7 Sweet 0.940 7
Correlations with absolute values less than 0.3 are not shown
Fig. 2 Venn diagrams of odorant perceptual categories experimentally determined in this study, indicating possible odorant receptor binding affinities
are listed in Tables 4 and 5. The first axis separated the samples as a function of the intensity of the aromas that contain the largest percentage of the variance (Table4). This axis separated the compounds, with the exception of C-6, by decreasing chain length. C-8 and C-9 were reversed but grouped closely together, showing that the C-7 to C-12 primarily differed by a gradation of odor character along the first axis. This axis separated samples by odor character from floral fresh soapy (positive) to oily rancid nutty (negative). C-6 separated from all the other compounds on the second axis indicating that it has a very different perceptual character from the other odorants. The second axis separated compounds by green grassy to citrus. The C-7 to C-10 series all contained elements of citrus character with similar intensities (Table5).
Discussion
The purpose of these experiments was to discover the perceptual relationships between the OR-I7 agonists, C-7 to C-10 aldehydes, and the less active smaller homologue, C-6, and the larger homologues C-11 and C-12. Free-choice profiling combined with Procrustes analysis assessed the underlying differences between the perceptions of the ligands while allowing the panelist to uses different descriptors for the same sensory event. Presumably, individual differences in the OR expression (e.g., OSDs) were minimized in the results and common OR expressions created relationships between perceptions. The separation between the green smelling C-6 and the OR-I7 agonists (C-7 to C-10) as well as the higher homologues C-11 and C-12 is clear (Fig.1). C-6 with its green, grassy descriptors appears to have nothing in common with any of the other compounds perhaps because it is not an OR-I7 agonist. The other compounds show a graded response that reflects their increasing molecular size and perhaps overlapping activities toward OR-I7 (producing a citrus percept) and ORs that produce more waxy rancid percepts.
Understanding the direct relationship between OR genes and the percepts generated by odorant ligands is complicated by the large number of OR genes in the human genome and the overlapping specificities of OR–ligand binding. When comparing panelists, there are potentially multiple levels of differences due in part to variation in genetic OR expression. Additionally, several ORs have been shown to bind to a variety of related odorants (Zhao et al.1998; Araneda et al. 2000, 2004; Malnic et al. 1999; Gaillard et al.2002). The presence or absence of specific genes may or may not impact the perceptions generated by single odorant compounds, leading to a gradation in detection and perceptual responses. Most odorants will likely evoke graded responses due to overlapping receptor–ligand specificity. However, the pres-ence of stable odorant-specific sensory deficits (OSDs)
suggests that individuals should differ in their graded responses to some odorants. The consensus generated by GPA should minimize the effects of these differences.
It would be expected that odorants C-8 to C-10 share common percepts, while C-6, C-11, and C-12 differ from C-8 to C-10 as well as from each other. Figure1support this. A gradual shift in overlapping odor quality was observed in the straight-chain aldehyde series from C-7 to C-12. This indicates that C-7 to C-12 activate at least two ORs with related odorant-binding specificity, one of which is OR-I7. Since C-6 produced a very different odorant percept, it likely activates a different type of OR class than the other aldehydes. These hypothetical relationships are illustrated in Fig. 2. The placement of each compound in Fig.2 was based on the pair-wise similarity they displayed in Fig.1.
Studying adaptation, cross-adaptation and mixture psycho-physics of these compounds could produce insight into their peripheral chemistry or their central processing especially when compared with the perceptual map shown in Fig. 1. These results are consistent with a model of olfaction in which a small number of odorants activate a one-to-one relationship between receptor and percept. However, it does not eliminate the possibility of more elaborate top-down processing.
References
Acree TE (1997) GC/olfactometry. Anal Chem 69(5):170A–175A Acree TE, Barnard J, Cunningham DG (1984) A procedure for the
sensory analysis of gas chromatographic effluents. Food Chem 14(4):273–286
Amoore JE (1967) Specific anosmia: a clue to the olfactory code. Nature 214:1095–1098
Amoore JE, Venstrom D, Davis AR (1968) Measurement of specific anosmia. Percept Mot Skills 26:143–164
Araneda RC, Kini AD, Firestein S (2000) The molecular receptive range of an odorant receptor. Nat Neurosci 3(12):1248–1255 Araneda RC, Peterlin Z, Zhang X, Chesler A, Firestein S (2004) A
pharmacological profile of the aldehyde receptor repertoire in rat olfactory epithelium. J Physiol 555(3):743–756
Arn H, Acree T (1998) Flavornet: a database of aroma compounds based on odor potency in natural products. In: Contis E, Ho C-T, Mussinan C, Parliment T, Shahidi F, Spanier A (eds) Food flavors: formation, analysis and packaging influences, vol. 40. Elsevier, Amsterdam, pp 27–28
Cain WS, Schmidt R (2002) Sensory detection of glutaraldehyde in drinking water—emergence of sensitivity and specific anosmia. Chem Senses 27:425–433
Crasto C, Singer MS, Shepherd GM (2001) The olfactory receptor family album. Genome Biol 2(10):1027.1–1027.4
Dravnieks A (1985) Atlas of odor character profiles. ASTM, Philadelphia
Gaillard I, Rouquier S, Pin j-P, Mollard P, Richard S, Barnabe C (2002) A single olfactory receptor specifically binds a set of odorant molecules. Eur J Neurosci 15(3):409–418
Glusman G, Yanai I, Rubin I, Lancet D (2001) The complete human olfactory subgenome. Genome Res 11(5):685–702
Heymann H (1994) A comparison of free choice profiling and multidimensional scaling of vanilla samples. J Sens Stud 9:445–453 Jeltema M, Southwick E (1986) Evaluation and applications of odor
profiling. J Sens Stud 1:123–136
Keller A, Zhuang H, Chi Q, Vosshall LB, Matsunami H (2007) Genetic variation in a human odorant receptor alters odour perception. Nature 449(7161):468–472
Kovats E (1965) Gas chromatographic characterization of organic substances in the retention index system. Adv Chromatogr 1:229–247
Lawless HT (1999) Descriptive analysis of complex odors: reality, model or illusion. Food Qual Prefer 10(4–5):325–332
Lawless HT, Malone GJ (1986) A comparison of rating scales: sensitivity, replicates and relative measurement. J Sens Stud 1:155–174
Lawless H, Thomas C, Johnston M (1995) Variation in odor thresholds for l-carvone and cineole and correlations with suprathreshold intensity ratings. Chem Senses 20(1):9–17 Malnic B, Hirono J, Sato T, Buck LB (1999) Combinatorial receptor
codes for odors. Cell 96(5):713–723
Menashe I, Man O, Lancet D, Gilad Y (2003) Different noses for different people. Nat Genet 34(2):143–144
Olender T, Feldmesser E, Atarot T, Eisenstein M, Lancet D (2004) The olfactory receptor universe—from whole genome analysis to structure and evolution. Genet Mol Res 3(4):545–553
Oreskovich DC, Klein BP, Sutherland JW (1991) Procrustes analysis and its applications to free-choice and other sensory profiling. In: Lawless HT, Klein BP (eds) Sensory science theory and applications in foods. Marcel Dekker, New York, pp 353–393
Pagés J, Husson F (2005) Multiple factor analysis with confidence ellipses: a methodology to study the relationships between sensory and instrumental data. J Chemom 19(3):138–144 Williams A, Langron S (1984) The use of free choice profiling
for the examination of commercial ports. J Sci Food Agric 35: 558–568
Wysocki CJ, Beauchamp GK (1984) Ability to smell androstenone is genetically determined. Proc Natl Acad Sci USA 81(15): 4899–4902
Zhao H, Ivic L, Otaki J, Hashimoto M, Mikoshiba K, Firestein S (1998) Functional expression of a mammalian odorant receptor. Science 279(5348):237–242
Zozulya S, Echeverri F, Nguyen T (2001) The human olfactory receptor repertoire. Genome Biol 2(6):research0018.1–research 0018.12