O R I G I N A L A R T I C L E – H E A D A N D N E C K O N C O L O G Y
Evaluation of Clinical and Histomorphological Parameters
as Potential Predictors of Occult Metastases in Sentinel Lymph
Nodes of Early Squamous Cell Carcinoma of the Oral Cavity
Mete Goerkem, MD1,2, Julia Braun, MS3, and Sandro J. Stoeckli, MD2,41
Institute of Surgical Pathology, Department of Pathology, University Hospital Zurich, Zurich, Switzerland;2Department of Otorhinolaryngology, Head and Neck Surgery, University Hospital Zurich, Zurich, Switzerland;3Biostatistics Unit, Institute of Social and Preventive Medicine, University of Zurich, Zurich, Switzerland;4Department of
Otorhinolaryngology, Head and Neck Surgery, Kantonsspital St. Gallen, St. Gallen, Switzerland
ABSTRACT
Background. Sentinel node biopsy (SNB) for cN0 early squamous cell carcinoma (SCC) of the oral cavity has been validated by numerous studies. Around 30% of SNB will detect occult disease. Several clinical and morphological features of the primary tumor have been claimed to be predictive for occult metastasis in elective neck dissec-tions. The aim of this study was to assess these factors in the context of SNB.
Methods. Seventy-eight patients undergoing SNB for T1/2
oral SCC from the years 2000 to 2007 were prospectively included. Primary tumors were reviewed for the following morphological and clinical parameters: grade of differen-tiation, tumor depth, tumor thickness, perineural invasion, lymphatic invasion, vascular invasion, muscle invasion, lymphoplasmacytic infiltration, and mode of invasion, age, gender, primary tumor site, tumor side, and cT category. Results. Statistical analysis revealed significance to predict occult metastasis in the SNB for grade of differentiation (P = 0.002), lymphatic invasion (P \ 0.001), and mode of invasion (P \ 0.001). None of the other factors reached significance. The mean tumor depth was 6.45 mm (range 0.72–15.15 mm) and the mean tumor thickness was 7.2 mm (range 0.72–15.15 mm). None of the cutoff values reached significance for predicting occult disease.
Conclusions. Tumor depth and tumor thickness failed to achieve statistical significance for prediction of occult
metastases in the context of SNB. Patients with cN0 early squamous cell carcinoma of the oral cavity should be offered SNB regardless of their tumor depth and thickness. Poorly differentiated carcinomas, carcinomas with lymp-hangiosis, and carcinomas with a dissolute mode of invasion show a high probability of positive SNB.
Lymph node metastases have been shown to be the strongest prognosticator in head and neck squamous cell carcinoma (HNSCC). The 5-year survival drops consider-ably from 63–86% in patients with no nodal involvement to 20–36% in patients with lymph node metastases.1–4 Whereas therapeutic neck dissection in patients with overt lymph node involvement is considered standard of care, there still exists controversy with regard to elective treat-ment of the clinically negative neck. Though the benefit of elective neck dissection versus wait-and-see with thera-peutic neck dissection in case of nodal relapse has never been proven in large randomized trials, most centers around the world favor an active policy in these situations. The rationale for this lies in the high prevalence of occult dis-ease found on routine elective neck dissection. However, although 20–30% of clinically N0 patients will show occult metastases on elective neck dissection, a considerably large number of patients will remain pathologically N0, and therefore do not benefit from the surgical intervention.5,6 During the last decade sentinel node biopsy (SNB) has been adopted from the treatment of breast cancer and melanoma, and successfully introduced in the treatment regimen of early oral and oropharyngeal squamous cell carcinoma.7–11 Many studies in the context of elective neck dissections have investigated potential predictive factors for lymph node metastasis in clinically nodal negative patients,
Ó Society of Surgical Oncology 2009
First Received: 12 April 2009; Published Online: 16 October 2009 S. J. Stoeckli, MD
e-mail: [email protected] DOI 10.1245/s10434-009-0755-3
with contradictory results, most probably due to insuffi-cient histopathological workup of the neck dissection specimens.14–45
The most promising factor emerging from these studies seemed to be the depth of tumor infiltration.14–16,20–33Even nowadays, many centers still rely on cutoff values of 4 or 5 mm of tumor depth for indication of elective neck treat-ment. With regard to the much more focused and precise histological staging of sentinel lymph nodes in contrast to nodes in neck dissection specimens, the aim of this study was to assess whether any of the formerly evaluated clinical or histologic factors in the primary tumors were still sig-nificantly predictive of occult disease in the context of SNB. PATIENTS AND METHODS
Patients
Between the years 2000 and 2007 the total number of 78 patients with biopsy-proven early-stage (cT1/2) SCC of the
oral cavity and no evidence of lymph node metastases (cN0)
after physical examination and adequate imaging were prospectively enrolled in our SNB protocol. All patients underwent transoral tumor resection and SNB as previously published.9Patient data were retrieved from the archives of the Department of Otorhinolaryngology—Head and Neck Surgery, University Hospital Zurich, Switzerland. Matched tissue samples from excision specimens were retrieved from the archives of the Institute of Surgical Pathology, Uni-versity Hospital Zurich, Switzerland. All diagnoses were reviewed by an experienced pathologist. The study was approved by the local ethics committee.
From an extensive literature review, all the clinical and histomorphologic parameters associated with potential predictive significance were extracted.
The following clinical parameters were included in the statistical analysis: age, gender, anatomic subsite of the primary tumor (floor of mouth versus oral tongue), tumor side (right, left, midline), and cT category.12
Histopathology
The entire sentinel nodes were examined with conven-tional hematoxylin and eosin (H&E) and immunohis-tochemical cytokeratin (CK) staining at step-serial sections of 150-lm intervals as published earlier.9The exact meth-odology of SNB has been previously described.13 The sentinel nodes were categorized as either positive in case of the presence of any occult cancer deposits (isolated tumor cells and/or micrometastasis and/or metastasis) or as neg-ative if no tumor cells were detected.46
The primary tumor was routinely stained with H&E. The following histopathological features of the tumor and its
microenvironment were examined: grade of differentiation (G1–3), tumor depth, tumor thickness, perineural invasion, lymphatic invasion, vascular invasion, muscle invasion, peritumoral lymphoplasmacytic infiltration, and mode of invasion.
Grade of differentiation (GOD) was routinely assessed depending on the degree of keratinization, nuclear poly-morphism, and the number of mitoses, lymphatic (LI) or vascular (VI) as well as muscle (MI) and perineural inva-sion (PI) as described in the literature.12,15–17
For the statistical analysis tumors graded G1 were com-pared with the pooled tumors graded G2 and 3.
Tumor depth and tumor thickness were assessed with the aid of a computerized image analysis program (analy-SISD soft imaging system, Olympus Company, Tokyo/ Japan) linked to a light microscope (Zeiss Axiophot micro-scope, Oberkochen/Germany). Tumor depth and thickness were defined and measured according Ambrosch et al. as follows:14 Tumor depth was measured vertically from the mucosal surface to the deepest point of tumor infiltration. If there was no mucosal surface due to ulceration or exo-phytic growth a virtual mucosa line connecting the adjacent mucosal surface of both sides was used. Tumor thickness was assessed by drawing a parallel line to the virtual mucosa line, placed tangentially at the most exophytic tumor area. Whereas the starting points differed for the two measurements, the deepest point of the invasive tumor border was identical for both.
The entire tumor specimen was investigated, and the tumor section with the most important tumor depth and thickness was photographed under the light microscope, and the images digitalized on a computer. The image analysis program then calculated the corresponding tumor thickness and depth values.
The extent of peritumoral lymphoplasmacytic infiltration (LPI) was divided into three grades according to Brandw-ein-Gensler et al.18 A decreasing number of infiltrating lymphocytes has been shown to parallel a worse biological outcome. Grade 1 is characterized by a continuous dense layer of lymphoplasmacytic infiltration among tumor and healthy tissue. Grade 2 shows a discontinuous patchy pat-tern of lymphoplasmacytic infiltration. Grade 3 shows only minimal or no infiltration.
For statistical analysis, tumors with grade 1 (low-risk group) were compared with the pooled grade 2 and 3 tumors (high-risk group).
The mode of invasion (MOI) describes the morphologi-cal appearance of the infiltrating tumor front. According to the grading system of Yamamoto et al., the higher the MI grade, the more aggressive the infiltrating pattern.19 MI grade 1 describes a well-defined tumor front. MI grade 2 tumors have a less well-defined front with plump cords in part. In MI grade 3 tumors no distinct border is identifiable
anymore; however, dissolute groups of infiltrating tumor cells are predominating. MI Grade 4 is characterized by a diffuse type of invasion with two subgroups: MI subtype 4C (Fig.1) shows a cord-like type of diffuse invasion, whereas in MI subtype 4D a widespread type of diffuse invasion prevails. Of note, only the deepest region of the tumor was assessed, as there were differences in the mode of invasion between the superficial and deep fraction of the tumor.
For statistical analysis, grades 1–3 were pooled as low-risk group (cohesive growth pattern) and compared with the pooled grade 4 tumors (dissolute growth pattern). Statistical Methods
In order to explore the relation between clinical and histopathologic parameters and the occurrence of sentinel lymph node metastasis (SLNM), first the chi-squared test for the categorical variables and the Mann–Whitney test for the continuous variables were applied. These tests were used to detect dependencies between possible predictive factors and the outcome variable.
In a second step, all variables were tested in univariate logistic regression models. These models enable the quan-tification of the influence of the predictive variables on the outcome.
For illustration purposes, the sensitivity, specificity, and positive and negative predictive values for the parameters were calculated. For continuous variables, the receiver operating characteristic (ROC) curve displays the sensi-tivity and 1—specificity for all possible threshold values. Therefore it is a valuable tool for the evaluation of possible diagnostic markers.
All calculations were carried out using SPSS version 16.0.2 software for Mac OS X (SPSS Inc., Chicago, IL). Figures3 and 4 were produced using the statistical
software R version 2.7.2 for Mac OS X (The R foundation for Statistical Computing). Values of P \ 0.05 were con-sidered as statistically significant.
RESULTS
Clinical Parameters
A total of 78 patients (52 males, 26 females) with a mean age of 60 years (range 34–87 years) were included in this study. The site of primary tumor origin was the oral tongue in 55 and the floor of mouth in 23 patients. The tumors were staged T1in 40 and T2 in 38 patients. SNB
revealed occult disease in 28 patients (36%), whereas 50 patients (64%) remained nodal negative. The primary tumor was on the right side in 40, on the left side in 32, and in the midline in 6 patients.
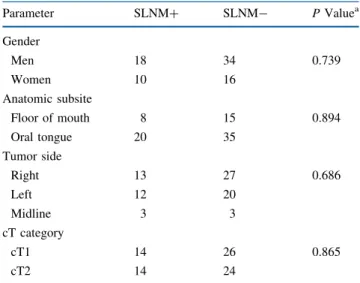
Table1 summarizes the results of the clinical parame-ters assessed as potential predictive factors for occult disease in the sentinel lymph nodes. None of the clinical parameters were statistically significant for the prediction of SLNM.
Histopathologic Parameters
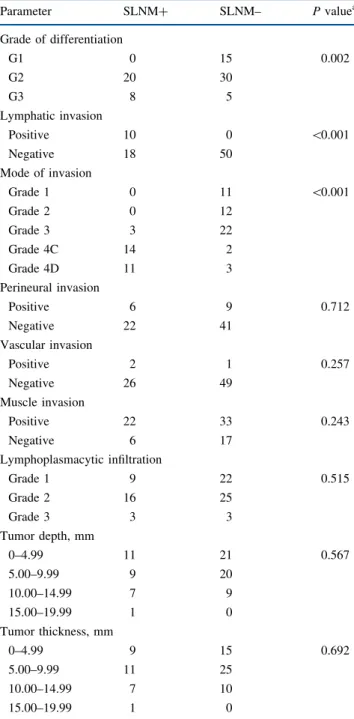
The distribution of the histopathologic parameters between tumors with and without SLNM, and the Pear-son’s chi-squared test or, respectively, the Mann–Whitney test, is summarized in Table2. There were three highly significant parameters correlating with the occurrence of SLNM in the logistic regression model: grade of differ-entiation (G1 versus G2/3), lymphatic invasion, and mode of invasion (cohesive versus dissolute). Poor differentia-tion, dissolute growth pattern at the infiltrating tumor front, FIG. 1 Example of a dissolute infiltration pattern grade 4C at the
tumor front (H&E)
TABLE 1 Clinical parameters
Parameter SLNM? SLNM- P Valuea Gender Men 18 34 0.739 Women 10 16 Anatomic subsite Floor of mouth 8 15 0.894 Oral tongue 20 35 Tumor side Right 13 27 0.686 Left 12 20 Midline 3 3 cT category cT1 14 26 0.865 cT2 14 24
and lymphatic invasion were significantly associated with higher likelihood of SLNM. All primary tumors with lymphatic invasion showed SLNM. In contrast, no tumor graded as well differentiated (G1) showed SLNM. All the other parameters were not significant.
Table3presents the sensitivity, specificity, positive and negative predictive value, odds ratio with 95% confidence interval, and the p value of the univariate logistic regression analysis of the histologic parameters. Mode of invasion
revealed the highest odds ratio among all histomorphologic criteria. Only 3 of 48 patients (6.3%) in the low-risk group with cohesive growth pattern showed a SLNM. In contrast, 25 of 30 patients (83.3%) in the high-risk group with dissolute growth pattern had SLNM. Accordingly, the false-negative rate was very small, and the sensitivity and negative predictive value reached 89.3% and 93.8%, respectively.
Additional cross-tabulations of the parameters mode of invasion versus grade of differentiation and lymphatic invasion, respectively, were used to detect dependencies. The P-value of Fisher’s exact test for MOI versus GOD was 0.006 and for MOI versus LI was 0.011, showing a considerable connection between these parameters.
The measurement of tumor depth and tumor thickness in the primary tumors revealed an average value of 6.45 and 7.2 mm, respectively, with a range of 0.72–15.15 and 0.72– 15.15 mm, respectively.
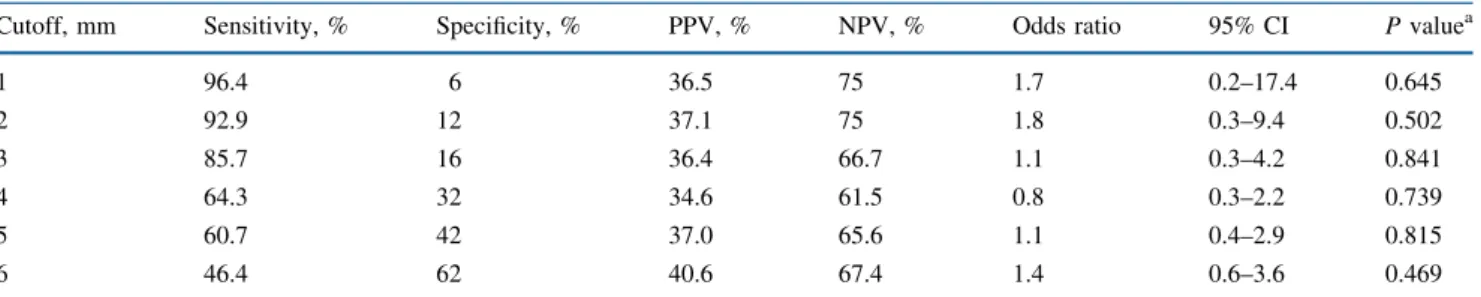
In Table 4, different cutoff values for tumor depth in relation to the corresponding sensitivity, specificity, posi-tive and negaposi-tive predicposi-tive value (NPV), odds ratio with 95% confidence interval, and P value of the univariate logistic regression analysis are listed. The same values are given for the tumor thickness in Table5.
None of the cutoff values, for neither tumor depth nor tumor thickness, achieved statistical significance to predict SLNM. For the tumor depth even the cutoff values of 1 and 2 mm, respectively, only reached a NPV of 75%. The most widely used cutoff values of 3, 4, and 5 mm were only able to exclude SLNM in roughly two-thirds of cases. For tumor thickness the cutoff values of 1 and 2 mm reached a NPV of 100%, and the cutoff of 3 mm reached a NPV of 80%. The most widely used cutoff values of 4 and 5 mm were again only able to exclude SLNM in roughly two-thirds of cases. Probably the best statistical method to analyze the pre-dictive significance of a tested parameter is a ROC curve with calculation of the area under the curve. A steep curve with a large area under the curve represents a very reliable diagnostic test, whereas a curve approximating a diagonal indicates a diagnostic test which is completely inappropri-ate, because its results are not better than results obtained by chance or guessing. Figures2and3show the ROC curves for tumor depth and tumor thickness, respectively. The values of the area under the curve for tumor depth and tumor thickness were 0.539 and 0.527, respectively. It is very obvious that neither of these parameters is useful to predict SLNM.
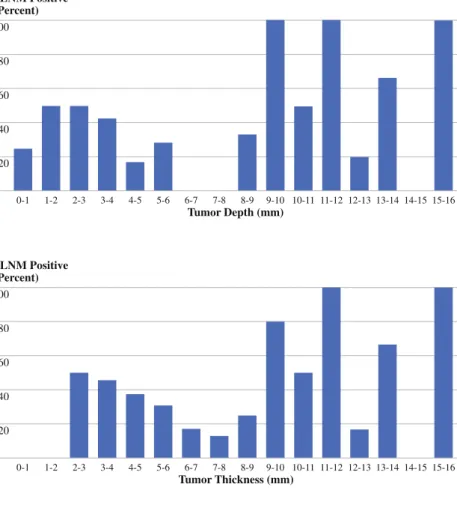
Figures4 and 5 show the percentage of patients with SLNM divided into groups of 1 mm from 1 to 16 mm for tumor depth/thickness. Each group contains the number of patients for whom tumor depth/thickness values were in the range of the group limits. In each group the prevalence of the SLNM-positive patients was calculated and showed no TABLE 2 Distribution and significance of histopathological
parameters Parameter SLNM? SLNM– P valuea Grade of differentiation G1 0 15 0.002 G2 20 30 G3 8 5 Lymphatic invasion Positive 10 0 \0.001 Negative 18 50 Mode of invasion Grade 1 0 11 \0.001 Grade 2 0 12 Grade 3 3 22 Grade 4C 14 2 Grade 4D 11 3 Perineural invasion Positive 6 9 0.712 Negative 22 41 Vascular invasion Positive 2 1 0.257 Negative 26 49 Muscle invasion Positive 22 33 0.243 Negative 6 17 Lymphoplasmacytic infiltration Grade 1 9 22 0.515 Grade 2 16 25 Grade 3 3 3 Tumor depth, mm 0–4.99 11 21 0.567 5.00–9.99 9 20 10.00–14.99 7 9 15.00–19.99 1 0 Tumor thickness, mm 0–4.99 9 15 0.692 5.00–9.99 11 25 10.00–14.99 7 10 15.00–19.99 1 0
a Pearson’s chi-squared test, Mann–Whitney test for tumor depth and thickness
TABLE 3 Analysis of histopathologic parameters
Sensitivity, % Specificity, % PPV, % NPV, % Odds ratio 95% CI P valuea
Differentiation 100 30 44.4 100 na na na Lymphatic invasion 35.7 100 100 73.5 na na na Mode of invasion 89.3 90 83.3 93.8 75 16.5–340.4 \0.001 Perineural invasion 21.4 82 40 65.1 1.2 0.4–4.0 0.713 Vascular invasion 7.1 98 66.7 65.3 3.8 0.3–43.6 0.288 Muscle invasion 78.6 34 40 73.9 1.9 0.6–5.5 0.247 LPI 67.9 44 40.4 71.0 1.7 0.6–4.4 0.307
a Univariate logistic regression
TABLE 4 Statistics of cutoff values for tumor depth
Cutoff, mm Sensitivity, % Specificity, % PPV, % NPV, % Odds ratio 95% CI P valuea
1 96.4 6 36.5 75 1.7 0.2–17.4 0.645 2 92.9 12 37.1 75 1.8 0.3–9.4 0.502 3 85.7 16 36.4 66.7 1.1 0.3–4.2 0.841 4 64.3 32 34.6 61.5 0.8 0.3–2.2 0.739 5 60.7 42 37.0 65.6 1.1 0.4–2.9 0.815 6 46.4 62 40.6 67.4 1.4 0.6–3.6 0.469
a Univariate logistic regression
TABLE 5 Statistics of cutoff values for tumor thickness
Cutoff, mm Sensitivity, % Specificity, % PPV, % NPV, % Odds ratio 95% CI P valuea
1 100 4 36.8 100 na na na 2 100 6 37.3 100 na na na 3 96.4 8 37.0 80 2.3 0.2–22.1 0.456 4 78.6 20 35.5 62.5 0.9 0.3–2.9 0.881 5 67.9 30 35.2 62.5 0.9 0.3–2.5 0.844 6 53.6 48 36.6 64.9 1.1 0.4–2.7 0.894
a Univariate logistic regression
1.0 0.8 0.6 0.4 0.2 1.0 0 1 - Specificity ROC Curve Tumor Depth
0.8
0.2 0.4 0.6
Sensitivity
FIG. 2 ROC curve for tumor depth
1.0 0.8 0.6 0.4 0.2 1 - Specificity ROC Curve Tumor Thickness
1.0
0 0.2 0.4 0.6 0.8
Sensitivity
linear correlation between increasing values of tumor depth or tumor thickness and the proportion of patients with SLNM.
DISCUSSION
During the last decade SNB has been validated for the treatment of early oral and oropharyngeal SCC by a wide range of validation trials throughout the world. The pri-mary goal of SNB is a more accurate histopathologic staging of the clinically and radiologically negative neck. This goal is achieved by meticulous workup of the sentinel nodes with step-serial sectioning and staining with immu-nohistochemistry. This type of workup exceeds by far the routine possible workup of entire elective neck dissection specimens. Elective neck dissection has been routinely applied to the majority of patients presenting with early oral and oropharyngeal SCC due to the 20–30% incidence of occult disease. Numerous studies have tried to reduce the number of unnecessary elective neck dissections by evaluating potential prognostic markers. The most prom-ising markers predicting occult disease were thought to be tumor thickness and infiltration depth. Many centers, therefore, based their decision to perform elective neck dissections on cutoff values of 4 or 5 mm in tumor
thickness or tumor depth. These two values seemed to correlate with the occurrence of occult disease. The aim of our study was to evaluate all parameters investigated for potential prediction of occult disease in elective neck dis-sections within the context of SNB.
Several clinical parameters, such as gender, anatomic subsite, and cT category, were assessed in our study. None of them reached statistical significance for prediction of occult metastases. This means that T1and T2tumors, and
tumors arising from the floor of mouth and the oral tongue, respectively, have the same risk for occult nodal disease. Bilde et al. in a comparable study also failed to find a correlation between T stage, tumor site, and nodal metas-tases.47This is in contrast to the report of Alkureishi et al., who found a correlation between T stage and the occur-rence of nodal disease.48 However, in their study larger tumors staged from T1to T4and tumors arising from the
oropharynx were included. Their figures show a risk of upstaging by SNB for T1and T2tumors of approximately
30% and 50%, and for T3and T4tumors of approximately
75% and 80%, respectively. So, the big difference is not between T1and T2, but between T1/2and T3/4. If only early
tumors had been included, the T stage would possibly not have been prognostic anymore. As the consensus nowadays is that SNB should be reserved for early SCC staged T1or
SLNM Positive (Percent) 100 20 40 80 60 0-1 Tumor Depth (mm) 1-2 2-3 3-4 4-5 5-6 6-7 7-8 8-9 9-10 10-11 11-12 12-13 13-14 14-15 15-16 FIG. 4 Tumor depth in relation to prevalence
of SLNM SLNM Positive (Percent) 100 20 40 80 60 0-1 Tumor Thickness (mm) 1-2 2-3 3-4 4-5 5-6 6-7 7-8 8-9 9-10 10-11 11-12 12-13 13-14 14-15 15-16 FIG. 5 Tumor thickness in relation to
T2, T stage, in our opinion, cannot be used as a predictor
for occult nodal disease.
In previous studies, a great variety of histomorphologic parameters have been investigated as potential markers of occult disease. All these studies were performed in the context of elective neck dissection. To our knowledge, this is the first study evaluating a broad spectrum of histomor-phologic parameters for prediction of occult nodal disease in SNB. Out of this large number of histomorphologic parameters only GOD (G2/3 versus G1), LI, and MOI (dissolute versus cohesive) were significantly associated with SLNM.
Whereas none of the patients with G1 tumors were found to harbor SLNM, the PPV for a high-risk GOD (G2/3) reached 44.4%. This result is in agreement with several previously published studies. Pimenta Amaral et al. repor-ted the GOD to be significantly predictive in floor-of-mouth and T2 tumors.17 Also reports by Kurokawa et al., Byers
et al., Sparano et al., and Martı´nez-Gimeno C et al. found a significant correlation between a poorly differentiated car-cinoma and the presence of occult nodal metastases in the neck dissection specimen.21,29,33,37In a particular study by Chen et al. the prevalence of nodal metastases in the elec-tive neck dissections was 32% for well and 75% for poorly differentiated carcinomas.38 In the study by Bilde et al. there was no correlation between GOD and the detection of occult nodal disease by SNB.47In contrast to our study, in their study most patients presented with well (47%) or moderately (43%) differentiated SCC. As nodal disease was mainly associated with a poor GOD, this might explain the difference between the two studies.
All patients in our study with LI were diagnosed with SLNM (100% PPV). A highly significant association between the presence of lymphovascular invasion and nodal metastases in elective neck dissections was also shown in studies by Shingaki et al., Pimenta Amaral et al., Brown et al., and Sparano et al.16,17,24,29
Another strong predictor for SLNM in our study was a dissolute growth pattern at the infiltrating tumor front, with PPV of 83.3% and odds ratio of 75. The histologic assess-ment and classification of the mode of invasion is not easy and warrants effort and experience from the pathologists. In our study grades 1, 2, and 3 were pooled as a low-risk group, in contrast to grade 4 as a high-risk group. Only 3 out of 48 (6.25%) patients in the low-risk group, but 25 out of 30 (83.33%) patients of the high-risk group, revealed SLNM. This result is in agreement with the original description by Yamamoto et al., and underlines the accuracy of the clas-sification system for MOI.19 Various other studies by Kurokawa et al., Osaki et al., Nagata et al., and Okamoto et al. came to the same conclusions.21,39–41Further statis-tical analysis of the significant parameters GOD, LI, and MOI showed a clear interdependency of these three
parameters, which means that patients with poorly differ-entiated SCC have a higher likelihood of a dissolute, and therefore more aggressive, infiltration pattern, and likewise a higher probability of lymphatic infiltration, which in summary ends up in a significantly higher rate of SLNM.
None of the other histomorphologic parameters assessed in our study were significantly predictive for SLNM. For the parameter perineural invasion this result is in contradiction with some studies.22,24,29,33,35,42 However, it is in agree-ment with quite a number of other studies.15,17,23,31,37The parameter vascular invasion is also reported controversially in the literature. As in our study, many others failed to reveal a significant predictive value.15,23,27,35,43 However, others were able to do so.16,17,21,22,29,33,42For the parameter muscle invasion there is only the report by Pimenta Amaral et al. showing an association with nodal metastases.17The reports for the parameter lymphoplasmacytic infiltration are again controversial in the literature. Some reports support its predictive value.16,44However, more do not.15,31,33,35In summary, none of the parameters perineural invasion, vascular invasion, muscle invasion, or lymphoplasmacytic infiltration can be used as a predictive factor for occult nodal disease.
In contradiction to the results published for elective neck dissections neither tumor thickness nor tumor depth was significantly associated with SLNM.14–16,20–33There was no linear correlation between increasing tumor thickness or tumor depth and the rate of SLNM. It is widely accepted that elective neck treatment is justified if the risk of occult dis-ease exceeds 15–20%. For this reason, Ambrosch et al. and Kurokawa et al. suggested a cutoff value of 4 mm, and Kane et al. and Fukano et al. of 5 mm for tumor depth.14,15,20,25 Accordingly, tumors with an infiltration depth of 4 or 5 mm, respectively, and more should be treated with elective neck dissection, whereas for thinner tumors a wait-and-watch policy can be advocated. In our study, for the parameter tumor depth even a cutoff value of 1 mm reached only a NPV of 75%. For tumor thickness the NPV was 100% for the cutoff value of 2 mm, but only 80% for 3 mm. This means that also patients with very thin and superficial tumors should undergo elective neck treatment due to a significant risk for occult disease. Statistical analysis with ROC curves clearly showed that neither of the two values (tumor depth or tumor thickness) can be used as a reliable predictor for occult disease. This result not only stands in contradiction to the previously published results in the context of elective neck dissection, but also in contradiction to the reports in the context of SNB by Alkureishi et al. and Bilde et al.47,48In the study by Alkureishi et al. tumors up to stage T4and oropharyngeal tumors with significantly higher
values of tumor depth were included.48 The mean tumor depth was 7.85 mm with a wide range of 1–28 mm, whereas the corresponding values in our study achieved 6.45 mm
and 0.72–15.15 mm, respectively. As in their manuscript the risk for occult disease for oral cavity SCC exceeds 20% at a cutoff value of 5 mm, the authors suggest a cutoff of 5 mm as reasonable. Unfortunately, no NPV are calculated. The authors, however, admit that none of the examined cutoff values reaches a satisfactory sensitivity and speci-ficity. In the study by Bilde et al. the mean values for tumor thickness and tumor depth were comparable to ours.47The incidence of nodal metastases as published in the erratum was 58% for tumors thicker or deeper infiltrating than 4 mm. Therefore, the authors conclude a cutoff of 4 mm to be reliable. Unfortunately, no statistics are given for other cutoff values, which renders comparison with our study difficult.
CONCLUSION
In this study, we were able to assess all clinical and histomorphologic parameters of primary tumors in the oral cavity potentially predictive for the occurrence of occult disease within the context of SNB. GOD, LI, and MOI showed a statistically significant correlation with the appearance of SLNM. Therefore, patients with poorly differentiated tumors, lymphatic infiltration, and dissolute tumor pattern at the infiltrating tumor front have a high likelihood of SLNM. Patients with LI and a dissolute MOI might benefit from upfront elective neck dissection due to the very high likelihood of occult disease in the SNB.
Increasing tumor thickness and tumor depth showed no correlation with the rate of SLNM and no statistically significant prediction of occult disease. Therefore, these two parameters and their different cutoff values should not be used for the decision to treat the neck electively or not. Patients with early SCC of the oral cavity should undergo SNB for accurate staging of the cN0neck irrespective of
the values of tumor thickness and tumor depth.
ACKNOWLEDGMENT We are grateful to Norbert Wey for technical support and to Marianne Tinguely, MD for the review of the histological specimens.
REFERENCES
1. Kalnins IK, Leonard AG, Sako K, Razack MS, Shedd DP. Cor-relation between prognosis and degree of lymph node involve-ment in carcinoma of the oral cavity. Am J Surg. 1977;134(4): 450–4.
2. Barrs DM, DeSanto LW, O’Fallon WM. Squamous cell carci-noma of the tonsil and tongue-base region. Arch Otolaryngol. 1979;105(8):479–85.
3. Callery CD, Spiro RH, Strong EW. Changing trends in the management of squamous carcinoma of the tongue. Am J Surg. 1984;148(4):449–54.
4. Grandi C, Alloisio M, Moglia D, Podrecca S, Sala L, Salvatori P, Molinari R. Prognostic significance of lymphatic spread in head
and neck carcinomas: therapeutic implications. Head Neck Surg. 1985;8(2):67–73.
5. Byers RM, Wolf PF, Ballantyne AJ. Rationale for elective modified neck dissection. Head Neck Surg. 1988;10(3):160–7. 6. van den Brekel MW, van der Waal I, Meijer CJ, Freeman JL,
Castelijns JA, Snow GB. The incidence of micrometastases in neck dissection specimens obtained from elective neck dissec-tions. Laryngoscope. 1996;106(8):987–91.
7. Krag DN, Weaver DL, Alex JC, Fairbank JT. Surgical resection and radiolocalization of the sentinel lymph node in breast cancer using a gamma probe. Surg Oncol. 1993;2(6):335–9.
8. Morton DL, Wen DR, Wong JH, Economou JS, Cagle LA, Storm FK, et al. Technical details of intraoperative lymphatic mapping for early stage melanoma. Arch Surg. 1992;127(4):392–9. 9. Stoeckli SJ. Sentinel node biopsy for oral and oropharyngeal
squamous cell carcinoma of the head and neck. Laryngoscope. 2007;117(9):1539–51.
10. Shoaib T, Soutar DS, Prosser JE, Dunaway DJ, Gray HW, McCurrach GM, et al. A suggested method for sentinel node biopsy in squamous cell carcinoma of the head and neck. Head Neck. 1999;21(8):728–33.
11. Ross GL, Shoaib T, Soutar DS, MacDonald DG, Camilleri IG, Bessent RG, et al. The First International Conference on Sentinel Node Biopsy in Mucosal Head and Neck Cancer and adoption of a multicenter trial protocol. Ann Surg Oncol. 2002;9(4):406–10. 12. Greene FL, Page DL, Fleming ID, Fritz AG, Balch CM, Haller DG, et al. AJCC cancer staging handbook, 6th ed. New York: Springer; 2002.
13. Stoeckli SJ, Steinert H, Pfaltz M, Schmid S. Sentinel lymph node evaluation in squamous cell carcinoma of the head and neck. Otolaryngol Head Neck Surg. 2001;125(3):221–6.
14. Ambrosch P, Kron M, Fischer G, Brinck U. Micrometastases in carcinoma of the upper aerodigestive tract: detection, risk of metastasizing, and prognostic value of depth of invasion. Head Neck. 1995;17(6):473–9.
15. Kane SV, Gupta M, Kakade AC, D’ Cruz A. Depth of invasion is the most significant histological predictor of subclinical cervical lymph node metastasis in early squamous carcinomas of the oral cavity. Eur J Surg Oncol. 2006;32(7):795–803.
16. Shingaki S, Suzuki I, Nakajima T, Kawasaki T. Evaluation of histopathologic parameters in predicting cervical lymph node metastasis of oral and oropharyngeal carcinomas. Oral Surg Oral Med Oral Pathol. 1988;66(6):683–8.
17. Pimenta Amaral TM, Da Silva Freire AR, Carvalho AL, Pinto CA, Kowalski LP. Predictive factors of occult metastasis and prognosis of clinical stages I and II squamous cell carcinoma of the tongue and floor of the mouth. Oral Oncol. 2004;40(8):780–6. 18. Brandwein-Gensler M, Teixeira MS, Lewis CM, Lee B, Rol-nitzky L, Hille JJ, et al. Oral squamous cell carcinoma: histologic risk assessment, but not margin status, is strongly predictive of local disease-free and overall survival. Am J Surg Pathol. 2005;29(2):167–78.
19. Yamamoto E, Miyakawa A, Kohama G. Mode of invasion and lymph node metastasis in squamous cell carcinoma of the oral cavity. Head Neck Surg. 1984;6(5):938–47.
20. Kurokawa H, Zhang M, Matsumoto S, Yamashita Y, Tomoyose T, Tanaka T, et al. The high prognostic value of the histologic grade at the deep invasive front of tongue squamous cell carci-noma. J Oral Pathol Med. 2005;34(6):329–33.
21. Kurokawa H, Yamashita Y, Takeda S, Zhang M, Fukuyama H, Takahashi T. Risk factors for late cervical lymph node metastases in patients with stage I or II carcinoma of the tongue. Head Neck. 2002;24(8):731–6.
22. Woolgar JA, Scott J. Prediction of cervical lymph node metas-tasis in squamous cell carcinoma of the tongue/floor of mouth. Head Neck. 1995;17(6):463–72.
23. Lim SC, Zhang S, Ishii G, Endoh Y, Kodama K, Miyamoto S, et al. Predictive markers for late cervical metastasis in stage I and II invasive squamous cell carcinoma of the oral tongue. Clin Cancer Res. 2004;10(1 Pt 1):166–72.
24. Brown B, Barnes L, Mazariegos J, Taylor F, Johnson J, Wagner RL. Prognostic factors in mobile tongue and floor of mouth carcinoma. Cancer. 1989;64(6):1195–202.
25. Fukano H, Matsuura H, Hasegawa Y, Nakamura S. Depth of invasion as a predictive factor for cervical lymph node metastasis in tongue carcinoma. Head Neck. 1997;19(3):205–10.
26. Okamoto M, Nishimine M, Kishi M, Kirita T, Sugimura M, Nakamura M, et al. Prediction of delayed neck metastasis in patients with stage I/II squamous cell carcinoma of the tongue. J Oral Pathol Med. 2002;31(4):227–33.
27. Po Wing Yuen A, Lam KY, Lam LK, Ho CM, Wong A, Chow TL, et al. Prognostic factors of clinically stage I and II oral tongue carcinoma-A comparative study of stage, thickness, shape, growth pattern, invasive front malignancy grading, Martinez-Gimeno score, and pathologic features. Head Neck. 2002;24(6):513–20. 28. Mohit-Tabatabai MA, Sobel HJ, Rush BF, Mashberg A. Relation
of thickness of floor of mouth stage I and II cancers to regional metastasis. Am J Surg. 1986;152(4):351–3.
29. Sparano A, Weinstein G, Chalian A, Yodul M, Weber R. Mul-tivariate predictors of occult neck metastasis in early oral tongue cancer. Otolaryngol Head Neck Surg. 2004;131(4):472–6. 30. Warburton G, Nikitakis NG, Roberson P, Marinos NJ, Wu T, Sauk
JJ Jr, et al. Histopathological and lymphangiogenic parameters in relation to lymph node metastasis in early stage oral squamous cell carcinoma. J Oral Maxillofac Surg. 2007;65(3):475–84. 31. Asakage T, Yokose T, Mukai K, Tsugane S, Tsubono Y, Asai M,
Ebihara S. Tumor thickness predicts cervical metastasis in patients with stage I/II carcinoma of the tongue. Cancer. 1998;82(8): 1443–8.
32. Spiro RH, Huvos AG, Wong GY, Spiro JD, Gnecco CA, Strong EW. Predictive value of tumor thickness in squamous carcinoma confined to the tongue and floor of the mouth. Am J Surg. 1986;152(4):345–50.
33. Martı´nez-Gimeno C, Rodrı´guez EM, Vila CN, Varela CL. Squamous cell carcinoma of the oral cavity: a clinicopathologic scoring system for evaluating risk of cervical lymph node metastasis. Laryngoscope. 1995;105(71):728–33.
34. Wenzel S, Sagowski C, Kehrl W, Metternich FU. Retrospective analysis of the prognostic significance of depth of invasion of advanced oral and oropharyngeal squamous cell carcinomas with lymph node metastases. HNO. 2004;52(7):604–10.
35. Morton RP, Ferguson CM, Lambie NK, Whitlock RM. Tumor thickness in early tongue cancer. Arch Otolaryngol Head Neck Surg. 1994;120(7):717–20.
36. Lopes MA, Nikitakis NG, Reynolds MA, Ord RA, Sauk J Jr. Biomarkers predictive of lymph node metastases in oral squa-mous cell carcinoma. J Oral Maxillofac Surg. 2002;60(2):142–7. 37. Byers RM, El-Naggar AK, Lee YY, Rao B, Fornage B, Terry NH, et al. Can we detect or predict the presence of occult nodal metastases in patients with squamous carcinoma of the oral tongue? Head Neck. 1998;20(2):138–44.
38. Chen RB, Suzuki K, Nomura T, Nakajima T. Flow cytometric analysis of squamous cell carcinomas of the oral cavity in relation to lymph node metastasis. J Oral Maxillofac Surg. 1993;51(4): 397–401.
39. Osaki T, Hirota J, Yoneda K, Yamamoto T, Ueta E. Clinical and histopathologic characteristics of tongue and gingiva carcinomas with occult and clinically evident cervical lymph-node metasta-sis. Int J Oral Maxillofac Surg. 1996;25(4):274–8.
40. Nagata T, Schmelzeisen R, Mattern D, Schwarzer G, Ohishi M. Application of fuzzy inference to European patients to predict cervical lymph node metastasis in carcinoma of the tongue. Int J Oral Maxillofac Surg. 2005;34(2):138–42.
41. Okamoto M, Ozeki S, Watanabe T, Iida Y, Tashiro H. Cervical lymph node metastasis in carcinoma of the tongue Correlation between clinical and histopathological findings and metastasis. J Craniomaxillofac Surg. 1988;16(1):31–4.
42. Kowalski LP, Bagietto R, Lara JR, Santos RL, Tagawa EK, Santos IR. Factors influencing contralateral lymph node metas-tasis from oral carcinoma. Head Neck. 1999;21(2):104–10. 43. Odell EW, Jani P, Sherriff M, Ahluwalia SM, Hibbert J, Levison
DA, et al. The prognostic value of individual histologic grading parameters in small lingual squamous cell carcinomas. The importance of the pattern of invasion. Cancer. 1994;74(3):789–94. 44. Noone RB, Bonner H Jr, Raymond S, Brown AS, Graham WP III, Lehr HB. Lymph node metastases in oral carcinoma. A correlation of histopathology with survival. Plast Reconstr Surg. 1974;53(2): 158–66.
45. Ambrosch P, Brinck U. Detection of nodal micrometastases in head and neck cancer by serial sectioning and immunostaining. Oncology (Williston Park). 1996;10(8):1221–6.
46. Hermanek P, Hutter RV, Sobin LH, Wittekind C. International Union Against Cancer Classification of isolated tumor cells and micrometastasis. Cancer. 1999;86(12):2668–73.
47. Bilde A, von Buchwald C, Therkildsen MH, Mortensen J, Kirk-egaard J, Charabi B, et al. Need for intensive histopathologic analysis to determine lymph node metastases when using sentinel node biopsy in oral cancer. Laryngoscope. 2008;118(3):408–14. 48. Alkureishi LW, Ross GL, Shoaib T, Soutar DS, Robertson AG, Sorensen JA, et al. Does tumor depth affect nodal upstaging in squamous cell carcinoma of the head and neck? Laryngoscope. 2008;118(4):629–34.