HAL Id: hal-00316861
https://hal.archives-ouvertes.fr/hal-00316861
Submitted on 1 Jan 2001
HAL is a multi-disciplinary open access
archive for the deposit and dissemination of
sci-entific research documents, whether they are
pub-lished or not. The documents may come from
teaching and research institutions in France or
abroad, or from public or private research centers.
L’archive ouverte pluridisciplinaire HAL, est
destinée au dépôt et à la diffusion de documents
scientifiques de niveau recherche, publiés ou non,
émanant des établissements d’enseignement et de
recherche français ou étrangers, des laboratoires
publics ou privés.
Observation of low frequency electromagnetic activity at
1000 km altitude
N. Ivchenko, G. Marklund
To cite this version:
N. Ivchenko, G. Marklund. Observation of low frequency electromagnetic activity at 1000 km altitude.
Annales Geophysicae, European Geosciences Union, 2001, 19 (6), pp.643-648. �hal-00316861�
Annales
Geophysicae
Observation of low frequency electromagnetic activity
at 1000 km altitude
N. Ivchenko and G. Marklund
Alfv´en Laboratory, Royal Institute of Technology, Stockholm, Sweden
Received: 26 July 2000 – Revised: 21 November 2000 – Accepted: 28 November 2000
Abstract. We present a statistical study of low frequency fluctuations of electric and magnetic fields, commonly in-terpreted as Alfv´enic activity. The data base consists of six months of electric and magnetic field measurements by the Astrid-2 microsatellite. The occurrence of the events is stud-ied with respect to the location and general activity. Large regions of broadband Alfv´enic activity are persistently ob-served in the cusp/cleft and, during the periods of high geo-magnetic activity, also in the pre-midnight sector of the au-roral oval.
Key words. Ionosphere (auroral ionosphere) – Space plasma physics (waves and instabilities) – Magnetospheric physics (magnetosphere-ionosphere interactions)
1 Introduction
Fluctuations of electric and magnetic fields with frequencies below the local ion cyclotron frequency represent a common feature of the auroral zone plasma and have been observed by sounding rockets (e.g. Gelpi and Bering, 1984; Ivchenko et al., 1999) and satellites (e.g. Berthelier et al., 1988; Du-binin et al., 1990; Louarn et al., 1994; Chaston et al., 1999) over almost three decades. The fluctuations in the transverse components of δE and δB are often correlated. This fact can be explained either in terms of stationary magnetic field aligned current structures closing by Pedersen currents in the inonosphere, or as a signature of Alfv´en waves. The ratio of
δE/δBis used to distinguish between the two possibilities. For conductivity-controlled structures it is 1/µ06P, where
6P is the height-integrated Pedersen conductivity, while for
propagating Alfv´en waves, the ratio is roughly a measure of the Alfv´en speed, VA(Aikio et al., 1996). Interfering Alfv´en
waves may produce other values for the ratio and complicate the phase relations between δE and δB.
The Alfv´enic nature of the low frequency electromagnetic fluctuations in the auroral ionosphere has been established in
Correspondence to: N. Ivchenko ([email protected])
a number of studies, and several classes of models have been developed to account for generation and propagation of the waves and their interaction with the ionosphere (see a com-prehensive review of observations and theories by Stasiewicz et al., 2000). Despite the effort, there is still no general con-sensus as to the spatial and temporal structure of the events. Furthermore, it seems that several regimes of the waves may exist in different parts of the auroral region.
This paper reports on the low frequency fluctuations of electric and magnetic fields observed in the auroral iono-sphere by the Swedish Astrid-2 microsatellite at 1000 km altitude during the first half of 1999.
2 Data
The Astrid-2 microsatellite was launched on 11 December 1998 into a circular 1000 km altitude orbit with 83◦ inclina-tion. Scientific data collection was carried out between 11 January and 24 July 1999, when the contact with the satellite was lost. Among other instruments onboard Astrid-2 was the EMMA electric and magnetic field instrument. The instru-ment provided simultaneous measureinstru-ments of three compo-nents of the magnetic field and two compocompo-nents (in the spin plane) of the electric field. Three modes with different time resolution were available: 16, 256 and 2048 samples per sec-ond. The latter mode was memory extensive, and thus, could be used only occasionally.
The electric and magnetic field data were despun and con-verted into geophysical coordinates. Two coordinate systems are used in this study: the “magnetic field spin plane” tem (msp) and the “magnetic field - east - equatorward” sys-tem (mee). In the former, the e3mspaxis is in the direction
of the spin axis, e1msp is in the spin plane along the
pro-jection of the magnetic field in the spin plane, and e2msp
completes the right-handed set, being perpendicular to B. In the mee coordinate, e1mee is along the model magnetic
field, e2meeis in the eastward direction, defined as the
644 N. Ivchenko and G. Marklund: Observation of low frequency electromagnetic activity at 1000 km altitude
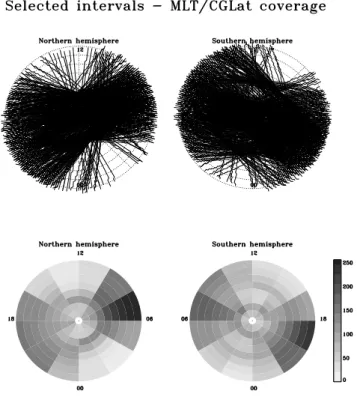
Fig. 1. Orbit intervals selected for the study.
and B is the model magnetic field, and e3meecompletes the
right-handed set. Using two systems is necessary because the electric field is measured only in the spin plane. Two compo-nents, E1mspand E2mspare measured and some assumption
has to be made concerning the third component. Since it is known that the electric field normally has a much larger com-ponent in the direction perpendicular to the magnetic field than along it, a natural assumption to make is that E · B = 0. The component of E perpendicular to B and E2mspcan thus
be calculated as E1⊥ = E1msp/sin α, where α is the angle
between the spin plane and B. This poses a natural problem when α ≈ 0. In addition, for small values of α, disturbances related to the satellite influence on the measurements are seen in E1msp, so only one component of the electric field can be
measured reliably (Ivchenko et al., 2001). It should be kept in mind that the reliable transformation of E into the mee coordinates is only possible for α being far from zero.
For this study we selected 1035 passages of the satellite at high latitudes (over 50◦corrected geomagnetic latitude) from January to June 1999. Figure 1 shows the orbit tracks of the selected intervals in magnetic local time and corrected geo-magnetic latitude, and the coverage of various MLT-CGL at regions in both hemispheres. In six month the orbital plane of the satellite made almost one complete rotation in local time, so we have a rather complete coverage of all local time sec-tors in both hemispheres. Due to technical problems on the satellite, the data collection was not continous in January and March 1999, which resulted in a smaller number of selected passages near the noon-midnight meridian.
To identify the events, a windowed Fourier transform (win-dow length 4 seconds) was performed on the data (win-
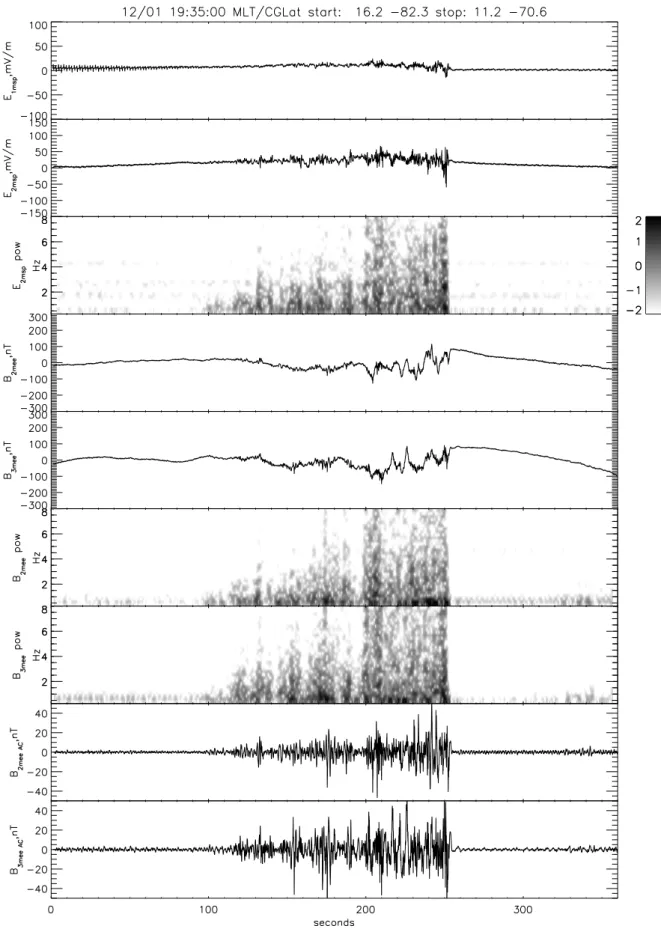
downsam-pled to 16 samples/second resolution for uniformity. An ex-ample of the data, together with the spectra, is presented in Fig. 2. Intervals with enhanced power between 0.5 Hz and 8 Hz in the spectrum of E2mspwere selected. The E2msp
com-ponent of the electric field was used as it has the same qual-ity independent of the angle between B and the spin plane. The events where the enhanced spectral power was caused by outliers were excluded from the data base.
3 Occurrence of the low frequency electromagnetic activity
Over 7000 intervals with E2mspfluctuations with frequencies
between 0.5 Hz and 8 Hz have been identified. The enhanced spectral power in the electric field was continually associated with magnetic field fluctuations. The fluctuations of the mag-netic field were perpendicular to the background magmag-netic field. Estimates of the δE/δB ratio were made considering the ratios of the spectral powers of the perpendicular compo-nents of δE and δB. This is a coarse estimate, providing no phase information. The ratios generally range between 5·105 and 5 · 106m/s, which is consistent with the expected values of Alfv´en velocity for the altitude of the observations. Corre-sponding Pedersen conductivities would be between 0.1 and 1 S, thus lower than the values expected for the ionospheric conductivities. The ratio is higher in the winter hemisphere than in the sunlit one, as would be expected considering the seasonal density fluctuations (see Fig. 3). Altogether this indicates the fluctuations are of Alfv´enic nature, rather than stationary field-aligned currents.
Disturbance intervals of different lengths were found, rang-ing from seconds to tens and even hundreds of seconds. The longest interval for which electromagnetic field fluctuations of varying strength were continuously observed was 414 sec-onds (which correspsec-onds to about 3000 km along the or-bit). This event was detected in the dayside auroral zone at 02:52–59 UT on 18 February 1999, shortly after a solar wind discontinuity reached the magnetosphere. The discon-tinuity was associated with a solar wind velocity increase from 400 km/s to over 600 km/s and the interplanetary mag-netic field Bzcomponent reaching below −25 nT. The cases
where electromagnetic field disturbances were observed dur-ing long time intervals along the orbit have all been found to have a similar appearance; an example of which is shown in Fig. 2. Irregular fluctuations in both electric and mag-netic fields are present with a falling frequency spectrum. The amplitudes of the electric field fluctuations occasion-ally reach 200–300 mV/m, but a more typical value is be-low 100 mV/m. The electric field waveform often shows a finer structure than that of the magnetic field, which results in the steeper fall of the δB frequency spectrum than that of the δE. It is rather difficult to single out separate events in the turbulence.
On the other hand, the short intervals of the δE spectral power enhancement show a broad variety of the fluctuations. The spectra are often structured, having one or several peaks
Fig. 2. An example of an extended period of low frequency electromagnetic turbulence. Panels from top to bottom present two components
of E in the msp coordinates, spectrum of E1msp, two components of B perpendicular to the backgound magnetic field in the mee coordinates with spectra of the signals, and high pass filtered B2meeand B3mee.
646 N. Ivchenko and G. Marklund: Observation of low frequency electromagnetic activity at 1000 km altitude
Fig. 3. Estimates of δE/δB ratio vs magnetic local time for selected events. Each point corresponds to a ratio of spectral powers above
0.5 Hz in perpendicular components (for |α| > 20 δE2mee/δB3meeand δE3mee/δB2mee, and for |α| < 20 δE2msp/δB3msp). Left panel
presents cases from January and February, and the right panel cases from May and June. The points from the southern hemisphere are plotted with a negative sign. Larger and more scattered values are observed in the winter hemisphere as compared to the summer one, and in at MLTs around midnight as compared to midday. The different and incomplete MLT coverage in the hemispheres is due to the orbital characteristics of the spacecraft.
Fig. 4. An example of a localized period of quasiperiodic oscillations. The panels from top to bottom show eastward and southward
Fig. 5. Occurrence pattern of extended regions of Alfv´enic activity.
The upper panels show the location of the regions as traversed by the satellite, the lower panels the normalized observation probability. The panels on the left are for periods of high geomagnetic activity, the panels on the right are for periods of low activity.
in the covered spectral range. While examples of remarkable
δEand δB correlations are seen occasionally, as in the train of linearly polarized oscillations seen in the dayside auroral oval shown in Fig. 4, the fluctuations are often less regular. The correlation between the electric and magnetic fields is generally better than in the extended turbulent regions. The amplitudes of the disturbances are lower than those in the extended regions of turbulence, typically of the order of 10– 50 mV/m in the electric field.
To study the occurrence of the electromagnetic fluctua-tions, we binned all the data into two subdatabases corre-sponding to high and low geomagnetic activity (KP >3 and
KP <3, respectively). The occurrence of the extended
in-tervals of Alfv´enic activity is shown in Fig. 5 and the occur-rence of the short periods of electromagnetic fluctuations is shown in Fig. 6. It is seen that for both low and high activ-ity the extended periods of Alfv´enic turbulence are observed with a high probability (maximum over 70%) in the day-side cusp/cleft region, with the maximum occurrence lying shifted somewhat to the prenoon sector. For low activities the maximum occurrence shifts to higher geomagnetic lati-tudes, as expected for the cusp/cleft location. Another area of the extended turbulent regions is located in the nightside auroral oval. Here the fluctuations are less common, and are observed only for high activity levels. The occurrence of the short intervals of fluctuations is lower, and follows the statis-tical auroral oval for both low and high activity levels,
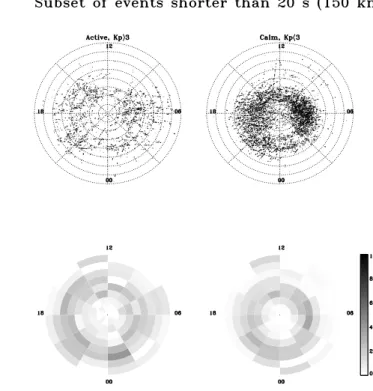
com-Fig. 6. Occurrence pattern of short intervals of Alfv´enic activity.
The upper panels show the location of the regions as traversed by the satellite, the lower panels the normalized observation probability. The panels on the left are for periods of high geomagnetic activity, the panels on the right are for periods of low activity.
ing to lower geomagnetic latitudes in the latter case. No clear locations of maxima can be seen.
4 Summary
Electric field fluctuations with frequencies between 0.5 and 8 Hz are commonly observed by the Astrid-2 microsatellite at 1000 km altitude. The associated magnetic field distur-bances suggest that the fluctuations are of the Alfv´enic na-ture. A variety of different waveforms are seen, with differ-ent degrees of correlation between the electric and magnetic fields. The events characterized by extended intervals of tur-bulence longer than tens of seconds have certain similarities. They show irregular fluctuations in both δE and δB, some-times rather poorly correlated. The amplitudes of the electric field reach up to 200–300 mV/m. The extended regions with fluctuations have a high occurrence in the dayside cusp/cleft region (in agreement with findings of Berthelier et al. (1988) based on a smaller database), suggesting the electromagnetic activity is present in large spatial areas, at least hundreds of kilometers across. During periods of high geomagnetic ac-tivity, they are also observed in the nightside auroral oval, though with a somewhat lower probability. Both the cusp and the nightside oval during disturbed periods are the re-gions of large energy and plasma influx into the ionosphere. Similarities in the fluctuations seen in both regions suggest
648 N. Ivchenko and G. Marklund: Observation of low frequency electromagnetic activity at 1000 km altitude that it stems from this energy, even though the sources of
plasma and physical mechanisms at play are essentially dif-ferent at the dayside and at the nigthside. The short intervals of electromagnetic fluctuation, corresponding to more local-ized regions, are less uniform in appearance, and probably represent a number of different classes of phenomena. Hav-ing smaller amplitudes, they typically show a better correla-tion of δE and δB. The short bursts or localized regions of Alfv´enic activity are rather uniformly spread along the auro-ral oval.
Acknowledgement. Topical Editor G. Chanteur thanks T. Chust and
another referee for their help in evaluating this paper.
References
Aikio, A.T., Blomberg, L. G., Marklund, G. T., and Yamauchi, M., On the origin of the high-altitude electric field fluctuations in the auroral zone, J. Geophys. Res., 101, 27157–27170, 1996. Berthelier, J.-J., Machard, C., Cerisier, J.-C., Berthelier, A., and
Bosqued, J. M., ULF electromagnetic turbulence in the high-latitude topside ionosphere, J. Geophys. Res., 93, 5701–5712,
1988.
Chaston, C. C., Carlson, C. W., Peria, W. J., Ergun, R. E., and Mc-Fadden, J. P., FAST observations of inertial Alfv´en waves in the dayside aurora, Geophys. Res. Lett., 26, 647–650, 1999. Dubinin, E. M., Israelevich, P. L., and Nikolaeva, N. S.,
Auro-ral electromagnetic disturbances at an altitude of 900 km: the relationship between the electric and magnetic field variations, Planet. Spa. Sci., 38, 97–108, 1990.
Gelpi, C. G. and Bering, E. A., The plasma wave environment of an auroral arc, 2. ULF waves on an auroral arc boundary, J. Geo-phys. Res., 89, 10847–10864, 1984.
Ivchenko, N., Marklund, G., Lynch, K., Pietrowski, D., Torbert, R., Primdahl, F., and Ranta, A., Quasiperiodic oscillations observed at the edge of an auroral arc by Auroral Turbulence 2, Geophys. Res. Lett., 26, 3365–3368, 1999.
Ivchenko, N., Facciolo, L., Lindqvist, P. A., Kekkonen, P., and Holback, B., Disturbance of plasma environment in the vicinity of the Astrid-2 microsatellite, Ann. Geophysicae, 19, 655–666, 2001 (this issue).
Louarn et al., Observation of kinetic Alfv´en waves by the Freja spacecraft, Geophys. Res. Lett., 21, 1847–1850, 1994.
Stasiewicz, K. et al., Small scale Alfv´enic structure in the aurora, Space Sci. Rev., 92, 423–533, 2000.