HAL Id: hal-00514544
https://hal.archives-ouvertes.fr/hal-00514544
Submitted on 31 Jul 2020
HAL is a multi-disciplinary open access
archive for the deposit and dissemination of
sci-entific research documents, whether they are
pub-lished or not. The documents may come from
teaching and research institutions in France or
abroad, or from public or private research centers.
L’archive ouverte pluridisciplinaire HAL, est
destinée au dépôt et à la diffusion de documents
scientifiques de niveau recherche, publiés ou non,
émanant des établissements d’enseignement et de
recherche français ou étrangers, des laboratoires
publics ou privés.
eastern Mediterranean Sea in winter : link to
hydrodynamism and nutrients
Michel Denis, Melilotus Thyssen, V. Martin, B. Manca, F. Vidussi
To cite this version:
Michel Denis, Melilotus Thyssen, V. Martin, B. Manca, F. Vidussi. Ultraphytoplankton basin-scale
distribution in the eastern Mediterranean Sea in winter : link to hydrodynamism and nutrients.
Bio-geosciences, European Geosciences Union, 2010, 7 (7), pp.2227-2244. �10.5194/bg-7-2227-2010�.
�hal-00514544�
Biogeosciences, 7, 2227–2244, 2010 www.biogeosciences.net/7/2227/2010/ doi:10.5194/bg-7-2227-2010
© Author(s) 2010. CC Attribution 3.0 License.
Biogeosciences
Ultraphytoplankton basin-scale distribution in the eastern
Mediterranean Sea in winter: link to hydrodynamism and nutrients
M. Denis1, M. Thyssen1, V. Martin1, B. Manca2, and F. Vidussi3,*1Laboratoire de Microbiologie, G´eochimie et Ecologie Marines, Universit´e de la M´editerran´ee, CNRS UMR 6117, 163
avenue de Luminy, Case 901, 13288 Marseille cedex 9, France
2Istituto Nazionale di Oceanografia e Geofisica Sperimentale – OGS, Borgo Grotta Gigante, 42/c, 34010 Sgonico (Trieste),
Italy
3Laboratoire d’Oc´eanographie de Villefranche, CNRS UMR 7093, Universit´e de Paris VI, quai de la Darse, B.P. 28, 06234
Villefranche-sur-mer cedex, France
*present address: Ecosyst`emes lagunaires, CNRS, UMR 5119, Universit´e Montpellier II, CP 093, Place Bataillon, 34095
Montpellier cedex 5, France
Received: 12 May 2009 – Published in Biogeosciences Discuss.: 13 July 2009 Revised: 22 June 2010 – Accepted: 4 July 2010 – Published: 20 July 2010
Abstract. The basin-scale distribution of ultraphytoplankton
(<10 µm) was determined in the upper 200 m of the eastern Mediterranean Sea during the winter season. Four clusters were resolved by flow cytometry on the basis of their op-tical properties and identified as Synechococcus,
Prochloro-coccus, pico- (<3 µm) and nanoeukaryotes (3–10 µm). Syne-chococcus was the most abundant population (maximum
abundance of about 37 000 cells cm−3)and contributed up to 67.7% to the overall ultraphytoplanktonic carbon biomass, whereas the contribution of Prochlorococcus never exceeded 6.5%. The maximum integrated carbon biomass was 1763, 453, 58 and 571 mg C m−2for nanoeukaryotes, picoeukary-otes, Prochlorococcus and Synechococcus respectively. Wa-ter mass properties were analyzed on the basis of temper-ature and salinity distributions in order to account for the general circulation and locate the main hydrodynamic struc-tures (fronts, gyres, transition between western and eastern basins). The effect of the main hydrodynamic structures and nutrients on the ultraphytoplankton distribution was in-vestigated. No positive correlation between nutrients and phytoplankton could be established when considering large scales. However, below 50 m depth, nutrient ratios between particular stations were correlated to corresponding density ratios. In contrast, significant relationships were found
be-Correspondence to: M. Denis
tween Synechococcus abundance and density, resulting from the impact of a gyre in southern Adriatic basin and a ther-mohaline front in the Ionian basin. A significant relationship was also found between picoeukaryotes and salinity in the comparison of western and eastern Mediterranean Sea.
1 Introduction
Hydrodynamism in the oceans is known to affect phyto-plankton distribution. In particular, meso-scale hydrody-namic structures such as fronts, eddies and gyres control the biomass and primary production (McGillicuddy et al., 1998) as well as phytoplankton composition (e.g. Rodriguez et al., 2001; Vidussi et al., 2001). Hydrodynamic struc-tures and circulation can influence directly via vertical mo-tion the phytoplankton size structure (Rodriguez et al., 2001). At the same time hydrodynamic structures drive nutrients or modify the light environment and thus indirectly con-trol phytoplankton biomass and composition (Vidussi et al., 2001). The Mediterranean Sea is an ideal region to study physical-biological relationships as different hydrodynamic structures (mesoscale of 10–100 km) occur at relative small scales which can be simultaneously sampled for physical and biological parameters (Claustre et al., 1994; Rodriguez et al., 2001; Vidussi et al., 2001).
The general Mediterranean circulation is characterized by an inflow of Atlantic Water (AW) at surface and a non re-turn westward deeper flow of the dominant water mass of the Mediterranean Sea, the Levantine Intermediate Water (LIW), into the Atlantic Ocean (W¨ust, 1961). As a consequence the Mediterranean Sea is potentially oligotrophic because of the inflow of generally nutrient poor Atlantic surface waters. However, the LIW is known to play an important role in transporting inorganic nutrients around the basin and further on in the Atlantic Ocean (B´ethoux, 1979). In fact the LIW affects wintertime dense water formation processes both in the eastern and western basin (Schlitzer et al., 1991; Leaman and Schott, 1991), creating conditions of vertical transfer of nutrient-rich intermediate/deep waters close to the surface for the biological consumption. This is the case for example of the north western Mediterranean Sea where deep convec-tion occurs during winter followed by spring phytoplankton bloom and further by oligotrophy in summer (Marty et al., 2002). At the same time, in the eastern Mediterranean Sea the thermohaline circulation and physical processes estab-lish conditions of low nutrient concentration and low primary production (Azov, 1986; Psara et al., 2000; Tselepides et al., 2000). Thus the Mediterranean Sea is considered as ultra-oligotrophic or mesotrophic, depending on the studied area and the season (Berman et al., 1984; Minas et al., 1988; Co-nan et al., 1998, Krom et al., 2003, 2005). However, among the different Mediterranean Sea regions, the eastern Mediter-ranean Sea is by far the most oligotrophic region. The gen-eral circulation of the eastern Mediterranean Sea has been intensively investigated by the POEM group (1992), which provided evidence of different scales, dynamics and vari-abilities. Four main regions may be distinguished, i.e. the Adriatic, the Ionian, the Aegean and the Levantine basins, which exhibit different hydrodynamic regimes and processes that have been revealed important for biological and chemi-cal dynamics. Superimposed to the basin-wide thermohaline cell circulation at surface, permanent and/or recurrent sub-basin scale gyres exist. These gyres isolate water masses and therefore, they have a large impact on phytoplankton devel-opment, such as stimulating it by upward inflows of nutri-ents.
In the eastern Mediterranean Sea, nutrient concentration and primary production can be very low (Azov, 1986; Bonin et al., 1989), as in the Cretan basin (Psara et al., 2000; Tse-lepides et al., 2000), thus several extremely nutrient-poor ar-eas of the ar-eastern Mediterraean Sea are ultra-oligotrophic (Krom et al., 2003, 2005; Thingstad et al., 2005). In ad-dition, phosphorus limitation of phytoplankton and bacteria growth was suggested by Berland et al. (1980) and this was confirmed by several studies (Krom et al., 1991; Vaulot et al., 1996; Zohary and Robarts 1998; van Wambeke et al., 2002; see also a review in Krom et al., 2003). A recent lagrangian in situ P-addition experiment carried out in an ultra-oligotrophic region of the eastern Mediterranean Sea (Krom et al., 2005) showed that bacteria was
convention-ally P-limited and phytoplankton was N and P-co limited (Thingstad et al., 2005; Zohary et al., 2005). In oligotrophic waters, a number of studies have shown that ultraphytoplank-ton (<10 µm) makes the most abundant fraction of phyto-plankton and that it plays a major role in the overall primary production (Li et al., 1993; Platt et al., 1983; Yacobi et al., 1995; Psarra et al., 2000; Vidussi et al., 2001; see also the recent review by Siokou-Frangou et al., 2010). For instance, over 85% of chlorophyll a in the eastern basin belong to the
<10 µm size fraction (Li et al., 1993). This autotrophic ult-raphytoplankton is mainly composed of cyanobacteria, with dominance of Synechococcus over Prochlorococcus (Water-bury et al., 1986; Martin, 1997; Denis et al., 2000; Casotti et al., 2003; Psarra et al., 2005) and of eukaryotes belonging to the group of chlorophyceae, prasinophyceae and prymnesio-phyceae (Vidussi et al., 2001; Psarra et al., 2005).
In this oligotrophic region the hydrodynamic structures may induce nutrient enrichments and stimulate biological ac-tivity with respect to surrounding areas. Consequently, they may play a significant role in the development of phytoplank-ton and largely affect the distribution and structure of ult-raphytoplankton in the eastern Mediterranean Sea (Casotti et al., 2003). The phytoplankton distribution in the east-ern Mediterranean Sea is poorly documented and very frag-mented (Li et al., 1993; Yacobi et al., 1995; Magazzu and De-cembrini 1995, Psarra et al., 2005; see also Siokou-Frangou et al., 2010).
In the present study, we report the first basin-scale dis-tribution of ultraphytoplanktonic cells (<10 µm) determined by flow cytometry over most of the eastern Mediterranean Sea during winter (January 1995). We further analysed this distribution to determine how it could be relatively affected by hydrological structures (gyre, thermohaline front, water masses) and nutrient availability. Results show that hydrol-ogy can preferentially affect large-scale phytoplankton dis-tribution.
2 Materials and methods 2.1 Study area and sampling
Data were collected during the basin-wide R/V METEOR cruise M31/1 (30 December 1994 to 5 February 1995), con-ducted in the frame of the POEM/BC (Physical Oceanogra-phy of the eastern Mediterranean Sea – Biology, Chemistry) and the EU/MAST-MTP (Marine Science and Technology-Mediterranean Targeted Project) of the European Union pro-gramme.
The hydrographic work was conducted over a series of 77 full-depth hydrological stations (Fig. 1), while the ver-tical distribution of ultraphytoplankton in the upper 200 m was determined at selected 47 stations, 4 in the western and 43 in the eastern Mediterranean Sea, (Fig. 1), lowering a SeaBird-911 Plus conductivity-temperature-depth profiler
M. Denis et al.: Ultraphytoplankton in the eastern Mediterranean Sea 2229
34 FIGURES
Fig. 1: Location of the stations samples for flow cytometry during the METEOR cruise M31/1 (30 December 1994 to 5 February 1995) conducted in the Mediterranean Sea in the frame of the POEM/BC (Physical
Oceanography of the eastern Mediterranean Sea – Biology, Chemistry) and the EU/MAST-MTP (Marine Science and Technology-Mediterranean Targeted Project) of the European Union program.
Fig. 1. Location of the stations samples for flow cytometry during the METEOR cruise M31/1 (30 December 1994 to 5 February 1995)
conducted in the Mediterranean Sea in the frame of the POEM/BC (Physical Oceanography of the eastern Mediterranean Sea – Biology, Chemistry) and the EU/MAST-MTP (Marine Science and Technology-Mediterranean Targeted Project) of the European Union program.
(CTD), equipped with a Sea Teach fluorometer, an oxygen sensor and a rosette water sampler of 24 Niskin bottles of 10 dm3. The seawater samples were collected during the
up-cast at selected depths between 0 to 200 m, according to the most important features displayed by the fluorometer profiles during the down-cast. Four vertical profiles were analyzed in the western Mediterranean Sea for the sake of comparison.
2.2 Hydrography
The temperature and salinity data were continuously checked against independent measurements to a precision of ±0.002 performed by digital reversing thermometers and water sam-ple analyses on board using an AUTOSAL Guildline bench salinometer. The overall discrepancies were typically less than ±0.005 units. Through the text, the temperature is given as potential temperature (θ ), the salinity is reported to the practical salinity scale and the density as potential density excess (σ θ ).
The horizontal maps of the hydrographic fields were con-structed by extracting temperature, salinity and density val-ues in the upper 10 m and averaging them on the vertical. The data were objectively analysed on a regular grid of 1/4◦ using an isotropic correlation function (Carter and Robinson, 1987) after detrending by a first order polynomial function. The derived fields were not represented in the maps where the errors exceeded 60% (see supplementary material).
The mixed layer depth (MLD) is the depth at which the po-tential density (σ θ ) varies by a given threshold value (1σ θ ) from that at a near-surface reference depth (Zref). After a
vi-sual inspection of the CTD profiles in the different regions analyzed, the Zref was set at 2 m to avoid a large part of
density gradient due to the diurnal variability and a 1σ θ of
0.02 kg m−3 seems a good compromise. The MLD calcu-lated with a threshold value of 1σ θ =0.05 kg m−3often fell within the seasonal thermocline rather than at its top. How-ever in some stations the mixed layer was characterised by a shallower actively mixing layer and an underlying layer that had been mixed within the last few weeks or months. In these circumstances the threshold value of 0.05 kg m−3was chosen.
2.3 Flow cytometry
The seawater samples were collected at 12 different depths between 0 and 200 m, fired during the up-cast at selected depths according to the most important features displayed by the fluorometer profiles during the down-cast. For flow cy-tometric analysis, seawater samples (100 to 150 cm3)from Niskin bottles were prefiltred on 100 µm mesh size net to prevent clogging of the flow cell and homogenized. Sub-samples of 5 cm3were fixed with 2% (final concentration) paraformaldehyde (Trousselier et al., 1995; see also Vaulot et al., 1989) and stored in liquid nitrogen up to analysis in the laboratory, shortly after the cruise (Martin, 1997).
Single cell analysis was run with a CYTORON AB-SOLUTE (ORTHO Diagnostic Systems) flow cytometer, equiped with an air-cooled argon laser (excitation wave-length at 488 nm). Each cell was characterized by 5 optical parameters: two scatter parameters, namely forward angle scatter (related to the particle size) and right angle scatter (related to cell structure and shape), and three fluorescence parameters related to emissions in the red (>620 nm), orange (565–592 nm) and green (515–530 nm) wavelength ranges.
Just before analysis, samples were rapidly thawed in a 30◦C water bath and fluorescent beads of 10 µm in diameter
were added in order to normalize the flow cytometer settings and to provide a reference for concentration calculations. The sample and sheath fluid rates were 1 and 100 mm3s−1
respectively.
Data were collected and stored in list-mode on a personal computer with the IMMUNOCOUNT software (ORTHO Di-agnostic Systems). Due to the control of the sample volume by a micro-syringe, this software can directly provide cell concentrations (cells mm−3). The Winlist software (Verity Software, USA) was used to determine statistical data. We must mention that the Prochlorococcus ecotype adapted to high light was likely underestimated in our measurements due to its low fluorescence level.
The cell concentration of each cluster was integrated at each station between 0 to 200 m depth with the trapezoid method. Interpolation of integrated cell concentration and cartography were realized with the ODV software (Schlitzer, 2002) over the domain occupied by sampled stations.
2.4 Biomass estimation
Synechococcus abundances were converted in carbon
biomasses by using the estimation of 200 fg C cell−1 (Mackey et al., 2002). The content of 49 fg C cell−1was ap-plied to Prochlorococcus (Caillau et al., 1996). For pico- and nano-eukaryotes, averaged biovolumes (4.48 and 113.10 µm3 respectively) were calculated by using equivalent diameters estimated from flow cytometry and used into the equation of Verity et al. (1992):
C(pg) = coeff · biovolume(µm3)0.866 (1) with coeff values of 0.405 and 0.239 for pico- and na-noeukaryotes respectively. These values were derived from the curve constructed by using the set of coeff-cell size in Verity et al. (1992).
The resulting carbon biomasses per cell are 1.393 and 14.133 pg C cell−1 for pico- and nanoeukaryotes respec-tively.
2.5 Pigment and nutrient analysis
Pigments (chlorophylls and caroteno¨ıds) were collected at the same stations and depths as samples for flow cytometric analysis. Pigments were analyzed by HPLC with the method of Vidussi et al. (1996) as detailed in Vidussi et al. (2001). Total chlorophyll a (total Chl a) was calculated as the sum of chlorophyll a and divinyl-chlorophyll a. The total Chl a concentrations determined by HPLC during this cruise were integrated over the 0-200 m layer and converted in terms of carbon by using the conversion factor C/Chl a=50 (Brown et al., 1999), assuming a constant ratio in the study area.
Nutrient samples were collected in acid-washed 50 cm3 polypropylene bottles. Nitrate (NO3−), phosphate (PO3−4 )
and silicate (Si(OH)4)were analyzed on board within a few
hours after recovery of the rosette, or frozen until analy-sis, using a Technicon Auto-Analyser II according to the procedures described by Grasshoff (1983). Precision of the method, calculated from five replicates, was ±0.04 µM (Cv < 5%) for NO3−, ±0.02 µM (Cv < 2%) for Si(OH)4and ±0.003 µM for PO3−4 (Cv < 4%).
3 Results
3.1 Water mass properties and their horizontal and vertical distributions in the upper ocean
3.1.1 The water masses of the eastern Mediterranean Sea
The water mass properties and their transformation through-out the eastern Mediterranean Sea were analyzed by poten-tial temperature/salinity diagrams constructed separately for three regions: (i) the Ionian basin, (ii) the Cretan Passage, and (iii) the Levantine basin. See supplementary material for more details.
3.1.2 Horizontal analyses
The horizontal maps at surface were constructed for the tem-perature, salinity and density fields in order to illustrate the spatial distribution of the AW, LSW (Levantine surface wa-ters) and their dynamics, as well. In spite of the large seasonal variability of the upper dynamics indicated by the model simulations (Roussenov et al., 1995), which have shown a prevalent eastward flow pattern of AW in winter, in January 1995 the salinity pattern revealed instead that both the western and northern Ionian basin were under the influ-ence of the low-salinity AW (see supplementary material).
3.1.3 Zonal section throughout the eastern Mediterranean Sea
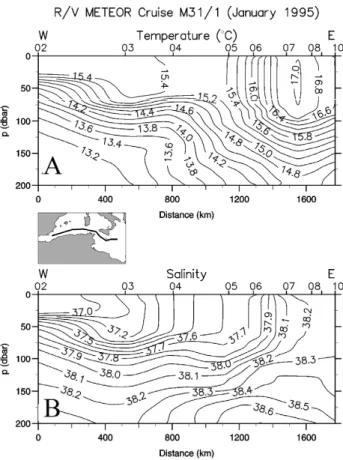
The spatial structure of the hydrographic fields in the upper layer is depicted in the vertical distributions of temperature, salinity, density and dissolved oxygen down to 200 m and along the transect throughout the eastern Mediterranean Sea (Fig. 2). In particular, the transect crosses the middle Ionian basin, the northern side of the Cretan Passage and the con-vection region in the northern Levantine basin. The vertical extent of the AW within the Ionian basin appeared by the low salinity values down to about 200 m. Moreover, the AW exhibited dissolved oxygen values higher than those in the underlying water, which was characterized by high salinity and low oxygen contents, indicating the LIW (Fig. 2b).
The behaviour of isotherms, isohalines and isopycnals in the Ionian basin indicated the presence of a bowl correspond-ing to the broad Ionian Anticyclone (Malanotte-Rizzoli et al., 1999), which developed down to 800 m (see supplementary material) entraining AW at surface and LIW in its interior.
M. Denis et al.: Ultraphytoplankton in the eastern Mediterranean Sea 2231
35
Fig. 2: Vertical distribution of (A) temperature, (B) salinity, (C) density, and (D) dissolved oxygen down to 800m along the cross section through the eastern Mediterranean Sea (see inset map) in January 1995. The position of the CTD stations is indicated at the top x axis. The positions of the Ionian Anticyclone (IA), the Cretan Cyclone (CC) and the Rhodes Gyre (RG) are also indicated.
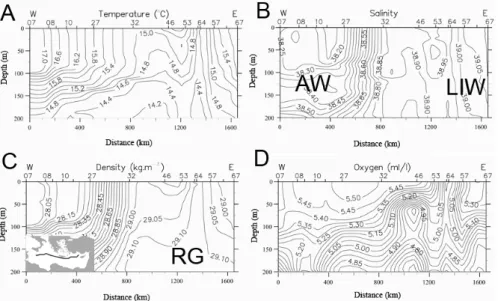
Fig. 2. Vertical distribution of (A) temperature, (B) salinity, (C) density, and (D) dissolved oxygen down to 200 m along the cross section
through the eastern Mediterranean Sea (see inset map) in January 1995. The positions of the Atlantic waters (AW), the Levantine Intermediate Waters (LIW) and the Rhodes Gyre (RG) are also indicated. For the positions of the Ionian Anticyclone and the Cretan Cyclone, see supplementary material.
Thus, a frontal system was established at the surface between the relatively fresh AW on the left and the highly saline Lev-antine type waters on the right (Fig. 2b). In contrast, the isopycnals slope upwarded from the west to the east and the doming structures prevailed in the Cretan Passage and in the Levantine basin. Two very strong divergence zones might be noticed. The first one was located in the Cretan Passage between the stations 32 and 46 and the second one was lo-cated in the Levantine basin (station 64). The former corre-sponds to the Cretan cyclone and was marked by the outcrop-ping of the isotherm 15◦C and the isopycnal 29.0 kg m−3 (Fig. 2a and c). The latter, much more intense, marked the Rhodes gyre where the isotherm 14.5◦C and the isopycnal
29.12 kg m−3were ventilating, being in direct contact with
the atmosphere at the station 64. The LIW convectively formed on the periphery of the Rhodes gyre (LIWEX Group, 2003) may be recognized from the higher values of salinity and dissolved oxygen (Fig. 2b and d). Features of the 200– 800 m depth layer are available in supplementary material.
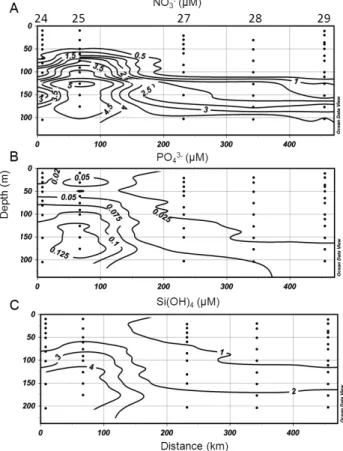
Nutrient concentrations followed the hydrographic trends. NO3− concentrations in the AW ranged from undetectable values in the upper layer to a maximum of 2.75 µM at 200 m and increased in the LIW to reach 2.5 µM in the surface wa-ters and ∼4 µM at 200 m (Fig. 3a). PO3−4 concentrations in the AW were <0.0025 µM in the upper layer to < 0.05 at 200 m, while in the LIW, values ranged from 0.0025–0.05 µM to 0.075–1 µM from surface to 200 m (Fig. 3b). Si(OH)4
concentrations in the AW were homogenized with values be-tween 1 and 2 µM from surface to 200 m while in the LIW, surface values ranged from 2 to 4 µM and from 4 to 5 µM at 200 m (Fig. 3c).
36
Fig. 3: Vertical distribution of (A) nitrate (NO3-), (B) phosphate (PO43-) and (B) Silicate (Si(OH)4) down to 200
m along the cross section through the eastern Mediterranean Sea (similar to Fig. 2). Stations are indicated on the top of the x axis.
Fig. 3. Vertical distribution of (A) nitrate (NO−3), (B) phosphate (PO3−4 ) and (C) silicate (Si(OH)4) down to 200 m along the cross section through the eastern Mediterranean Sea (similar to Fig. 2). Stations are indicated on the top of the x axis.
Table 1. MLD calculated from a threshold method at which changes in density from that at the reference depth of 2 m are greater than the
threshold value (1σ θ ) as indicated.
Western Ionian basin Eastern Ionian basin South Adriatic basin
Station 1σ θ MLD Station 1σ θ MLD Station 1σ θ MLD
kg m−3 m kg m−3 m kg m−3 m 5 0.02 98 24 0.02 68 15 0.05 83 6 0.02 66 25 0.02 60 16 0.05 39 7 0.02 94 26 0.05 34 17 0.02 463 8 0.02 58 27 0.05 71 18 0.02 92 28 0.02 103 19 0.02 101 29 0.02 111
3.1.4 Mixed layer depth
MLD was computed for selected stations as shown in Ta-ble 1. Through the Sicily Straits the MLD maxima with values around 100 m were found in the western and east-ern straits, while in the middle it was closer to 70 m. In the eastern Ionian basin the MLD was >100 m in those re-gions dominated by the anticyclonic motion (station 28–29) that entrained in its interior Atlantic Water. The front region was easily identified by the existing horizontal gradients in temperature and salinity towards the north-east that yielded a much shallower MLD (∼65 m). The mixed layer exhibited the strongest vertical uniformity in the south Adriatic basin reaching a depth of 463 m at station 17, where within an iso-lated chimney the convective overturning involved low tem-perature (∼13◦C) and highly saline water masses (S ∼ 38.7).
3.2 Ultraphytoplankton distribution
Ultraphytoplanktonic cells (<10 µm) analyzed by flow cy-tometry were resolved in four clusters on the basis of their optical properties, namely nanoeukaryotes (3–10 µm), pi-coeukaryotes (<3 µm), Prochlorococcus and
Synechococ-cus. The vertical distribution in the upper 200 m of each
group varied independently according to depth and loca-tion. The geographic distribution of 0–200 m integrated abundances of nanoeukaryotes, picoeukaryotes,
Prochloro-coccus, and Synechococcus in the eastern Mediterranean
Sea and in four stations in the western Mediterranean Sea can be seen in supplementary material. Minimal and max-imal values of the four cluster integrated abundances and biomasses are reported in Table 2. Nanoeukaryotes were poorly represented in the Ionian basin (stations 7 to 30) (1.4 to 3.7×10¹⁰cells m−2) and in the centre of the gyre in the south Adriatic basin (3.4×10¹⁰cells m−2), whereas their integrated abundances were about twice as high (up to 6.6×10¹⁰cells m−2) in the Sicily Strait (station 5), in the Strait of Otranto (station 15) and in the southern Adri-atic basin (stations 16–19). In the Levantine basin, the nanoeukaryote integrated abundances were higher than in
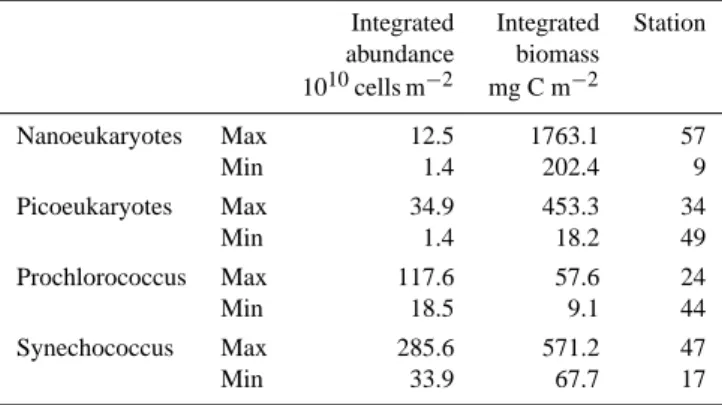
Table 2. Range of variation of the integrated abundances and biomasses of the different ultraphytoplankton groups in the eastern Mediterranean Sea. Maximum and minimum values are associated with the stations where they have been observed. Biomasses were determined as detailed in Materials and Methods.
Integrated Integrated Station abundance biomass 1010cells m−2 mg C m−2 Nanoeukaryotes Max 12.5 1763.1 57 Min 1.4 202.4 9 Picoeukaryotes Max 34.9 453.3 34 Min 1.4 18.2 49 Prochlorococcus Max 117.6 57.6 24 Min 18.5 9.1 44 Synechococcus Max 285.6 571.2 47 Min 33.9 67.7 17
the Ionian basin (>6×10¹⁰cells m−2), particularly between Cyprus and Crete islands (8.3 to 12.5×10¹⁰cells m−2)and in the Rhodes gyre (station 57, 12.5×10¹⁰cells m−2).
At most stations, integrated concentration values for pi-coeukaryotes were higher than those for nanoeukaryotes (be-tween 5 to 35×1010cells m−2), but their distribution over
the eastern Mediterranean Sea followed the same pattern (see supplementary material).
Integrated Prochlorococcus abundances in the eastern Mediterranean Sea were low and homogeneous at the level of the Ionian basin, in the centre of the southern Adri-atic gyre and in the western side of the Levantine basin. In contrast, the integrated concentrations of
Prochlorococ-cus were higher near the Greek coast at stations 24 and
25 (117.6×10¹⁰cells m−2), in the Otranto Strait and in the southern Adriatic basin, at the periphery of the gyre, i.e. along the pattern followed by the Ionian Surface water that intruded into the Adriatic basin through the Strait of Otranto.
M. Denis et al.: Ultraphytoplankton in the eastern Mediterranean Sea 2233 In the Levantine basin, integrated abundances were
rela-tively high (stations 55 to 74, up to 60.8×10¹⁰cells m−2)
except in the Rhodes gyre where they were about two fold lower (∼30×1010cells m−2, station 61). Prochlorococcus integrated abundances at stations sampled in the western Mediterranean Sea were at the same levels as in the Ionian basin (14.1 to 24.7×10¹⁰cells m−2).
Synechococcus was the most abundant (in terms of cell
numbers) population, constituting from 17% (station 5) to 68 % (station 30) of the overall ultraphytoplankton com-munity integrated abundances. In the southern Adriatic basin, at the periphery of the gyre (stations 19 and 16) and at the Otranto Strait (station 15), the water masses were from 4 to 5 times richer in Synechococcus than those at the centre of the gyre (station 17). Synechococcus
inte-grated abundances were low in the western Ionian basin (<120×1010cells m−2; stations 5 to 9) and increasing
pro-gressively towards the centre of the eastern Mediterranean Sea. However, these values were not homogeneously dis-tributed: for example, integrated abundances varied by an order of magnitude from 37.4×10¹⁰cells m−2 (station 41; Aegean basin) to 285.6×10¹⁰cells m−2 (station 47; eastern Cretan Passage). High abundances in Synechococcus were observed in the area occupied by the Ierapetra anticyclone lo-cated south of Crete (stations 47, 51, 54; mean concentration: 275×1010cells m−2); indeed, the highest value (Table 2) was found within this gyre. In the Rhodes gyre (stations 51–71), the Synechococcus integrated abundances were relatively low except at station 71 (226.0×10¹⁰cells m−2). In the western Mediterranean Sea, the 4 sampled stations (2–5) were rela-tively poor in Synechococcus, with integrated abundances in the range 26.2 to 45.4×10¹⁰cells m−2. It is worthy to
re-mark that these values are close to the three lowest values (33.8, 37.4 and 41.9×10¹⁰cells m−2)observed in the east-ern Mediterranean Sea, but in the convective regions; i.e. at stations 17, 41 and 58 located in the southern Adriatic basin, in the Aegean basin and in the Rhodes gyre, respectively.
Synechococcus was largely dominant over Prochlorococcus,
thus the cyanobacteria specific pigment zeaxanthin quanti-fied by HPLC was exclusively assigned to Synechococcus during this study and the cell content in zeaxanthin was found depth-independent (not shown).
The carbon biomass derived from integrated Chl a concen-trations analyzed by HPLC using a constant C/Chl a ratio of 50 varied between 541 to 2549 mg C m−2, with a mean value of 1122 mg C m−2. The contribution percentage of Synechococcus and Prochlorococcus to this biomass was
es-timated for all stations using cell concentrations and a car-bon per cell ratio as detailed in the materials and methods section (Table 3). Synechococcus contributed 3.3 to 67.7% to the total phytoplankton biomass, with the lowest contri-bution at station 17 (cyclonic gyre) and the highest south of Cyprus (station 74, Shikmona anticyclone). The
Syne-chococcus contribution was also very high in the
Ierape-tra anticyclone (45.7%, station 47). Prochlorococcus
con-tributed weakly to the total phytoplanktonic biomass (from 0.5% at the Sicily Strait to 6.5% at station 24 influenced by the cyclonic eddy).
3.3 Links between ultraphytoplankton distributions, meso-scale dynamics and nutrients
Ultraphytoplankton and nutrient vertical distributions were investigated in some details in those regions that were dy-namically active, exhibiting relatively higher phytoplankton abundances even though locally limited.
3.3.1 Southern Adriatic basin
Figure 4a shows the vertical distribution of temperature, salinity and density in the southern Adriatic basin. Typ-ical aspects of winter convection are shown at station 17 located in the centre of the cyclonic gyre, where uniform hydrographic properties (t ≈ 13.25◦C, S ≈ 38.65, and den-sity ≈29.18 kg m−3)in the 0–200 m clearly attest the extent of the convective mixing of the water column; in contrast, 40 km far from the centre of the gyre (station 16 and 19), a thermohaline stratification persists because of the strong gradient between the relatively fresh water from the northern regions and the LIW entrained in the cyclonic circulation pat-tern (see supplementary material). It is worthy to notice the thermal inversion with depth through the 50 and 150 m lev-els; the vertical stability of the water column is maintained by the salinity. Thus, three water masses can be distinguished in the upper 200 m layer: (i) the relatively fresh waters of riverine input in the upper 50 m; (ii) the coldest and dense water from the northern shelf regions (50–100 m); and (iii) the transitional layer towards the warmer, saline intrusion of the much more dense LIW in the beneath. The eddy field showed that maximum salinity cores of LIW were trapped in the gyre, resulting in a vertical distribution of more saline waters at station 17, whilst the fresher and lighter waters of riverine input, mainly flowing from the northern Adriatic re-gion, were entrained around the gyre (station 16 and 19); these waters were transported to the south by the western Adriatic Costal Current (Artegiani et al., 1997), and might be traced as far as the Strait of Otranto (station 15).
In the southern Adriatic basin, the three ultraphytoplank-tonic populations showed a uniform vertical distribution at the centre of the gyre (Fig. 4b) with low integrated abun-dances of about 3.4, 23.3 and 33.8×10¹⁰cells m−2 for
na-noeukaryotes, Prochlorococcus and Synechococcus, respec-tively (station 17). On the other hand, variable quantities towards higher integrated abundances were outside, at the periphery of the gyre (stations 16 and 19), and at the Otranto Strait (station 15). Nutrient distribution pattern was very sim-ilar (Fig. 4c). Station 17 exhibited homogeneous values from surface to 200 m for NO3−(∼5 µM), PO3−4 (∼0.12 µM) and Si(OH)4(∼7 µM). Nutrient concentrations at station 15 and
16 were similar, NO3−concentrations ranged between 1 and
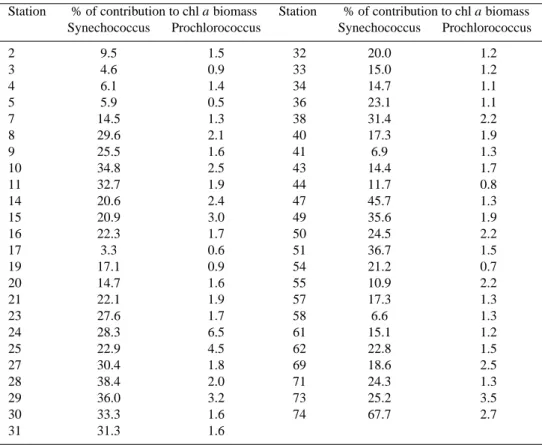
Table 3. Percentage of contribution of Synechococcus and Prochlorococcus to the overall chlorophyll a biomass. To calculate these
contri-butions, chl a was expressed in terms of carbon biomass by using the ratio C/Chl a=50.
Station % of contribution to chl a biomass Station % of contribution to chl a biomass Synechococcus Prochlorococcus Synechococcus Prochlorococcus
2 9.5 1.5 32 20.0 1.2 3 4.6 0.9 33 15.0 1.2 4 6.1 1.4 34 14.7 1.1 5 5.9 0.5 36 23.1 1.1 7 14.5 1.3 38 31.4 2.2 8 29.6 2.1 40 17.3 1.9 9 25.5 1.6 41 6.9 1.3 10 34.8 2.5 43 14.4 1.7 11 32.7 1.9 44 11.7 0.8 14 20.6 2.4 47 45.7 1.3 15 20.9 3.0 49 35.6 1.9 16 22.3 1.7 50 24.5 2.2 17 3.3 0.6 51 36.7 1.5 19 17.1 0.9 54 21.2 0.7 20 14.7 1.6 55 10.9 2.2 21 22.1 1.9 57 17.3 1.3 23 27.6 1.7 58 6.6 1.3 24 28.3 6.5 61 15.1 1.2 25 22.9 4.5 62 22.8 1.5 27 30.4 1.8 69 18.6 2.5 28 38.4 2.0 71 24.3 1.3 29 36.0 3.2 73 25.2 3.5 30 33.3 1.6 74 67.7 2.7 31 31.3 1.6
2 µM at surface and reached station 17’s values of ∼5 µM at 200 m, PO3−4 concentration values were of ∼0.02 µM at surface and ∼0.12 µM at 200m and Si(OH)4values were of ∼2.5 µM at surface and reached between 6 and 8 µM at 200 m (Fig. 4c).
Generally, the two sites are dynamically related by cy-clonic circulation that causes the exchange of Adriatic/Ionian waters across the Strait (i.e. Adriatic Surface Waters to the west and Ionian Surface waters to the east that out-flow/intrude into the Ionian/Adriatic basin) probably more intensely during the winter (Gacic et al., 1996).
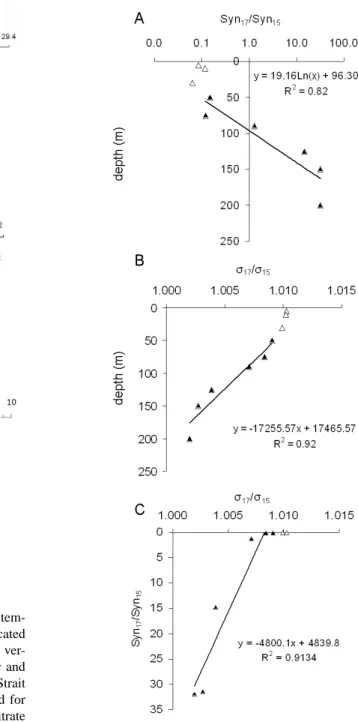
In order to show the impact of the hydrodynamic struc-ture, i.e. the cyclonic gyre in the southern Adriatic basin, on the abundance of ultraphytoplankton and the concentration of nutrients, we looked for a possible relationship between density and cell abundance or nutrient concentration where hydrodynamism was strong enough. Two stations can be considered affected by a hydrodynamic feature when den-sity values at a same depth and over a given depth range are different so that the slopes of the pycnoclines are very steep. With depth, the ratio of the density values at the com-pared stations tends toward one, which characterizes homo-geneous deep layers. Considering station 17 in the core of the gyre and station 15 outside the gyre with a pycnocline
at about 100 m depth, we found a significant linear relation-ship in the 50–150 m column between depth and the natu-ral logarithm of Synechococcus abundance ratio Syn17/Syn15
as shown in Fig. 5a. We also found a significant linear re-lationship between the density ratio σ17/σ15 and depth in
the 50–150 m layer as illustrated by Fig. 5b. A significant linear (r2=0.91, p < 0.01) regression was found between abundance and density ratios: Syn17/Syn15=a(σ17/σ15) + b
(Fig. 5c). A significant linear regression was also found be-tween nutrient (nitrate, phosphate) and density ratios (see Ta-ble 4). Relationships between pico- and nanoeukaryotes and depth or density were not significant (Table 4). At station 16, the pycnocline was shallower (30–40 m) and the significant relationship involving Synechococcus abundances at stations 17 and 16 took the form of a power function (Table 4). It was also the case for the relationship involving nutrient and density ratios at stations 16 and 17. In that case, the similar relationships for pico- and nanoeukaryotes were significant (Table 4).
3.3.2 Eastern Ionian basin
The vertical distribution of the hydrographic measure-ments in the eastern Ionian basin was analyzed along the
M. Denis et al.: Ultraphytoplankton in the eastern Mediterranean Sea 2235
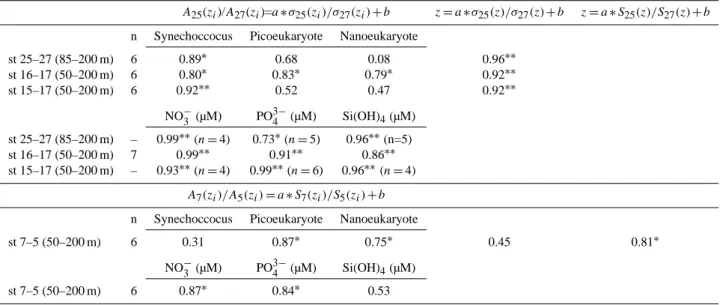
Table 4. Correlation coefficients (R2)of linear relationships between ratios at a given depth (zi)below 50 m of cell abundance or nutrient concentrations A(zi)and density excess σ (zi)or salinity S(zi)at two compared stations. Linear relationships were also established between depth and the ratio of density excess or salinity at the two compared stations. The compared stations and the range of depth where the linear relationships were established are given in the first column. The linear relationships are explicitely written for stations 25 and 27 and for station 7 and 5 as two examples.
A25(zi)/A27(zi)=a ∗ σ25(zi)/σ27(zi) + b z = a ∗ σ25(z)/σ27(z) + b z = a ∗ S25(z)/S27(z) + b
n Synechoccocus Picoeukaryote Nanoeukaryote
st 25–27 (85–200 m) 6 0.89∗ 0.68 0.08 0.96∗∗ st 16–17 (50–200 m) 6 0.80∗ 0.83∗ 0.79∗ 0.92∗∗ st 15–17 (50–200 m) 6 0.92∗∗ 0.52 0.47 0.92∗∗ NO− 3 (µM) PO 3− 4 (µM) Si(OH)4(µM) st 25–27 (85–200 m) – 0.99∗∗(n = 4) 0.73∗(n = 5) 0.96∗∗(n=5) st 16–17 (50–200 m) 7 0.99∗∗ 0.91∗∗ 0.86∗∗ st 15–17 (50–200 m) – 0.93∗∗(n = 4) 0.99∗∗(n = 6) 0.96∗∗(n =4) A7(zi)/A5(zi) = a ∗ S7(zi)/S5(zi) + b n Synechoccocus Picoeukaryote Nanoeukaryote
st 7–5 (50–200 m) 6 0.31 0.87∗ 0.75∗ 0.45 0.81∗
NO−3 (µM) PO3−4 (µM) Si(OH)4(µM)
st 7–5 (50–200 m) 6 0.87∗ 0.84∗ 0.53
∗
p <0.05∗∗p <0.01.
north-south transect defined by stations 24 to 29, which crosses the area where we observed eddy fields (see supple-mentary material). The vertical sections provide evidence of the formation of a thermohaline front located between sta-tions 25 and 27 (Fig. 6). The front extended down to 200 m, separating two different water masses: (i) the cold and more saline to the north stations (24 and 25), and (ii) the warmer and less saline to the south of the front (stations 27–29). It appears evident from these distributions that the space scales of the eddy were about 100 km; water mass analysis for this eddy fields showed that the LIW (i.e. a cold, more saline, poor in oxygen water mass with density of ≈28.85 kg m−3) entrained in the cyclonic circulation and upwelled close to the photic layer, but no convective mixing occurred because of the strong pycnocline established by the density struc-ture. On the other hand, minimum salinity cores of AW were trapped in the anticyclone found in the southern region. The chemical features of these water masses were also different. In particular, concentration of dissolved oxygen was lower in the north than in the south (Fig. 6d), while NO3−, PO3−4 and Si(OH)4concentrations were higher, specifically between 60
and 200 m (Fig. 7a, b and c respectively).
The impact of this thermohaline front on the vertical dis-tribution of ultraphytoplankton is illustrated by Fig. 8. For pico- and nanoeukaryotes, the transition across the front re-sulted essentially in their deeper presence south of the front than at station 25, especially down to 100 m. In contrast, the vertical distributions of Synechococcus and
Prochloro-coccus were more affected by the front. Indeed, north of
the front, the two distributions were complementary,
Syne-chococcus occupying the upper 75 m and Prochlorococcus
being present below, between 75 and 150 m, with about the same maximum concentration (≈20 000 cells cm−3)whereas
south of the front Synechococcus was present deeper (down to 150 m) and Prochlorococcus concentration decreased and dropped below 1000 cells cm−3 throughout the water col-umn.
At station 25, we observed a strong vertical variation of density between 60 and 75 m depth (Fig. 6c) that was cou-pled to a large abundance decline for all ultraphytoplankton groups before 100 m depth. At station 27 where the ver-tical variation of density was smoother (Fig. 6c), the ult-raphytoplankton concentration declined more progressively with depth. We found a linear relationship between the ratio
σ25/σ27 of density values and depth between 75 and 200 m
at stations 25 and 27 (Fig. 9b). We also found a signifi-cant linear relationship in the same depth range (75–200 m) between depth and the natural logarithm of Synechococcus abundance ratio Syn25/Syn27 as shown in Fig. 9a. A
signif-icant (r2=0.89, p < 0.05) correlation between abundance and density ratios: Syn25/Syn27=a(σ25/σ27) + b was also
found as shown in Fig. 9c. Similar relationships between depth and density or abundance ratios and between abun-dance ratios and density for pico- and nanoeukaryotes were not significant (Table 4). We also found a linear relationship between nutrient and density ratios in the range 85–200 m depth (Table 4).
37
Fig. 4: Southern Adriatic basin features. A: Profiles of (a) temperature, (b) salinity, and (c) density excess for the
stations located in the southern Adriatic basin and in the Strait of Otranto. B: Vertical distribution of (a) Nanoeukaryotes, (b) Prochlorococcus and (c) Synechococcus in the southern Adriatic basin and in the Strait of Otranto. (Note that different scales of abundance are used for the sake of the presentation). C: Vertical distribution of (a) Nitrate (NO3-), (b) Phosphate (PO
43-) and (c) Silicate (Si(OH)4) in the southern Adriatic basin
and in the Strait of Otranto. Station 19 was not available.
Fig. 4. Southern Adriatic basin features. A: profiles of (a)
tem-perature, (b) salinity, and (c) density excess for the stations located in the southern Adriatic basin and in the Strait of Otranto. B: ver-tical distribution of (a) Nanoeukaryotes, (b) Prochlorococcus and
(c) Synechococcus in the southern Adriatic basin and in the Strait
of Otranto. (Note that different scales of abundance are used for the sake of the presentation). C: vertical distribution of (a) nitrate (NO3−), (b) phosphate (PO3−4 )and (c) silicate (Si(OH)4)in the southern Adriatic basin and in the Strait of Otranto. Station 19 was not available.
3.3.3 Transition from the eastern to the western Mediterranean Sea
Differences between the eastern and western Mediterranean Sea were provided by stations sampled on both sides of the Sicily Strait, along the transect made by stations 2 to 10. In-deed, the physical features of the water masses varied be-tween stations 5 and 7 when crossing the Sicily Strait that makes the geographical separation between the western and eastern Mediterranean Sea. Temperature and salinity in the
38
Fig. 5: Relationships between vertical distributions of Synechococcus abundance and density inside (station 17)
and outside (station15) the south Adriatic gyre. (A) Depth dependence of the density ratio Syn17/Syn15. (B)
Depth dependence of the abundance ratio σ17/σ15. (C) Relationship between Synechococcus abundance ratio
Syn17/Syn15 and density ratio σ17/σ15. Data belonging to the upper 50 m (empty triangles) were excluded from the
relationships (filled triangles).
Fig. 5. Relationships between vertical distributions of Synechococ-cus abundance and density inside (station 17) and outside
(sta-tion15) the south Adriatic gyre. (A) Depth dependence of the abun-dance ratio Syn17/Syn15. (B) Depth dependence of the density ratio
σ17/σ15. (C) Relationship between Synechococcus abundance ratio Syn17/Syn15and density ratio σ17/σ15. Data belonging to the upper 50 m (empty triangles) were excluded from the relationships (filled triangles).
surface layer were homogeneous west of the Sicily Strait and increased significantly in the eastern side of the transect, from 15.5 to 17.0◦C and from 37.50 to 38.25 respectively (Fig. 10). In the upper 200 m, nitrate, phosphate and silicate
M. Denis et al.: Ultraphytoplankton in the eastern Mediterranean Sea 2237
39
Fig. 6: Vertical distribution of (A) temperature, (B) salinity, (C) density and (D) dissolved oxygen along the
north-south transect defined by stations 24 to 29. To note, the presence of an eddy field establishing a thermohaline front located between stations 25 and 27.
Fig. 6. Vertical distribution of (A) temperature, (B) salinity, (C) density and (D) dissolved oxygen along the north-south transect defined by
stations 24 to 29. To note, the presence of an eddy field establishing a thermohaline front located between stations 25 and 27.
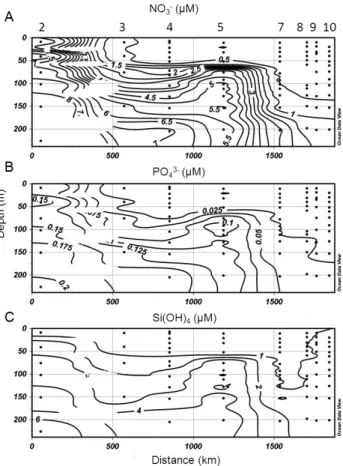
concentrations largely decreased eastwards. For instance, surface concentrations of nitrate decreased from about 6 µM at station 2 to undetectable levels from station 4 to 10 and, at 200 m, from >9 µm at station 2 to <1.4 µM at stations 8, 9 and 10 (Fig. 11a). Similar trends were observed with PO3−4 and Si(OH)4. Surface values of PO3−4 at station 2 reached
0.12 µM to values <0.025 µM from station 3 to 10, and at 200 m, values ranged eastward from 0.2 µM to <0.05 µM (Fig. 11b). Eastward surface Si(OH)4values ranged from 1–
2 µM to <1 µM, and between 150 and 200 m, from 4–6 µM to <2 µM (Fig. 11c).
This abundance declined continuously further east.
Prochlorococcus presented a contrasted distribution on both
sides of the Sicily Strait, mainly occupying the upper 70 m on the west side, with abundances >2000 cells cm−3, whereas on the east side, abundances in the upper 70 m were <1000 cells cm−3, but were maximum at 100 m with values close to 4000 cells cm−3 (Fig. 12c). Synechococcus abundance was high at surface and decreased with depth (Fig. 12d). The peculiarity is that its abundance was higher in the eastern Basin (10 000 cells cm−3at station 11) than in the western Basin (6000 cells cm−3stations 2 to 5). In addi-tion, the occupied layer was more important on the east side of the Sicily Strait (0–80 m) than on the west side (<40 m).
Nanoeukaryotes were mainly present in the upper 80 m, with abundances slightly decreasing eastwards from about 400 to 300 cells cm−3(Fig. 12a). Picoeukaryotes were more abundant in the western Mediterranean Sea with a maximum value of 3000 cells cm−3at 40 m depth, station 2 (Fig. 12b). At station 7, in the eastern Mediterranean Sea, picoeukary-ote abundance was weaker (≈1000 cells cm−3)and homoge-neously distributed over the upper 100 m.
The comparison of the eastern and western Mediterranean Sea does not directly involve hydrodynamic structures but rather water masses with different properties. The
sur-40 Fig. 7: Vertical distribution of (a) nitrate (NO3-), (b) phosphate (PO43-) and (c) Silicate (Si(OH)4) down to 200 m
along the north-south transect defined by stations 24 to 29.
Fig. 7. Vertical distribution of (a) nitrate (NO3−), (b) phosphate (PO3−4 )and (c) silicate (Si(OH)4)down to 200 m along the north-south transect defined by stations 24 to 29.
face of the western Mediterranean Sea under the influence of the Atlantic water inflow is less saline than the eastern Mediterranean Sea where evaporation is a major feature.
41
Fig. 8: Vertical profiles of ultraphytoplankton at stations 24 to 29 located along the transect crossing the
thermohaline front at the eastern Ionian basin, as evidenced in Figure 6.
Fig. 8. Vertical profiles of ultraphytoplankton at stations 24 to 29 located along the transect crossing the thermohaline front at the eastern
Ionian basin, as evidenced in Fig. 6.
Considering stations 5 and 7 as representative of both sides of the Sicily Strait, and salinity as the driving factor, we found a linear relationship between depth and the ratio S7/S5of
salin-ity values from the same depths at stations 5 and 7. This re-lationship applies to the 75–150 m depth range as illustrated by Fig. 13a together with the vertical distribution of salin-ity at both stations in the same depth range (Fig. 13b). We also found a significant linear relationship in the same depth range between depth and the picoeukaryote abundance ratio Pico7/Pico5 as shown in Fig. 13c. From both relationships,
we derived a significant (r2=0.87, p < 0.05) correlation between both abundance and salinity ratios: Pico7/Pico5= aLn(S7/S5)+b(Fig. 13d). A similar relationship was
signifi-cant (r2=0.75, p < 0.05) for nanoeukaryotes but not signif-icant for Synechococcus (Table 4). The difference in water masses is not limited to salinity. Indeed we found a linear relationship between nutrient and salinity ratios at stations 5 and 7 (Table 4).
4 Discussion
Phytoplankton distribution in the eastern Mediterranean Sea has been poorly documented until the recent years. Only few spatially limited investigations of ultraphytoplankton abun-dances corresponding to different periods were reported in the literature (Li et al., 1993; Yacobi et al., 1995; Zohary et
al., 1998; Casotti et al., 2003; Psarra et al., 2005; Tanaka et al., 2007; see also the review by Siokou-Frangou et al., 2010). The only synoptic study related to phytoplankton, to our knowledge, was that derived from ocean color data (CZCS) conducted by Antoine et al. (1995) and dedicated to chlorophyll a and primary production. The METEOR 31/1 cruise (January 1995) provided support for the first basin-scale field-study of phytoplankton distribution in the eastern Mediterranean Sea. Thus a basin-wide winter phytoplankton pigment distribution in the eastern Mediterranean Sea, con-ducted during this cruise, was reported (Vidussi et al., 2001). In parallel the study presented here reports the first basin-wide spatial distribution of ultraphytoplankton (<10 µm) de-termined by flow cytometry. Since then, further flow cytom-etry studies in the eastern Mediterranean Sea at a few sites were achieved in springtime on picophytoplankton (Moutin et al., 2002) or in summer on ultraphytoplankton (Psarra et al., 2005) and on ultraphytoplankton distribution exclusively in the Ionian basin (Casotti et al., 2003).
The dominance of picoeukaryotes over nanoeukaryotes re-ported in this study reflects the general oligotrophic status of the eastern Mediterranean Sea even during the winter sea-son as evidenced by the Rpn index (Denis et al., 2003). This index, which was proposed for the first time during a study on the transition from mesotrophy to oligotrophy observed in western Mediterranean Sea is defined by the abundance ratio picoeukaryotes/nanoeukaryotes and characterizes the
M. Denis et al.: Ultraphytoplankton in the eastern Mediterranean Sea 2239
42
Fig. 9: Relationships between vertical distributions of Synechococcus abundance and density north (station 25)
and south (station27) of the thermohaline front. (A) Depth dependence of the density ratio Syn25/Syn27. (B) Depth
dependence of the abundance ratio σ25/σ27. (C) Relationship between Synechococcus abundance ratio Syn25/Syn27
and density ratio σ25/σ27.
Fig. 9. Relationships between vertical distributions of Synechococ-cus abundance and density north (station 25) and south (station27)
of the thermohaline front. (A) Depth dependence of the
abun-dance ratio Syn25/Syn27. (B) Depth dependence of the density ratio
σ25/σ27. (C) Relationship between Synechococcus abundance ratio Syn25/Syn27and density ratio σ25/σ27.
mesotrophic (Rpn < 1) or oligotrophic (Rpn > 1) status of an ecosystem. The carbon biomass estimations showed that
Synechococcus contributed 3.3% to 67.7% to the overall
phy-toplanktonic biomass in the eastern Mediterranean Sea (Ta-ble 3). In contrast, Prochlorococcus contributed far less,
43
Fig. 10: Vertical distribution of (A) temperature and (B) salinity across the western Mediterranean Sea and the western part of the Ionian basin illustrating the difference in temperature and salinity on both sides of the Sicily Strait.
Fig. 10. Vertical distribution of (A) temperature and (B) salinity
across the western Mediterranean Sea and the western part of the Ionian basin illustrating the difference in temperature and salinity on both sides of the Sicily Strait.
from 0.5% to 6.5. Synechococcus represented more than 20% of the overall phytoplankton biomass at the majority of sampled stations. The mean integrated carbon biomasses of pico- and nanoeukaryotes (168 and 681 mg C m−2 respec-tively) are in agreement with mean values derived from their integrated chl a biomasses (270 and 630 mg C m−2 respec-tively) as reported by Vidussi et al. (2001) when using the C/Chl a conversion factor of 50 (Brown et al., 1999). The choice of this ratio is consistent with the ratio value of 55 obtained from data assimilation modelling in the north west-ern Mediterranean Sea (Faugeras et al., 2003) and with the ratio value of 47 obtained from an experimental approach in the same region (Latasa et al., 2005). The spatial distribu-tion of the four resolved ultraphytoplanktonic clusters was not uniform over the eastern Mediterranean Sea where
Syne-chococcus was the dominant species. However, its maximum
abundance (about 37 000 cells cm−3) was 26% less than the winter maximum concentration (about 50 000 cells cm−3) re-ported for the western Mediterranean Sea (Vaulot et al., 1990). In the western Mediterranean Sea, the presence of
Prochlorococcus in the top layer was consistent with the
observations of Vaulot et al. (1990). Contrary to other
44
Fig. 11: Vertical distribution of (A) nitrate (NO3-), (B) phosphate (PO43-) and (C) Silicate Si(OH)4) down to 200
m across the western Mediterranean Sea and the western part of the Ionian basin. Fig. 11. Vertical distribution of (A) nitrate (NO
3−), (B) phosphate (PO3−4 )and (C) Silicate Si(OH)4)down to 200 m across the west-ern Mediterranean Sea and the westwest-ern part of the Ionian basin.
oligotrophic ocean regions, where Prochlorococcus domi-nates the picophytoplankton fraction (see review of Parten-sky et al., 1999 and references therein), the dominance of
Synechococcus during this study supports the suggestion that Synechococcus would be more adapted than Prochlorococ-cus to the hydrodynamical and nutrient conditions of the
eastern Mediterranean Sea. Though up to now there is no direct evidence of the Mediterranean Synechococcus strain capacity for nitrogen-fixation, the recent discovery of dia-zotrophic unicellular cyanobacteria in the northwestern (Le Moal and Bi´egala, 2009) and eastern (Man-Aharonovich et al., 2007) Mediterranean Sea may suggest that
Synechococ-cus would benefit, at least indirectly, from this nitrogen
fixation. The detection of nitrogen-fixing cyanobacteria is not limited to the Mediterranean Sea. It was reported in other oligotrophic oceans (Zehr et al., 1998, 2001, 2008; Tripp et al., 2010). The winter mixing can also partly ex-plain the dominance of Synechococcus over
Prochlorococ-cus in the eastern Mediterranean Sea (Partensky et al., 1999).
The absence of fluorescence increase with depth for
Syne-chococcus and for the pico and nanoeukaryotic
phytoplank-ton was reasonably due to large mixed layer depths induced by winter conditions. For instance, the mixed layer depth
reached 400 m in the Adriatic basin. Under these condi-tions, Prochlorococcus mean fluorescence per cell provided evidence for the presence of two ecotypes along the wa-ter column (Martin, 1997), one occupying the upper 75 m, the other, adapted to low light, growing preferentially below 75 m in agreement with previous reports (Vaulot et al., 1990; Partensky et al., 1999). A similar vertical distribution for
Prochlorococcus was also reported by Tanaka et al. (2007) in
the Levantine basin during the spring period. These ecotypes would also combine adaptation to the availability of nitrogen sources (nitrate, nitrite and ammonium; Moore et al., 2002). The existence of three ecotypes of Prochlorococcus was re-ported in equatorial Pacific (Mackey et al., 2002), however no evidence for a third species could be derived from our data. In contrast, only two ecotypes were recently identified in the Strait of Sicily, in summer (Brunet et al., 2007).
This study provides clear examples of the dependence of ultraphytoplankton spatial distribution on meso or sub-meso scale hydrodynamic features like gyres and thermohaline fronts that generate distinct water masses. In the Adriatic basin, the inside waters of the observed cyclonic gyre were very homogeneous in the upper 200 m in contrast with out-side waters (Fig. 4a), and their ultraphytoplankton content was significantly lower than at the edge of the gyre or in sur-rounding waters (Fig. 4b). Synechococcus distribution was the most affected by the presence of the gyre. The linear relationships found between Synechococcus abundance and density inside and outside the gyre, express a tight control of Synechococcus by the density, at least in the depth range between 50 and 150 m (Fig. 5c). In the upper layer, addi-tional factors such as light, predation and nutrients would contribute to a more complex relationship between
Syne-chococcus abundances inside and outside the gyre.
In the Ionian basin, the presence of a thermohaline front (Fig. 6) mainly modified the vertical distribution of both
Synechococcus and Prochlorococcus. North of the front,
where waters were colder and more saline than south of the front, both genera appeared complementary with
Syne-chococcus restricted to the upper 75 m and Prochlorococ-cus being as abundant below (Fig. 8). South of the front, Prochlorococcus abundance dropped to its background level
below 75 m and was replaced by Synechococcus. The ther-mohaline front was also responsible for the density varia-tions between stavaria-tions 25 and 27 (Fig. 6). The large density change between 60 and 75 m depth at station 25 was coupled to a large drop in Synechococcus concentration (Fig. 8). In contrast, at station 27, the vertical variation of density was less pronounced and the Synechococcus concentration de-creased more progressively. Below 50 m depth, the ratios of cell concentrations and density between stations 25 and 27 provide evidence of a phasing in the concentration decrease with depth and of a pycnocline (ratio tending towards 1), ex-pressing the impact of the front (Fig. 9). Both ratios were found significantly correlated (Fig. 9c). Ultraphytoplankton concentrations were larger above the pycnocline than below
M. Denis et al.: Ultraphytoplankton in the eastern Mediterranean Sea 2241
45 1
Fig. 12: Vertical distribution of ultraphytoplankton along the transect defined by stations 2 to 10, namely
nanoeukaryotes, picoeukaryotes, Prochlorococcus and Synechococcus. Note that station 5 (Sicily Strait) delimits a clear transition for all distributions between the western and eastern Mediterranean basins.
Fig. 12. Vertical distribution of ultraphytoplankton along the transect defined by stations 2 to 10, namely nanoeukaryotes, picoeukaryotes, Prochlorococcus and Synechococcus. Note that station 5 (Sicily Strait) delimits a clear transition for all distributions between the western
and eastern Mediterranean basins.
whereas density became rapidly homogeneous below the py-cnocline.
In the comparison of western and eastern Mediterranean Sea, the considered changes are related to salinity, not to a lo-cal hydrodynamic system. Though salinity explains the vari-ations in picophytoplankton distributions (Fig. 13) according to relationships analogous to those found for the frontal sys-tem in the Ionian basin, the interpretation might not be as straightforward due to the large space scale covered.
Previous studies on combined effects of hydrodynamism and nutrients in the eastern Mediterranean Sea were essen-tially focussed on a single structure like a warm core eddy (Krom et al., 1992, 1993). In the present study, we addressed a larger scale. Nutrient concentrations were strongly nega-tively correlated to all the phytoplankton groups, on a global point of view as well as on a “station by station” point of view (data not shown). This is linked to the increase of nu-trient concentrations with depth, and the inherent decrease of light-dependent cell abundances. The expected relation-ship between the mesotrophic Mediterranean western part and the oligotrophic eastern part was not evidenced in this study. By correlating nutrients with abundances over the up-per 50 m of the water column, no positive correlation was found ever. In such a large scale study, the lack of pos-itive correlation between nutrients and phytoplankton can be expected, since such a relationship is strongly time de-pendent, and since winter phytoplankton development does not proceed with high growth rates, but faces strong nutri-ent needs and inter-specific competition. However, within the selected hydrographic areas of this study and below 50 m depth, nutrient ratios between particular stations (Table 4) were correlated to corresponding density ratios, which also were strongly correlated to the corresponding phytoplankton ratios. 46
Fig. 13: Relationships between vertical distributions of picoeukaryote (Pico) abundance and salinity in the
western (station 5) and eastern (station7) Mediterranean Sea. (A) Depth dependence of the salinity ratio S7/S5. (B)
Vertical distribution of salinity. (C) Depth dependence of the abundance ratio Pico7/Pico5. (D) Relationship
between picoeukaryote abundance ratio Pico7/Pico5 and salinity ratio S7/S5.
Fig. 13. Relationships between vertical distributions of
picoeukary-ote (Pico) abundance and salinity in the western (station 5) and eastern (station7) Mediterranean Sea. (A) Depth dependence of the salinity ratio S7/S5. (B) Vertical distribution of salinity. (C) Depth dependence of the abundance ratio Pico7/Pico5. (D) Relationship between picoeukaryote abundance ratio Pico7/Pico5and salinity ra-tio S7/S5.
In addition to providing a basin scale distribution of ult-raphytoplankton in the eastern Mediterranean Sea this study, as a main conclusion, shows that the large-scale phytoplank-ton distribution below 50 m in the considered main hydro-graphic structures appears to be specifically affected by hy-drodynamism.
Supplementary material related to this article is available online at:
http://www.biogeosciences.net/7/2227/2010/ bg-7-2227-2010-supplement.pdf.
Acknowledgements. This work was partially supported by the
CNRS-INSU and the GEODYME project (contract No. 930061 of the MTP-MAST II programme). We thank the captain and crew of the R. V. Meteor for their efficient assistance at sea. W. Roether is especially acknowledged for the opportunity of taking part to the Meteor 31 cruise. We are very grateful to J. P. B´ethoux, coordinator of the GEODYME project, for his stimulating support during this study. The publication of this article is financed by CNRS-INSU.
Edited by: M. Dai
The publication of this article is financed by CNRS-INSU.
References
Antoine, D., Morel, A., and Andr´e, J.-M.: Algal pigment distri-bution and primary production in the eastern Mediterranean Sea as derived from coastal zone color scanner observations, J. Geo-phys. Res., 100(C8), 16193–16209, 1995.
Artegiani, A., Bregant, D., Paschini, E., Pinardi, N., Raicich, F., and Russo, A.: The Adriatic Sea general circulation. Part II: baro-clinic circulation structure, J. Phys. Oceanogr., 27, 1515–1532, 1997.
Azov, Y.: Seasonal patterns of phytoplankton productivity and abundance in nearshore oligotrophic waters of Levant Basin (Mediterranean), J. Plankton Res., 8, 41–53, 1986.
Berland, B.: Azote ou phosphore ? Consid´erations sur le “ paradoxe nutritionnel ” de la mer M´editerran´ee, Oceanol. Acta, 3, 135– 142, 1980.
Berman, T., Townsend, D. W., El-Sayed, S. Z., Trees, C. C., and Azov, Y.: Optical transparency, chlorophyll and primary pro-ductivity in the eastern Mediterranean near the Israeli coast, Oceanol. Acta, 7, 367–372, 1984.
Bonin, D. J., Bonin, M. C., and Berman, T.: Mise en ´evidence exp´erimentale des facteurs nutritifs limitants de la production du micro-nanoplancton et de l’ultraplancton dans une eau cˆoti`ere de la M´editerran´ee orientale (Ha¨ıfa, Isra¨el), Aquat. Sci., 51, 129– 152, 1989.
Brown, S. L., Landry, M. R., Barber, R. T., Campbell, L., Garrison D. L., and Gowing, M. M.: Picophytoplankton dynamics and production in the Arabian Sea during the 1995 southwest mon-soon, Deep-Sea Res. II, 46, 1745–1768, 1999.
Brunet, C., Casotti, R., Vantrepotte, V., and Conversano, F.: Vertical variability and diel dynamics of picophytoplankton in the Strait
of Sicily, Mediterranean Sea, in summer, Mar. Ecol. Prog. Ser., 346, 15–26, 2007.
Cailliau, C., Claustre, H., Vidussi, F., Marie, D., and Vaulot, D.: Carbon biomass, and gross growth rates as estimated from 14C pigment labelling, during photoacclimatation in
Prochlorococ-cus CCMP 1378, Mar. Ecol. Prog. Ser., 145, 209–211, 1996.
Carter, E. F. and Robinson, A. R.: Analysis models for estimation of ocean fields, J. Atmos. Ocean Tech., 4(1), 49–74, 1987. Casotti, R., Landolfi, A., Brunet, C., D’Ortenzio, F., Mangoni, O.,
Ribera d’Alcal`a, M., and Denis, M.: Composition and dynamics of the phytoplankton of the Ionian Sea (eastern Mediterranean), J. Geophys. Res., 108, 8116, doi:10.1029/2002JC001541, 2003. Claustre, H., Kerherv´e, P., Marty, J.-C., Prieur, L., Videau, C., and Hecq, J.-H. : Phytoplankton dynamics associated with a geostrophic front : ecological and biogeochemical implications, J. Mar. Res., 52, 711–742, 1994.
Conan, P., Pujo-Pay, M., Raimbault, P., and Leveau, M.: Variabilit´e hydrologique et biologique du golfe du Lion. II. Productivit´e sur le bord interne du courant,Oceanol. Acta, 21, 767–782, 1998. Denis, M., Martin V., and Andersen, V.: Short-term variations of the
vertical distribution of cyanobacteria in the open Mediterranean Sea, Sci. Mar., 64, 157–163, 2000.
Denis, M., Martin, V., Momzikoff, A., Gondry, G., Stemmann, L., Demers, S., Gorsky, G., and Andersen, V.: Pulsed remineralisa-tion in the north western Mediterranean Sea: an hypothesis, J. Mar. Syst., 39, 19–41, 2003.
Faugeras, B., L´evy, M., M´emery, L., Verron, J., Blum, J., and Char-pentier, I.: Can biogeochemical fluxes be recovered from nitrate and chlorophyll data? A case study assimilating data in the north western Mediterranean Sea at the JGOFS-DYFAMED station, J. Mar. Syst., 40–41, 99–125, 2003.
Gacic, M., Kovacevich, V., Manca, B., Papageorgiou, E., Poulain, P. M., Scarazzato, P., and Vetrano, A.: Thermohaline proper-ties and circulation in the Strait of Otranto. In: F. Briand (Edi-tor), Dynamics of Mediterranean Straits and Channels. Bul. Inst. Oceanogr., Special Issue, 17, CIESM Science Series, 2, 117– 145, 1996.
Grasshoff, K., Ehrhardt, M., Kremling, K., and Almgren, T.: Meth-ods of Seawater Analysis, Verlag Chemie, Weinheim, Germany, 632 pp., 1983.
Krom, M. D., Kress, N., Brenner, S., and Gordon, L. I.: Phosphorus limitation of primary productivity in the eastern Mediterranean, Limnol. Oceanogr., 36, 424–432, 1991.
Krom, M. D., Brenner, S., Kress, N., Neori, A., and Gordon, L. I.: Nutrient dynamics and new production in a warm-core eddy from the eastern Mediterranean Sea, Deep-Sea Res., 39, 467– 480, 1992.
Krom, M. D., Brenner, S., Kress, N., Neori, A., and Gordon, L. I.: Nutrient distributions during an annual cycle across a warm-core eddy from the E. Mediterranean Sea, Deep-Sea Res., 40, 805– 825, 1993.
Krom, M. D., Groom, S., and Zohary, T.: The eastern Mediter-ranean, in : The Biogeochemistry of Marine Systems, edited by: Black, K. D. and Shimmield, G. B., Blackwell Publishing Ox-ford, 91–126, 2003.
Krom, M. D., Thingstad, T. F., Brenner, S., Carbo, P., Drakopoulos, P., Fileman, T. W., Flaten, G. A. F., Groom, S., Herut, B., Kitidis, V., Kress, N., Law, C. S., Liddicoat, M. I., Mantoura, R. F. C., Pasternak, A., Pitta, P., Polychronaki, T., Psarra, S.,