HAL Id: hal-02993440
https://hal.archives-ouvertes.fr/hal-02993440
Submitted on 6 Nov 2020
HAL is a multi-disciplinary open access
archive for the deposit and dissemination of
sci-entific research documents, whether they are
pub-lished or not. The documents may come from
teaching and research institutions in France or
abroad, or from public or private research centers.
L’archive ouverte pluridisciplinaire HAL, est
destinée au dépôt et à la diffusion de documents
scientifiques de niveau recherche, publiés ou non,
émanant des établissements d’enseignement et de
recherche français ou étrangers, des laboratoires
publics ou privés.
Counterrotating Stellar Discs
Lisa Young, Davor Krajnović, Pierre-Alain Duc, Paolo Serra
To cite this version:
Lisa Young, Davor Krajnović, Pierre-Alain Duc, Paolo Serra. Atomic Hydrogen Clues to the Formation
of Counterrotating Stellar Discs. MNRAS, 2020, 000 (1), pp.1 - 13. �10.1093/mnras/staa1265�.
�hal-02993440�
Atomic Hydrogen Clues to the Formation of
Counterrotating Stellar Discs
Lisa M. Young,
1,2
?
Davor Krajnovi´
c,
3
Pierre-Alain Duc,
4
and Paolo Serra
5
1Physics Department, New Mexico Tech, 801 Leroy Place, Socorro, NM 87801 USA 2Adjunct Astronomer, National Radio Astronomy Observatory
3Leibniz-Institut f¨ur Astrophysik Potsdam (AIP), An der Sternwarte 16, D-14482 Potsdam, Germany
4Observatoire Astronomique de Strasbourg, Universit´e de Strasbourg, CNRS, UMR 7550, 11 rue de l’Universit´e, F-67000 Strasbourg, France 5INAF - Osservatorio Astronomico di Cagliari, Via della Scienza 5, I-09047 Selargius (CA), Italy
Accepted 2020 May 4. Received 2020 April 17; in original form 2020 February 14
ABSTRACT
We present interferometric HIobservations of six double-disc stellar counterrotator (“2σ”) galaxies from the ATLAS3D sample. Three are detected in HIemission; two of
these are new detections. NGC 7710 shows a modestly asymmetric HIdisc, and the atomic gas in PGC 056772 is centrally peaked but too poorly resolved to identify the direction of rotation. IC 0719, the most instructive system in this study, shows an extended, strongly warped disc of ∼ 43 kpc diameter, with a faint tail extending towards its neighbor IC 0718. The gas has likely been accreted from this external source during an encounter whose geometry directed the gas into misaligned retrograde orbits (with respect to the primary stellar body of IC 0719). In the interior, where dynamical time-scales are shorter, the HIhas settled into the equatorial plane forming the retrograde secondary stellar disc. This is the first direct evidence that a double-disc stellar counterrotator could be formed through the accretion of retrograde gas. However, the dominant formation pathway for the formation of 2σ galaxies is still unclear. The ATLAS3D sample shows some cases of the retrograde accretion scenario and also some cases in which a scenario based on an unusually well-aligned merger is more likely.
Key words: galaxies: elliptical and lenticular, cD — galaxies: evolution — galaxies: ISM — galaxies: structure — Radio lines: galaxies.
1 INTRODUCTION
Despite their relatively smooth and featureless appearances in shallow optical images, early-type galaxies (ellipticals and lenticulars, or slow- and fast-rotators) show an impressive di-versity in their kinematic structures and frequent cases of in-ternal misaligned substructures. For example, the ATLAS3D survey (Cappellari et al. 2011) found that 4% or 11 of 260 early-type galaxies actually consist of two dynamically cold, flattened stellar discs that are coplanar but counterrotating with respect to one another (Krajnovi´c et al. 2011). Beyond these double-disc stellar counterrotators, an additional 7% of the ATLAS3Dsample (19 of 260) host multiple co-located stellar populations whose angular momenta are misaligned (the kinematically decoupled cores). These might be exam-ples of a similar phenomenon to the double-disc stellar
coun-? E-mail: [email protected]
terrotators. A further 6% (16 of 260) host two flattened discs whose specific angular momenta are aligned but they have different spatial distributions, so their velocity maps show local extrema both at small radii and again at larger radii, and these are prograde versions of the stellar counterrota-tors. Thus, the double-disc stellar counterrotators may be considered the most extreme versions of a more general phe-nomenon that is evident in nearly 20% of nearby early-type galaxies.
Furthermore, 35% of the fast rotators have their ionized gas kinematically misaligned with respect to their stellar ro-tation by more than 40◦ (Davis et al. 2011;Jin et al. 2016;
Ene et al. 2018;Bryant et al. 2019), and a similar misalign-ment fraction is observed in HI (Serra et al. 2014). Mis-aligned substructures are evidently common in early-type galaxies, and a comprehensive picture of galaxy formation ought to be able to explain their incidence and properties.
Our goal in the present paper is to understand the
formation of the double-disc stellar counterrotators and to place them into the broader context of galaxy evolution. In general, having multiple kinematic components suggests that a galaxy may have experienced multiple episodes of assembly, and in particular for the double-disc stellar coun-terrotators (also called “twoσ-peak” or “2σ” galaxies), two classes of models have been discussed. One model involves an ordinary disc galaxy that accretes a large quantity of ap-proximately retrograde cold gas, and after the gas has set-tled into the equatorial plane, it grows a retrograde stellar disc out of the accreted gas (e.g. Vergani et al. 2007; Coc-cato et al. 2015;Mitzkus et al. 2017). Algorry et al.(2014) describe a variant in which a galaxy at the intersection of two cosmic filaments could accrete gas first with one spin, from one dominant filament, and then with the opposite spin (from another filament). This scenario predicts that one of the stellar discs should be younger than the other, and any cold gas that remains should rotate like the younger disc.
Another class of models involves a major binary merger of two galaxies in a rather special geometry – the two galax-ies and their mutual orbit are all nearly coplanar, and at least one of the incoming galaxy spins is antiparallel to the pair’s mutual orbital angular momentum (e.g.Bournaud et al. 2005;Crocker et al. 2009;Bois et al. 2011). Those simu-lations have shown that in this special aligned geometry, the stellar discs can survive the merger more or less intact, with some dynamical heating. The frequency of interactions with this special geometry is not well known. The prototypical NGC 4550 is believed to have been formed this way, based on its CO kinematics (Crocker et al. 2009). The two stellar discs have different scale heights, and the CO rotates like the thicker disc, which is the opposite to what one would expect for the accretion model (where the younger disc should also be dynamically colder). Understanding the relative impor-tance of these two formation scenarios is necessary in order to check whether modern cosmological simulations of galaxy formation are correctly reproducing these galaxies.
As noted above in the case of NGC 4550, observations of the cold gas in double-disc stellar counterrotators can give crucial clues to their histories. HI is particularly valuable as it can often be traced to large radii and it is therefore more sensitive to interactions with other galaxies. As the dynamical time-scales at large radii are long, HIwill retain those signatures of interactions for longer times than ionized or molecular gas tracers. Thus, we present HIobservations of six “2σ” (stellar counterrotator) galaxies; three are de-tected, and one shows strongly disturbed kinematics that clearly point to the gas accretion formation scenario dis-cussed above. We discuss implications for the broader un-derstanding of the formation of the 2σ galaxies.
2 TARGET SELECTION
The ATLAS3Dsample (Cappellari et al. 2011) is a volume-limited sample of 260 early-type galaxies closer than about 40 Mpc, with stellar masses greater than 109.9 M . The
heart of the survey is optical IFU spectroscopy, giving two-dimensional maps of the galaxies’ stellar kinematics, stellar populations, ionized gas distribution and kinematics, and star formation history. And while similar optical data ex-ist for other (generally more dex-istant) surveys, the ATLAS3D
sample is the best studied volume-limited sample at this time, so it provides the largest and most homogeneous se-lection of 2σ galaxies for study. It also has the most complete set of cold gas data, including observations of CO emission from all and HIfrom most (Young et al. 2011;Serra et al. 2012).
The eleven 2σ galaxies in ATLAS3D(Table1;Krajnovi´c et al. 2011) are identified using a combination of their stel-lar velocity fields and velocity dispersions. The stelstel-lar discs have roughly comparable masses but slightly different scale heights and/or scale lengths, so they dominate the mean ve-locity field in different regions, and the sense of rotation in the velocity field switches at larger heights or radii. They also have unusually large off-nuclear peaks in the stellar ve-locity dispersion. Those peaks are located along the major axis where the two counterrotating discs contribute roughly equally to the line-of-sight velocity distribution, which is where the sense of mean rotation changes. This distinctive behavior in the velocity dispersions is responsible for the “two σ-peak” name. Their stellar kinematic maps can be
seen in Figures C5 and C6 ofKrajnovi´c et al.(2011). In addition to the eleven listed here, the ATLAS3D member NGC 0524 has also been studied as a double-disc stellar counterrotator (Katkov et al. 2011). The luminos-ity of its secondary disc is low, which makes it difficult to identify. For the purposes of homogeneity we do not discuss NGC 0524 here, though we note that it does have a relaxed CO disc (Crocker et al. 2011), and it serves as a reminder that more sensitive data may identify additional 2σ galaxies in the ATLAS3D sample.
All eleven of the ATLAS3D 2σ galaxies were searched for CO emission (Young et al. 2011) but not all of them were previously searched for HIemission, due to the Declination limitations of the WSRT (Serra et al. 2012). HIin NGC 4191 was discussed by Young et al. (2018). The present paper fills in HI observations of the remaining low-Dec galaxies not previously observed at WSRT, so that all eleven have sensitive CO searches and interferometric HIsearches.
3 OBSERVATIONS
IC 0719, NGC 0448, NGC 4803, NGC 7710, and PGC 056772 were observed with the Karl G. Jansky Very Large Array (VLA) in September 2018, in project 18A-226, for a total of two hours each (and four hours on NGC 7710). These data were obtained in the D configuration, giving baselines from 0.2 to 5 kλ and resolutions on the order of an arcminute. The native velocity resolution of the data is 3.3 km s−1. The flux, bandpass, and time-dependent gain calibrations were made following standard procedures, us-ing 3C286 or 3C48 once per observus-ing session as the primary flux and bandpass calibrator, and secondary gain calibrators were observed every 20 minutes. Calibration was performed using the eVLA scripted pipeline the CASA software pack-age, version 5.3.0. The bootstrapped flux densities of the secondary gain calibrators are in good agreement with pre-vious measurements in the VLA calibrator database and the NRAO VLA Sky Survey (Condon et al. 1998). An initial round of imaging revealed any bright line emission in the data, and the velocities of that emission combined with the known target velocities were used to select frequency ranges
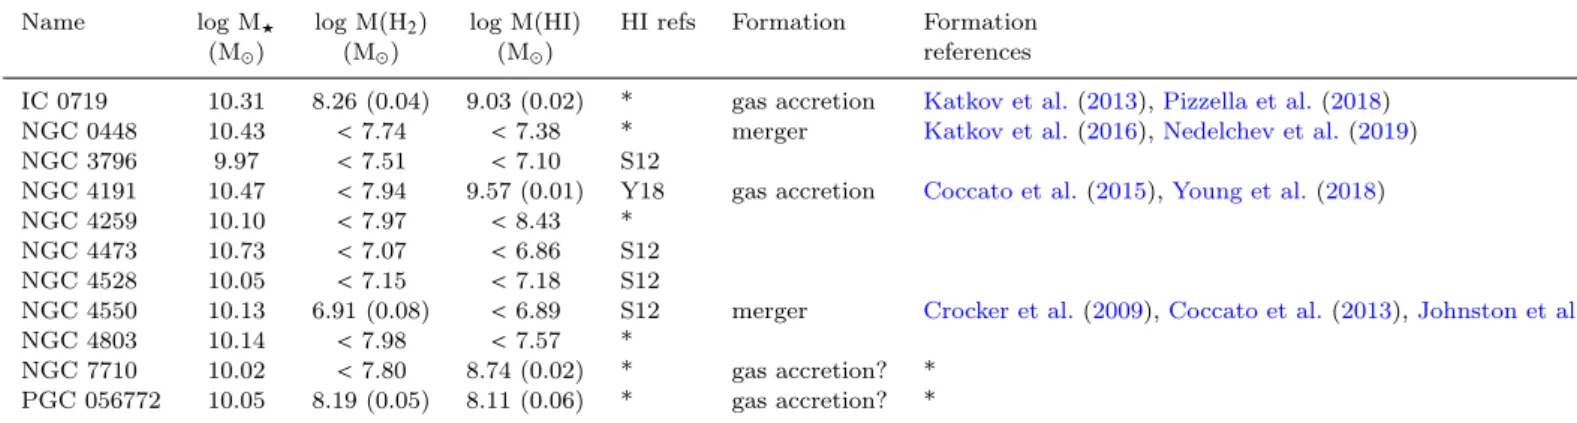
Table 1. Cold gas data for 2σ galaxies.
Name log M? log M(H2) log M(HI) HI refs Formation Formation
(M ) (M ) (M ) references
IC 0719 10.31 8.26 (0.04) 9.03 (0.02) * gas accretion Katkov et al.(2013),Pizzella et al.(2018) NGC 0448 10.43 < 7.74 < 7.38 * merger Katkov et al.(2016),Nedelchev et al.(2019) NGC 3796 9.97 < 7.51 < 7.10 S12
NGC 4191 10.47 < 7.94 9.57 (0.01) Y18 gas accretion Coccato et al.(2015),Young et al.(2018) NGC 4259 10.10 < 7.97 < 8.43 *
NGC 4473 10.73 < 7.07 < 6.86 S12 NGC 4528 10.05 < 7.15 < 7.18 S12
NGC 4550 10.13 6.91 (0.08) < 6.89 S12 merger Crocker et al.(2009),Coccato et al.(2013),Johnston et al.(2013) NGC 4803 10.14 < 7.98 < 7.57 *
NGC 7710 10.02 < 7.80 8.74 (0.02) * gas accretion? * PGC 056772 10.05 8.19 (0.05) 8.11 (0.06) * gas accretion? *
Stellar masses are from (Cappellari et al. 2013). H2masses are all fromYoung et al.(2011), except NGC 4550 fromCrocker et al. (2009).
HI references: * = This paper; S12 =Serra et al.(2012); Y18 =Young et al.(2018).
for estimating continuum levels. Continuum emission was subtracted using order 0 or 1 fits to the individual visibilities. We produce final data cubes using the ‘natural’ weighting scheme for maximum sensitivity. If line emission is present, we also produce cubes of several different channel widths using the Briggs robustness technique and some tapering in the uv plane to achieve better resolution and a rounder beam. Cubes are cleaned to a residual level equal to the rms noise level.
In addition, NGC 4259 was observed in project AT259 in 2001, in the VLA’s C configuration. General observing strategies, data reduction, and imaging are similar to those used for the newer data. The data give baselines from 0.3 to 16 kλ but they have only 30 minutes on source, so they are higher resolution and lower sensitivity than the other data discussed in this paper. Furthermore, NGC 4259 is 8.70 away from the pointing centre, but the offset is not a serious problem as the half-power radius of the VLA is 150and the antenna gain at the location of NGC 4259 is still a relatively high value of 0.82. Thus these C configuration observations are not ideal for very faint, diffuse emission, but they can rule out the presence of bright HIemission like that in IC 0719 or NGC 7710.
The sensitivity, final imaged velocity resolution and ve-locity coverage of these HIobservations are indicated in Ta-ble 2. Following the discussion inS12, which uses data of similar sensitivity and resolution, we indicate the HIcolumn density sensitivity as a 5σ signal in one channel of width 16.5 km s−1.S12also make a careful analysis of the typical angu-lar sizes and velocity widths of detected HIfeatures in the ATLAS3Dsurvey. Based on this analysis, they adopt M(HI) upper limits for the HInondetections by calculating three times the statistical uncertainty in a sum over a data vol-ume of 50 km s−1and six synthesized beam areas (typically 1.2×10⁴ square arcseconds or 110 kpc2 to 450 kpc2 at the distances of this sample). That procedure is also adopted here, using the appropriate number of beams to make the solid angle of 1.2×10⁴ square arcseconds.
4 RESULTS
We find HI emission in NGC 7710, PGC 056772, and IC 0719, but not in NGC 0448, NGC 4803, or NGC 4259 (Table2). These results bring the HIdetection rate in the ATLAS3D 2σ galaxies to 4/11, comparable to the rate in ATLAS3D as a whole (S12). Here we note the nondetec-tions briefly and describe the HI emission in NGC 7710, PGC 056772, and IC 0719.
4.1 Nondetections – NGC 4803, NGC 0448, NGC 4259
No HIemission is found towards NGC 4803. The VLA data for this field show some HIemission from UGC 08045 and possibly also from the vicinity of NGC 4795, but they are far away and there’s no sign of any emission towards NGC 4803 or between it and the other detections; more information is presented in the Appendix. No significant HIemission from any source is detected in the field of NGC 0448. And as noted in the previous section, the observations we are using for NGC 4259 were pointed at the spiral NGC 4273, 8.70away (94 kpc in projection); NGC 4273 is strongly detected and is shown in the Appendix, but NGC 4259 is not detected.
4.2 NGC 7710 and PGC 056772
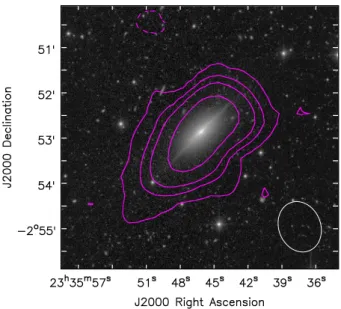
NGC 7710 is unusual amongst the 2σ galaxies in that its optical image (Figure1) clearly shows multiple components: a thick spheroid and a very thin, nearly edge-on disc with an associated dust lane. HIemission in NGC 7710 shows the classic double-horned profile typical of galactic discs (Figure
2). The gas distribution and kinematics (Figures 1and 3) show little sign of recent disturbance, though there is a mild asymmetry with approximately 30% more HIon the receding (southeast) side of the galaxy than the approaching side, and the gas is more extended on that side as well. It is important to note that the HIdistribution is not resolved in the direction of the minor axis, so the distribution by itself offers no clues about whether the HIis associated with the thicker stellar spheroid or the thinner disc. We assume it is associated with the thinner disc, as that’s where the dust
Table 2. HI image properties for 2σ galaxies.
Name Distance Vel. range beam beam rms N(HI) lim S(HI) M(HI)
(Mpc) (km s−1) (00) (kpc) (mJy/bm) (1019cm−2) (Jy km s−1) (M ) IC 0719 29.4 288 – 3376 111 × 57 15.8 × 8.1 0.85 1.23 5.30 ± 0.27 (1.08±0.06)×109 82 × 65 11.7 × 9.3 1.20 1.21 NGC 0448 29.5 366 – 3438 111 × 55 15.9 × 7.8 0.98 1.46 < 0.12 < 2.4×10⁷ NGC 4803 39.4 1071 – 4226 109 × 50 20.8 × 9.5 0.83 1.39 < 0.10 < 3.7×10⁷ NGC 7710 34.0 834 – 3898 68 × 56 11.3 × 9.2 0.59 1.41 2.00 ± 0.09 (5.45±0.24)×108 PGC 056772 39.5 1120 – 4154 76 × 58 14.5 × 11.1 0.66 1.36 0.35 ± 0.05 (1.30±0.19)×108 NGC 4259 37.2 1803 – 3080 19.6 × 15.7 3.5 × 2.8 1.47 54 < 0.83 < 2.7×10⁸ Distances are taken fromCappellari et al.(2011). The velocity range in column 3 indicates the usable range covered by the data. The noise (rms) is quoted in a channel 16.5 km s−1wide, except for NGC 4259, where 20.6 km s−1is the native resolution of the data, and for the higher resolution image of IC 0719, which was made with 9.9 km s−1channels. The column density limit represents 5σ in one channel. The integrated flux density limit for nondetections represents three times the statistical uncertainty in a sum over 50 km s−1 and 1.2×10⁴square arcseconds, as inS12. For the new D configuration data that solid angle corresponds to ∼ 2 beams and for the C
configuration data on NGC 4259 it is 34 beams.
and the blue stellar populations are found. The HIrotates in the same direction as the ionized gas. That is also the same as the sense of rotation in the stellar velocity field at radii & 400(Figure3;Krajnovi´c et al. 2011).
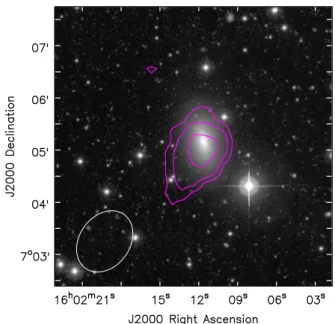
PGC 056772, like most of the 2σ galaxies, has a rather unremarkable optical image (Figure4) and its multiple stel-lar components are much more obvious in the stelstel-lar kine-matics (Krajnovi´c et al. 2011) than in the optical surface brightness distribution. It also shows very faint HIemission (Figures 4 and 5). The galaxy has a 1.4 GHz continuum source with a flux density of 4.7 ± 0.4 mJy, so the coinci-dence of the line source and the continuum source boosts the reliability of the line detection. The HIemission is not well resolved, so we have little kinematic information (Figure6), and it is not yet possible to associate the HIemission with a specific stellar component. There is a hint of an extraplanar HItail, stretching to the southeast, but it should be verified with data of higher sensitivity and resolution. Three dwarf galaxies in the field of PGC 056772 are also detected in HI
emission and identified in the catalog ofHabas et al.(2019), and they are discussed in the Appendix.
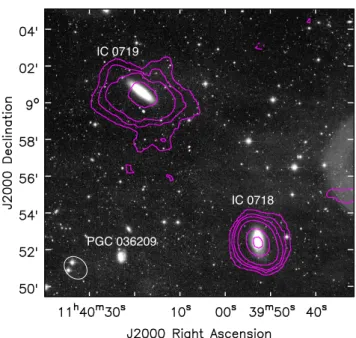
4.3 IC 0719
IC 0719 is relatively dusty and blue for an early-type galaxy (e.g.Krajnovi´c et al. 2011;Alatalo et al. 2013). Its two stellar components are more obvious in the stellar velocity field than in the optical image, as is common, but in hindsight the stellar components can also be decomposed in an optical image (Katkov et al. 2013;Pizzella et al. 2018). IC 0719 is in a close pair (at 100or 86 kpc in projection) with IC 0718, which has a similar velocity and a factor of 10 smaller stellar mass. IC 0718 is not a member of the ATLAS3Dsample and is not known to be a 2σ galaxy, but it is detected in HI
emission in our data and we discuss it in the context of a probable interaction with IC 0719.
The total flux that we recover in IC 0719 is 5.30 ± 0.27 Jy km s−1, or (1.08 ± 0.06)×109M of HI, which is consistent
with the flux measured by Arecibo (Figure7). To be specific, the flux recovered here is slightly larger than the values of 4.65 ± 0.12 Jy km s−1 and 4.08 ± 0.10 Jy km s−1 quoted byHaynes et al.(2018) andGrossi et al.(2009), most likely because the emission is somewhat more extended than the
Figure 1. HI integrated intensity in NGC 7710. The grayscale is the MATLAS g image fromDuc et al.(2015), and the contours are the HI column density at levels of (−1, 1, 3, 5, 10, 30) × 1.41 × 1019 cm−2, where 1.41×1019 cm−2 is the nominal sensitivity in these data (Table2). The resolution of the HI data is indicated by the ellipse in the lower right corner.
2000 2100 2200 2300 2400 2500 2600 2700 2800
Velocity (km s
1)
0
5
10
Flux Density (mJy)
NGC7710
23
h35
m54
s48
s42
s36
s-2°51'
52'
53'
54'
55'
RA (J2000)
Dec (J2000)
HI
20
10
0
10
20
arcsec
20
10
0
10
20
arcsec
stars
2250
2300
2350
2400
2450
2500
2550
Velocity (km/s)
Figure 3. HI and stellar velocity fields of NGC 7710. In both panels, the black contours show the stellar isophotes. In the stel-lar velocity field, the counterrotating feature is visible inside the brightest contour, though it is more prominent in the stellar ve-locity dispersion data (Krajnovi´c et al. 2011).
Arecibo beam. In IC 0718 we recover 4.89 ± 0.16 Jy km s−1, which is 13% smaller than the Arecibo measurement of 5.53 ± 0.08. The difference between those measurements may be attributed to the fact that IC 0718 is 100 from the VLA’s field centre, where the primary beam gain is 0.72. We have applied the primary beam correction, but the imaging qual-ity is always degraded at large distances from the field cen-tre, and extended smooth emission may be filtered out.
4.3.1 Disturbed HIkinematics in IC 0719
IC 0719 has an irregular HIdistribution roughly 50(43 kpc) in diameter in the east-west direction and 40 north-south (Figure 8). A tail of faint HIemission at column density ∼ 2×1019 cm−2 extends at least 40 (34 kpc) from the centre of IC 0719 in the direction of IC 0718. This tail is proba-bly the same feature as the bridge shown between IC 0719 and IC 0718 in the Arecibo data ofGrossi et al.(2009), and though those authors show the bridge to be complete, with
Figure 4. HI integrated intensity in PGC 056772. The grayscale is the MATLAS g image (Duc et al. 2015), and the contours are the HI column density at levels of (1, 2, 4) × 1.36 × 1019cm−2, which is the nominal sensitivity in these data. The resolution of the HI data is indicated by the ellipse in the lower left corner.
2200
2400
2600
2800
3000
3200
Velocity (km s
1)
2
0
2
Flux Density (mJy)
PGC056772
Figure 5. HI spectrum of PGC 056772, with a Gaussian fit over-laid.
no gaps, the VLA data do not show a full bridge (Figure9). Grossi et al do not specify the peak HIcolumn density in the bridge, indicating only that it is greater than 6×1018 cm−2 in the ∼ 40 Arecibo beam, and the nominal sensitivity in the present VLA data is 1.2×1019 cm−2. Therefore the two datasets are not in direct conflict, especially if the emission is spread over 50 km s−1 or more. It is also worth noting that single dish images are usually not cleaned to account for the presence of sidelobes of the beam, and Grossi et al do not mention cleaning, so there is always the possibility that the column densities in the bridge between two bright emission sources could be enhanced by an unfortunate side-lobe. Deeper interferometric images would be the best way to probe the existence of a complete bridge in more detail.
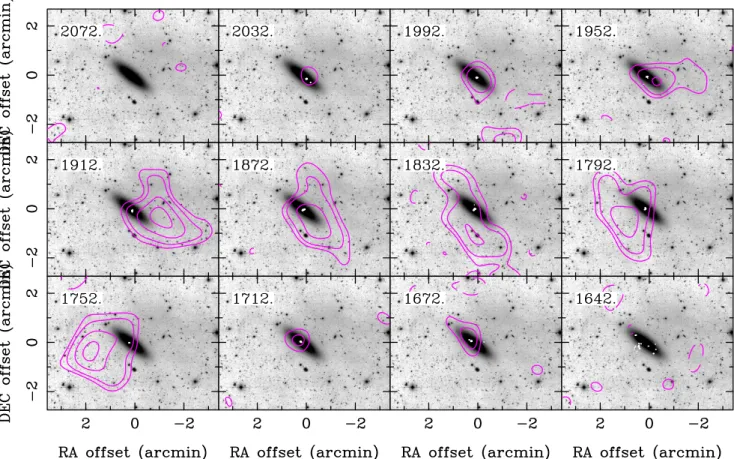
The velocity fields and channel maps (Figures 10and
11) show that in the inner body of the galaxy, the HI kine-matics are aligned with the photometric major axis of the galaxy, which also aligns with the ionized gas and CO kine-matics. The HI kinematic position angle at small radii is 243◦± 3◦, compared to 229◦± 3◦ for the molecular gas and
Figure 6. HI channel maps of PGC 056772. The ellipse illustrates the beam size; the magenta cross marks the optical centre of the galaxy, and the velocity of each channel is indicated in the top left corner. Contour levels are (−2, 2, 3, 4, 5) times the rms noise in this image cube (0.37 mJy beam−1).
1200 1400 1600 1800 2000 2200 2400 2600
Velocity (km s
1)
10
0
10
20
30
Flux Density (mJy)
IC 0719
VLA
Arecibo
1200 1400 1600 1800 2000 2200 2400 2600
Velocity (km s
1)
0
20
40
Flux Density (mJy)
IC 0718
VLA
Arecibo
Figure 7. Integrated HI spectra of IC0719 and IC0718 from the VLA data and from Arecibo (Haynes et al. 2018).
231.9◦± 0.1◦ for the stellar photometric major axis (Davis et al. 2011;Krajnovi´c et al. 2011). The sense of rotation of the HImatches that of the smaller, secondary stellar disc but is retrograde with respect to the bulk of the stars (Katkov et al. 2013;Pizzella et al. 2018). And though the mismatch between the HIand CO resolution is great, the channel maps show that the highest velocity HI emission in the galaxy forms a compact disc coincident with and co-rotating with the CO; the feature is most easily visible in the channel maps
IC 0719
IC 0718
PGC 036209
Figure 8. HI in IC 0719 and IC 0718. The optical image is the MATLAS r image (Duc et al. 2015). Contours are (−1, 1, 3, 5, 10, 30, 50) × 1.2 × 1019cm−2, where 1.2×1019cm−2is the nominal sensitivity in this image (Table2). PGC 036209 has a much higher velocity of 6372 km s−1(Haynes et al. 2018) so it is a distant background object.
Figure 9. Position-velocity slice between IC 0718 (left) and IC 0719 (right). In this slice the emission is averaged over a region 20400wide (∼ 2.5 beams).
on the receding side at 2032 and 1992 km s−1 and on the approaching side at 1712 and 1672 km s−1.
However, at radii> 10, the kinematic position angle of the HIrotates to be 288◦± 7◦. This outer kinematic position angle is strongly misaligned, as it is 124◦ (± 7◦) away from the kinematic position angle of the bulk of the stars. The large-scale HIdisc is irregular and blobby, with a lower
in-clination than the inner HIand CO disc; it is visible in the channel maps between 1952 km s−1 and 1752 km s−1. And since the resolution of the HIdata is rather low, the radius of the warp in the HIkinematics is rather poorly constrained, but we note that the CO kinematics are quite regular. We in-fer that the warp occurs somewhere between the outer edge of the CO disc (radius 1500= 2.1 kpc) and 10.
4.3.2 IC 0718 as the source of the gas in IC 0719
IC 0718, the companion, is a late-type galaxy and it also shows signs of an interaction. Its stellar distribution is asym-metric, with a relatively bright arm extending to the north and a stubby, faint tail extending to the south (Figures8and
12). The HIspectrum is also strongly asymmetric (Figure7), suggesting the HIdistribution is far from a relaxed equilib-rium state; the brighter HIemission is on the south side of the galaxy, coinciding with the low surface brightness stel-lar tail. The velocity field (Figure12) is mostly regular but that is probably a consequence of the relatively poor angular resolution in the HIdata. These stellar and HIasymmetries demonstrate that the galaxy has been involved in a recent interaction and therefore it is most likely the source of the HIrecently accreted onto IC 0719.
An hypothesized gas transfer from IC 0718 to IC 0719 suggests that IC 0718 should be HI-deficient for its stellar properties. The stellar mass of IC 0718 (Leroy et al. 2019) gives MHI/M?= 0.58, and according to the analysis ofBrown et al. (2015) this value is about a factor of 2.6 low for a galaxy of IC 0718’s stellar mass and NUV-r color. By this measure IC 0718 is unusually HI-deficient, and its expected HI content could easily supply the gas we now detect in IC 0719.
Estimates of the HIsize of IC 0718 give less conclusive answers to the question of whether its HIdisc is truncated. From the centroids of the emission in the extreme channels we estimate an HIdiameter of 10.6 kpc (we assume the same distance as for IC 0719). In contrast, a model fit to the HI
image cube using the 3DBarolo code (Di Teodoro & Frater-nali 2015) suggests that the HIdiameter at a surface density of 1 M pc−2is 19 kpc, and this latter value is entirely
con-sistent with the HImass-size relation ofWang et al.(2016). The extremely poor resolution in these HIdata means that comparisons to the mass-size relation are probably less reli-able than comparisons to the stellar mass.
For completeness we should also consider the possibility that the interaction between the two galaxies operates in the other direction, i.e. that IC 0719 had at least 109M of HI
before its encounter, and the disturbed HIkinematics might have arisen not because the gas has recently fallen in but because the gas has recently been pulled out by tidal forces. That scenario is possible, but it is not the simplest scenario to explain all of the observed properties of the system be-cause it does not address the counterrotating structures in IC 0719 or the HIdeficiency in IC 0718. IC 0718 is also about a factor of 10 less massive than IC 0719, making it unlikely that IC 0718 could do serious damage to a pre-existing disc in IC 0719.
5 DISCUSSION
The primary new result of the HI observations of IC 0719 is that they demonstrate clear and convincing evidence sup-porting an accretion scenario for the formation of (some of) the 2σ galaxies. The warped, irregular disc, which is relaxed into the equatorial plane at small radii, retrograde with re-spect to the bulk of the stars, and strongly misaligned at large radii, signals that new cold gas was accreted from some external source after the main stellar body was in place. The faint HItail pointing towards IC 0718 suggests its identifica-tion as the external source. The angular momentum of the accreted gas was dominated by the geometry of the galaxy interaction and in this case it happened to be misaligned by about 120◦ to the rotation of the primary stellar com-ponent. The gas then settled into the equatorial plane in the “minimal torque” sense, becoming misaligned by 180◦ to the primary stellar component. As the atomic gas con-densed into molecular gas, star formation began to form a secondary stellar disc that is counterrotating with respect to the primary stellar disc.
Katkov et al.(2013) andPizzella et al.(2018) have con-ducted extensive optical spectroscopy with analysis of the ionized gas and stellar populations in IC 0719. They pro-posed this accretion scenario on the basis of observations such as (1) the primary stellar component is older and more metal rich, and it has a higher velocity dispersion; and (2) the secondary stellar component, the one that rotates like the gas, is younger, with lower metallicity and velocity dis-persion. The fact that the younger stellar component has a lower metallicity clearly suggests the accretion of a large quantity of lower metallicity gas between the star formation episodes. The available information about the ionized gas metallicity is also consistent with this interpretation that IC 0719 acquired its gas from IC 0718. The MPA-JHU cat-alog (e.g. Tremonti et al. 2004), based on SDSS spectra, quotes 12+ log(O/H) = 8.61 ± 0.06 for the central regions of IC 0718, and the more detailed studies ofKatkov et al.
(2013) andPizzella et al.(2018) quote values of roughly 8.4 to 8.6 for IC 0719. But without the new HIdata presented here, there was no direct evidence of the warp that smoothly connects the HIbridge ofGrossi et al.(2009) through to the dynamically relaxed but retrograde molecular gas on ∼ kpc scales.
5.1 Evolutionary time-scales
Of the eleven 2σ galaxies that have been identified in the ATLAS3D survey, only five are currently known to contain large amounts of cold gas (Table1). Of these five, IC 0719 has the most obvious signs of a misaligned gas disc that is still in the process of settling towards the equatorial plane of the galaxy. Thus, it is relatively rare to “catch” a 2σ galaxy in this phase of its evolution.
Classically, the torques exerted on gas outside of the equatorial plane should cause the disc to precess and sink towards the equatorial plane in a few dynamical time-scales. Recent simulations byvan de Voort et al.(2015) confirm this idea, with the caveat that one should begin measuring a few dynamical time-scales from the time the accretion of cold gas slows to a trickle, rather than the time that the accre-tion begins. During the period of rapid gas accreaccre-tion, the
11
h40
m30
s24
s18
s12
s06
s9°02'
00'
8°58'
RA (J2000)
Dec (J2000)
HI
11
h40
m20
s19
s18
s17
s9°01'00"
00'45"
30"
15"
RA (J2000)
stars
11
h40
m20
s19
s18
s17
sRA (J2000)
CO
1700
1750
1800
1850
1900
1950
2000
Velocity (km/s)
Figure 10. HI, stellar and CO velocity fields of IC 0719. For HI, the white contours show the column density as in Figure8and the black contours are from the optical image to show where the main stellar body of the galaxy is located. In the stellar velocities (centre panel), the black contours are again the stellar surface brightness. The primary stellar component defined byPizzella et al.(2018) is receding on the northeast side of the galaxy; the secondary component is receding on the southwest side of the galaxy. The secondary component dominates the stellar velocity measurements in the annulus between the highest contour and the second-highest contour (radii 400 to 1000); the primary component dominates both at smaller radii and at larger radii. In the CO field, black contours show the integrated CO surface brightness. Beam sizes are indicated by the ellipses.
Figure 11. Channel maps of IC 0719. The greyscale background is the MATLAS g image; pink contours are HI at levels of (−3, −2, 2, 3, 5, 7) ×0.85 mJy beam−1. The velocity of each channel is written in the top left corner. CO emission in the interior of the galaxy (Alatalo et al. 2013) is indicated in tiny white contours near the galaxy centre.
11
h40
m00
s39
m55
s50
s45
s8°54'
53'
52'
51'
50'
RA (J2000)
Dec (J2000)
1900 1920 1940 1960 1980 2000 2020 2040
km s
1Figure 12. Velocity field of IC 0718 (neighbor to IC 0719). Thick white contours are the HI column density, as in Figure8, and thin black contours are from the MATLAS g image. The beam size is indicated by the gray ellipse.
orbital dynamics of the inflowing gas dominate the angu-lar momentum evolution, and it is only after the accretion shuts down that the torque-driven precession can dominate the evolution and develop a warp. (Bryant et al. 2019, and others, have additionally noted that gas can persist in po-lar orbits for many dynamical times because the torques are very small.)
For comparison, in section 4.3.1 we inferred that the warp in the HI disc of IC 0719 occurs somewhere in the range 1500 . r . 10. The dynamical time at the outer edge of the CO disc (r = 1500) is roughly 70 Myr, at 10it is 280 Myr, and at the outer edge of the HIdisc it is roughly 700 Myr. The simulations of van de Voort et al. (2015) thus suggest that the gas accretion onto IC 0719 shut down on the order of 0.5 to 2 Gyr ago (6 dynamical times), but not as long as ∼ 4 Gyr ago, or a larger portion of the HIdisc would be aligned by now. Of course, this analysis assumes that the dark matter halo of IC 0719 is either spherical or well aligned with the stellar body of the galaxy (so that the outer parts of the HIdisc are not in an equatorial plane in their current orientation). These time-scales are consistent with the finding ofPizzella et al.(2018) that the secondary stellar component has a luminosity-weighted mean age of 1.5 Gyr.
Curiously, there is also evidence from Katkov et al.
(2013) and Pizzella et al. (2018) that there was a previ-ous episode of gas accretion and star formation in IC 0719, beginning on the order of 4 Gyr ago, and also contributing to the growth of the counterrotating (secondary) stellar disc though not dominating its mass. The timing of that star for-mation episode is in tension with the timing we infer from the HIkinematics, so it is not clear whether it is connected
to the events we now find displayed in the HIproperties of the system.
5.2 Gas and stellar masses
Based on its Ks luminosity, the stellar mass of IC 0719 is
approximately 2 × 10¹⁰M ; we find 109M of HIand 2 × 10⁸
M of molecular gas (Table1). Thus, the current masses of
HIand H2are not large enough to form stellar discs that are
an appreciable fraction of the current stellar mass, and we infer that the total mass of accreted gas was much higher than the present-day remnants. Specifically, Pizzella et al.
(2018) find that the secondary stellar component in IC 0719 contributes ∼ 35% of the galaxy’s light; if it then contains 20% of the galaxy’s stellar mass (because of being younger), its mass is 4 × 10⁹ M . That is still a factor of two larger
than the expected HI content of IC 0718 (Section 4.3.2). These considerations do not necessarily rule out IC 0718 as the source of the gas that built the secondary stellar disc, however, because of the unknown contribution of molecular gas, the significant scatter in the cold gas scaling relations (Catinella et al. 2018), and because the expected size of the gas reservoir would be galaxies’ gas contents several Gyr ago rather than their gas contents today.
Similar comments about the necessity for large accreted masses also apply to NGC 4191, the other ATLAS3D 2σ galaxy with a relatively large cold gas mass (Young et al. 2018). For comparison to IC 0719, NGC 4191 has a very large asymmetric HIdisc, 110 kpc in diameter, with an in-ternal twist or warp, and again it is clear that the secondary, younger stellar disc formed out of the counterrotating cold gas disc. Like IC 0719, NGC 4191 also has a gas-rich neigh-bor nearby in projection (NGC 4180, separated by 600 km s−1 and 160 kpc), but unlike IC 0719, NGC 4191 has no sign of any HIbridge or tail to its neighbor. Young et al.
(2018) argued that the gas in NGC 4191 was accreted from an external source based on HI-stellar misalignments, and
Coccato et al.(2015) used the stellar data to argue for an accretion model through filamentary cold flows. A filamen-tary cold flow model has the advantage that it could offer essentially limitless quantities of cold gas, easily explaining the large gas content of NGC 4191. In short, IC 0719 is sim-ilar to NGC 4191 in broad respects but the HIin IC 0719 has much more dramatically disturbed kinematics, perhaps because of being in an earlier dynamical stage or having a different source.
6 FORMATION SCENARIOS FOR THE ATLAS3D 2σ GALAXIES
As discussed byKatkov et al.(2016), one useful perspective on the formation of the discy stellar counterrotator 2σ galax-ies is that their multiple spin structures required multiple episodes of assembly, and the primary distinction between the various scenarios is how much of the new misaligned or counterrotating material was already in the form of stars when it joined its current host. In the merger scenario, most of the new material was already in the form of stellar discs; this scenario is rather restrictive in the sense that it requires a special geometry to avoid disrupting the discs during the merger, but it allows a wide variety of ages and velocity
dispersions in the final structures. Bois et al.(2011) show that appropriately aligned mergers with differing mass ra-tios can make remnants that look like slow rotators with kinematically decoupled cores as well as remnants that look like flattened double disc stellar counterrotators.
The gas accretion scenario accommodates a wider vari-ety of initial geometries, but it makes more specific predic-tions that one of the discs must be younger and thinner than the other, and that the cold gas must be associated with the thin disc. This scenario appears to be prevalent in cosmolog-ical simulations.Taylor et al.(2018) studied a sample of 82 well-resolved simulated early-type galaxies and found 5 that could be the predecessors of our observed stellar counterro-tators, and all of them formed via the accretion mechanism.
Starkenburg et al.(2019) also identified the accretion mech-anism as the source of long-lived counterrotating gas discs in the galaxies of the Illustris simulation.
IC 0719 is clearly an example of the gas accretion case, but the situation is less clear for the other galaxies observed here. If we assume that the HIis associated with the thin blue disc and the dust lane in NGC 7710, then NGC 7710 is probably another gas accretion case. It may be a more advanced version of the scenario in IC 0719, where the kine-matic signatures of the accretion are more dissipated, warps have disappeared, and the modest lopsidedness of the HIdisc is the only interaction signature remaining in the gas. But the interpretation of the stellar velocity field in NGC 7710 is not straightforward; if the stellar velocities at large dis-tances above the midplane indicate the rotation of the thick stellar spheroid, then HIrotates like the thicker stellar com-ponent, and it’s not clear whether that is also the same sense as the blue dusty disc. The HIcertainly does not rotate like the stellar component visible at radii< 400(Figure3). This latter feature might be a sign of yet a third stellar compo-nent in NGC 7710, which complicates its interpretation. In PGC 056772 the angular resolution in the cold gas data is not good enough to associate the gas with a specific stel-lar disc, though an extraplanar tail would again suggest the accretion model. And in both of these cases, detailed de-compositions of the stellar populations (like those done for IC 0719 by Katkov et al and Pizzella et al) would be helpful for understanding the relative ages and structural properties of the stellar populations.
Within the context of the accretion scenario, a further distinction might be made between accretion from another galaxy (as appears to be the case for IC 0719) and accretion from a misaligned filament of the cosmic web, as advocated byAlgorry et al.(2014). If the suggested interaction partner (e.g. IC 0718) cannot be identified, it may be difficult to distinguish between these two types of accretion scenarios on the basis of kinematics alone, but measurements of the gas and stellar metallicities should be useful.
Table1summarizes the cold gas contents and proposed formation scenarios for the 2σ galaxies in the ATLAS3D
sample. We note that in the current data, only one of the eleven 2σ galaxies shows dramatic cold gas signatures of interaction or accretion within the last few Gyr. However, amongst the 2σ galaxies there are actually only four that are known to contain any HI at all. The time-scales discussed above might thus be consistent with the presence of one strongly warped HIdisc. Six of the eleven are currently not detected in either HIor CO emission, and we speculate that
they experienced their merger/acquisition processes many Gyr ago and their cold gas has since dissipated.
Of the eleven ATLAS3D 2σ galaxies, then, five are known to have cold gas; these five, plus an additional one without cold gas detections, have been studied in enough de-tail to suggest formation mechanisms. Four of them appear to have formed through a process of clearing out their orig-inal cold gas and then acquiring new, misaligned gas that settled into retrograde discs. The other two appear to have formed through the aligned merger mechanism. These num-bers are, of course, still very small. More work should be done to develop this specific point of comparison between real galaxies and simulations, as it can be a test of the ac-curacy of the simulations’ treatment of baryonic physics.
Beyond the cases that are presently observed to have two counterrotating stellar discs, the ATLAS3Dsample con-tains a number of others with counterrotating molecu-lar discs. Notable examples in Davis et al. (2013) include NGC 3032, NGC 3626, and NGC 4694. Still others with counterrotating ionized gas discs are noted inDavis et al.
(2011), and they may have molecular gas below the detec-tion limits of our CO survey. The counterrotating molecular disc in NGC 3032 is associated with a small, young coun-terrotating stellar core which can only be seen with sub-arcsecond stellar kinematic data (McDermid et al. 2006a,b), so it is clearly a less extreme version of the 2σ galaxies, and the others with retrograde atomic and/or molecular discs might be as well. The HIsurvey in S14also contains many dramatic examples of disturbed HIkinematics in early-type galaxies, and some of these are likely to be in the early stages of misaligned accretion, so they might develop small or faint counterrotating stellar discs in the future (Yıldız et al. 2017,
2020).
Thus, the overall importance of the accretion-driven multi-spin phenomenon is likely to be much higher than the ∼ 4% incidence of the 2σ galaxies. This is especially true if one includes the additional 6% of early-types that are prograde versions of the same phenomenon, those with counterrotating gas, and possibly also some of the 7% that have kinematically decoupled cores.
These accretion processes should be expected in spirals as well. NGC 5719 is a prominent and unusual example of a spiral galaxy showing the double-disc stellar counterrotation phenomenon; it has a larger HIcontent than IC 0719, with more dramatic tails (Vergani et al. 2007), and it appears to be in an earlier stage of the process based on the stellar age measurements ofCoccato et al.(2011). The inevitable dissi-pational nature of HIhas led authors such as Coccato et al to suggest that the accretion-driven multi-spin phenomenon can only work in spirals if the mass of accreted gas over-whelms the pre-existing gas. Small quantities of accreted gas should simply be entrained into the pre-existing disc on short time-scales. Thus one might expect the accretion-driven multi-spin phenomenon to be somewhat easier or more common in early-type galaxies, where the pre-existing cold gas is less abundant. Along those lines, more general studies of gas-stellar kinematic misalignments in simulations have confirmed that significant gas loss is an important prior step to developing misalignment (Duckworth et al. 2020;
Starkenburg et al. 2019). Thus, the early-type galaxies are especially valuable for studying present-day gas accretion rates and their effects on their host galaxies.
7 SUMMARY
We present new VLA HIobservations of five of the ATLAS3D 2σ galaxies, plus archival VLA data on another. These data now complete the cold gas observations of the known 2σ galaxies in ATLAS3Dsuch that all of them have been
searched for CO emission and all have interferometric HI
data. The detection rate of HIin the 2σ galaxies is 4/11,
and the detection rate of cold gas (atomic or molecular) is 5/11, similar to that of the ATLAS3D sample as a whole (S12).
We find a small amount of HIin PGC 056772, and the emission is not well resolved so we have little information on its dynamical status. In NGC 7710 we find an HIdisc that is largely relaxed though somewhat lopsided, with 30% more gas and a larger extent on one side than on the other. There is no sign of extraplanar gas in NGC 7710 at the current resolution.
IC 0719 shows a strongly warped HIdistribution. The inner part of the HIdisc neatly matches the CO distribu-tion and kinematics, which also matches the rotadistribu-tion of the secondary stellar disc but counterrotates with respect to the bulk of the stars. The outer part of the HIforms an irregular, clumpy disc whose rotation axis is misaligned by about 60◦ from the symmetry axis of the galaxy (and whose kinematic position angle is 120◦from the corresponding position angle of the primary stellar component). A faint HIextension to the south of IC 0719 is probably the bright and close inner portion of a tail connecting IC 0719 to IC 0718, as proposed byGrossi et al.(2009) based on Arecibo data. The full tail is evidently too faint to be detected in the present VLA data. IC 0718 shows asymmetric HIand stellar distributions, and a stellar tidal tail, and it is clearly implicated as the source of the HIin IC 0719. These data therefore confirm a gas ac-cretion model (rather than a binary merger model) for the origin of the counterrotating stellar disc in IC 0719. The gas fell in along orbits closer to retrograde than to prograde, and as it settled into the symmetry plane it formed the sec-ondary stellar disc. Estimates of the radius of the HIwarp constrain the time-scale of the accretion event such that the heavy period of gas accretion slowed and/or ceased around 0.5 to 2 Gyr ago, in agreement with the stellar ages.
Six of the eleven 2σ galaxies in ATLAS3D have now
been studied in enough detail to make probable identifica-tions of their formation mechanisms. Two appear to have been formed through the aligned merger process and four through retrograde gas accretion. Clarifying the physical processes that create the 2σ galaxies and their cousins is important because large-scale cosmological simulations are now beginning to reproduce them, so that quantitative com-parisons can be used to verify the simulations. Detailed ex-amination of the ATLAS3D sample also suggests that the misalignment/counterrotation phenomenon is very common, with the 2σ galaxies being just the most extreme examples of phenomena that are visible in the stars of nearly 20% of local early-type galaxies. Misaligned or counterrotating gas is even more common. These phenomena are not well preserved in spirals, so the early-type galaxies give useful perspectives for comparisons with simulations.
ACKNOWLEDGMENTS
Thanks to Tim Davis for discussions about the metallicities of IC 0719 and IC 0718.
The National Radio Astronomy Observatory is a facility of the National Science Foundation operated under cooper-ative agreement by Associated Universities, Inc.
The Legacy Surveys consist of three individual and complementary projects: the Dark Energy Camera Legacy Survey (DECaLS; NOAO Proposal ID # 2014B-0404; PIs: David Schlegel and Arjun Dey), the Beijing-Arizona Sky Survey (BASS; NOAO Proposal ID # 2015A-0801; PIs: Zhou Xu and Xiaohui Fan), and the Mayall z-band Legacy Survey (MzLS; NOAO Proposal ID # 2016A-0453; PI: Ar-jun Dey). DECaLS, BASS and MzLS together include data obtained, respectively, at the Blanco telescope, Cerro Tololo Inter-American Observatory, National Optical Astronomy Observatory (NOAO); the Bok telescope, Steward Observa-tory, University of Arizona; and the Mayall telescope, Kitt Peak National Observatory, NOAO. The Legacy Surveys project is honored to be permitted to conduct astronomi-cal research on Iolkam Du’ag (Kitt Peak), a mountain with particular significance to the Tohono O’odham Nation.
NOAO is operated by the Association of Universities for Research in Astronomy (AURA) under a cooperative agree-ment with the National Science Foundation.
This project used data obtained with the Dark En-ergy Camera (DECam), which was constructed by the Dark Energy Survey (DES) collaboration. Funding for the DES Projects has been provided by the U.S. Department of En-ergy, the U.S. National Science Foundation, the Ministry of Science and Education of Spain, the Science and Technology Facilities Council of the United Kingdom, the Higher Educa-tion Funding Council for England, the NaEduca-tional Center for Supercomputing Applications at the University of Illinois at Urbana-Champaign, the Kavli Institute of Cosmological Physics at the University of Chicago, Center for Cosmol-ogy and Astro-Particle Physics at the Ohio State University, the Mitchell Institute for Fundamental Physics and Astron-omy at Texas A&M University, Financiadora de Estudos e Projetos, Fundacao Carlos Chagas Filho de Amparo, Fi-nanciadora de Estudos e Projetos, Fundacao Carlos Chagas Filho de Amparo a Pesquisa do Estado do Rio de Janeiro, Conselho Nacional de Desenvolvimento Cientifico e Tecno-logico and the Ministerio da Ciencia, Tecnologia e Inovacao, the Deutsche Forschungsgemeinschaft and the Collaborating Institutions in the Dark Energy Survey. The Collaborating Institutions are Argonne National Laboratory, the Univer-sity of California at Santa Cruz, the UniverUniver-sity of Cam-bridge, Centro de Investigaciones Energeticas, Medioambi-entales y Tecnologicas-Madrid, the University of Chicago, University College London, the DES-Brazil Consortium, the University of Edinburgh, the Eidgenossische Technische Hochschule (ETH) Zurich, Fermi National Accelerator Lab-oratory, the University of Illinois at Urbana-Champaign, the Institut de Ciencies de l’Espai (IEEC/CSIC), the Institut de Fisica d’Altes Energies, Lawrence Berkeley National Labo-ratory, the Ludwig-Maximilians Universitat Munchen and the associated Excellence Cluster Universe, the University of Michigan, the National Optical Astronomy Observatory, the University of Nottingham, the Ohio State University, the University of Pennsylvania, the University of Portsmouth,
SLAC National Accelerator Laboratory, Stanford Univer-sity, the University of Sussex, and Texas A&M University.
The Legacy Surveys imaging of the DESI footprint is supported by the Director, Office of Science, Office of High Energy Physics of the U.S. Department of Energy under Contract No. DE-AC02-05CH1123, by the National Energy Research Scientific Computing Center, a DOE Office of Sci-ence User Facility under the same contract; and by the U.S. National Science Foundation, Division of Astronomical Sci-ences under Contract No. AST-0950945 to NOAO.
REFERENCES
Alatalo K., et al., 2013,MNRAS,432, 1796
Algorry D. G., Navarro J. F., Abadi M. G., Sales L. V., Steinmetz M., Piontek F., 2014,MNRAS,437, 3596
Bois M., et al., 2011,MNRAS,416, 1654
Bournaud F., Jog C. J., Combes F., 2005,A&A,437, 69 Brown T., Catinella B., Cortese L., Kilborn V., Haynes M. P.,
Giovanelli R., 2015,MNRAS,452, 2479 Bryant J. J., et al., 2019,MNRAS,483, 458 Cappellari M., et al., 2011,MNRAS,413, 813 Cappellari M., et al., 2013,MNRAS,432, 1709 Catinella B., et al., 2018,MNRAS,476, 875
Coccato L., Morelli L., Corsini E. M., Buson L., Pizzella A., Ver-gani D., Bertola F., 2011,MNRAS,412, L113
Coccato L., Morelli L., Pizzella A., Corsini E. M., Buson L. M., Dalla Bont`a E., 2013,A&A,549, A3
Coccato L., et al., 2015,A&A,581, A65
Condon J. J., Cotton W. D., Greisen E. W., Yin Q. F., Perley R. A., Taylor G. B., Broderick J. J., 1998,AJ,115, 1693 Crocker A. F., Jeong H., Komugi S., Combes F., Bureau M.,
Young L. M., Yi S., 2009,MNRAS,393, 1255
Crocker A. F., Bureau M., Young L. M., Combes F., 2011, MN-RAS,410, 1197
Davis T. A., et al., 2011,MNRAS,417, 882 Davis T. A., et al., 2013,MNRAS,429, 534
Di Teodoro E. M., Fraternali F., 2015,MNRAS,451, 3021 Duc P.-A., et al., 2015,MNRAS,446, 120
Duckworth C., Tojeiro R., Kraljic K., 2020,MNRAS,492, 1869 Ene I., et al., 2018,MNRAS,479, 2810
Grossi M., et al., 2009,A&A,498, 407 Habas R., et al., 2019,MNRAS,p. 2656 Haynes M. P., et al., 2018,ApJ,861, 49 Jin Y., et al., 2016,MNRAS,463, 913
Johnston E. J., Merrifield M. R., Arag´on-Salamanca A., Cappel-lari M., 2013,MNRAS,428, 1296
Katkov I., Chilingarian I., Sil’chenko O., Zasov A., Afanasiev V., 2011,Baltic Astronomy,20, 453
Katkov I. Y., Sil’chenko O. K., Afanasiev V. L., 2013,ApJ,769, 105
Katkov I. Y., Sil’chenko O. K., Chilingarian I. V., Uklein R. I., Egorov O. V., 2016,MNRAS,461, 2068
Krajnovi´c D., et al., 2011,MNRAS,414, 2923 Leroy A. K., et al., 2019,ApJS,244, 24
McDermid R. M., et al., 2006a,New Astron. Rev.,49, 521 McDermid R. M., et al., 2006b,MNRAS,373, 906
Mitzkus M., Cappellari M., Walcher C. J., 2017, MNRAS,464, 4789
Nedelchev B., et al., 2019,A&A,623, A87
Pizzella A., Morelli L., Coccato L., Corsini E. M., Dalla Bont`a E., Fabricius M., Saglia R. P., 2018,A&A,616, A22 Serra P., et al., 2012,MNRAS,422, 1835
Serra P., et al., 2014,MNRAS,444, 3388
Starkenburg T. K., Sales L. V., Genel S., Manzano-King C., Canalizo G., Hernquist L., 2019,ApJ,878, 143
NGC 4259
Figure A1. HI column density in the field of NGC 4273. The grayscale is the MATLAS g image (Duc et al. 2015). Contours are (−1, 1, 3, 5, 7) × 5.4 × 1020 cm−2, which is the nominal column density limit in these data. The resolution of the HI data is shown as a small white ellipse in the lower left corner.
Taylor P., Federrath C., Kobayashi C., 2018,MNRAS,479, 141 Tremonti C. A., et al., 2004,ApJ,613, 898
Vergani D., Pizzella A., Corsini E. M., van Driel W., Buson L. M., Dettmar R. J., Bertola F., 2007,A&A,463, 883
Wang J., Koribalski B. S., Serra P., van der Hulst T., Roychowd-hury S., Kamphuis P., Chengalur J. N., 2016,MNRAS,460, 2143
Yıldız M. K., Serra P., Peletier R. F., Oosterloo T. A., Duc P.-A., 2017,MNRAS,464, 329
Yıldız M. K., Peletier R. F., Duc P. A., Serra P., 2020,A&A,636, A8
Young L. M., et al., 2011,MNRAS,414, 940
Young L. M., Serra P., Krajnovi´c D., Duc P.-A., 2018,MNRAS, 477, 2741
van de Voort F., Davis T. A., Kereˇs D., Quataert E., Faucher-Gigu`ere C.-A., Hopkins P. F., 2015,MNRAS,451, 3269
APPENDIX A: COLLATERAL DETECTIONS We find no other significant HI emission in the field of NGC 7710 or NGC 0448. In the field of NGC 4259 there is bright HIemission in the spiral NGC 4273 (FigureA1); we find 16.8 ± 0.8 Jy km s−1 from NGC 4273, which is rather asymmetric both in HIand in optical emission, but kinematically mostly regular. Several other galaxies are also within the VLA field of view, but no other HI emission is detected and there are no optical indications that NGC 4259 has suffered a recent interaction.
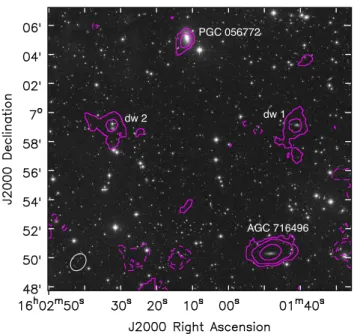
Our HIobservations of PGC 056772 also show emission from three nearby dwarf galaxies (FigureA2). The source listed in the ALFALFA catalog as AGC 716496 (Haynes et al. 2018) has a total flux of 1.20 ± 0.1 Jy km s−1 and is found in velocities from 1700 to 1834 km s−1. It is 16.20 from PGC 056772, near the half-power point of the primary beam. The source we have called “dwarf 1” has only 0.32 ± 0.06 Jy km s−1 in HI, so it is too faint to be listed in
PGC 056772
AGC 716496 dw 1 dw 2
Figure A2. HI in the field of PGC 056772. The greyscale is the MATLAS g image; contours are (−3, −1, 1, 3, 10) × 1.36 × 1019cm−2, which is the nominal column density limit towards the VLA point-ing centre (PGC 056772). The resolution of the HI data is shown as a white ellipse in the lower left corner.
the ALFALFA catalog. It is found in velocities 1480 – 1566 km s−1. The source we are calling “dwarf 2” has 0.19 ± 0.04 Jy km s−1 and is also too faint for the ALFALFA catalog, and is found in velocities 2693 – 2791 km s−1. Finally, in the field of NGC 4803 we find 1.3 ± 0.2 Jy km s−1of HIemission from UGC 08045, which is 19.60south of NGC 4803 (Figure
A3).
This paper has been typeset from a TEX/LATEX file prepared by the author.
NGC 4803
Figure A3. HI in the field of NGC 4803. The greyscale is the DESI Legacy Survey g image; contours are (−2, 2, 5, 10) × 1.4 × 1019cm−2, which is the nominal column density limit towards the VLA pointing centre (NGC 4803). An extended contour near the spiral NGC 4795, near the centre of this figure, may represent marginally significant HI emission but as it is near the half-power point of the primary beam, the quality of the imaging is not good. The resolution of the HI data is shown as a white ellipse in the lower left corner.