HAL Id: hal-00329348
https://hal.archives-ouvertes.fr/hal-00329348
Submitted on 14 Jul 2004
HAL is a multi-disciplinary open access
archive for the deposit and dissemination of
sci-entific research documents, whether they are
pub-lished or not. The documents may come from
teaching and research institutions in France or
abroad, or from public or private research centers.
L’archive ouverte pluridisciplinaire HAL, est
destinée au dépôt et à la diffusion de documents
scientifiques de niveau recherche, publiés ou non,
émanant des établissements d’enseignement et de
recherche français ou étrangers, des laboratoires
publics ou privés.
Distributed under a Creative Commons Attribution - NonCommercial| 4.0 International
License
plasmapause
A. Masson, U. S. Inan, H. Laakso, O. Santolik, Pierrette Décréau
To cite this version:
A. Masson, U. S. Inan, H. Laakso, O. Santolik, Pierrette Décréau. Cluster observations of
mid-latitude hiss near the plasmapause. Annales Geophysicae, European Geosciences Union, 2004, 22 (7),
pp.2565-2575. �10.5194/angeo-22-2565-2004�. �hal-00329348�
Cluster observations of mid-latitude hiss near the plasmapause
A. Masson1, U. S. Inan2, H. Laakso1, O. Santol´ık3, and P. D´ecr´eau4
1RSSD of ESA, ESTEC, Noordwijk, 2201AZ, The Netherlands
2STAR Laboratory, Stanford University, Stanford, CA 94305, USA
3Charles University, Prague, Czech Republic
4LPCE/CNRS and Universit´e d’Orl´eans, Orl´eans, 45071, France
Received: 1 October 2003 – Revised: 24 May 2004 – Accepted: 24 June 2004 – Published: 14 July 2004 Part of Special Issue “Spatio-temporal analysis and multipoint measurements in space”
Abstract. In the vicinity of the plasmapause, around the geomagnetic equator, the four Cluster satellites often ob-serve banded hiss-like electromagnetic emissions (BHE); be-low the electron gyrofrequency but above the be-lower hybrid resonance, from 2 kHz to 10 kHz. We show that below 4 kHz, these waves propagate in the whistler mode. Using the first year of scientific operations of WHISPER, STAFF and WBD wave experiments on Cluster, we have identified the follow-ing properties of the BHE waves: (i) their location is strongly correlated with the position of the plasmapause, (ii) no MLT dependence has been found, (iii) their spectral width is gen-erally 1 to 2 kHz, and (iv) the central frequency of their emission band varies from 2 kHz to 10 kHz. All these fea-tures suggest that BHE are in fact mid-latitude hiss emis-sions (MLH). Moreover, the central frequency was found to
be correlated with the Kp index. This suggests either that
these banded emissions are generated in a given f/fcerange,
or that there is a Kp dependent Doppler shift between the
satellites and a possible moving source of the MLH.
Key words. Magnetospheric physics (plasmasphere;
plasmapause; whistler mode waves)
1 Introduction
The plasmasphere is an inner magnetospheric region, lo-cated above the ionosphere. Its shape is usually compared to a torus around the Earth, which bulges out to the dusk side. At the equator, it typically extends out to distances of
≈4−5 Earth radii. Its density is high and its temperature
low (>100 cm−3, ∼1 eV) compared to the outer tenuous and
warm magnetospheric plasma (a few e-/cc, 100–1000 eV). Its outer boundary, the plasmapause, separates the plasmasphere from the rest of the magnetosphere.
Correspondence to: A. Masson ([email protected])
The plasmapause was observed by Carpenter (1963) after analyzing whistlers, measured by ground based Very Low Frequency (VLF, 3–30 kHz) receivers. Whistlers are VLF electromagnetic waves produced by lightning, which have a typical whistling tone when turned to audio. They propagate through the magnetosphere in a mode of propagation called the whistler mode (Stix, 1992).
Whistlers are not the only waves that propagate in the whistler mode, e.g. auroral hiss, chorus, mid-latitude hiss, narrow-band plasmapause hiss, plasmaspheric hiss (Sazhin, 1993; Ondoh, 1993; Sonwalkar, 1995). All these waves are observed at frequencies below the electron gyrofrequency,
fce, or the plasma frequency, Fp, whichever is lower;
typi-cally in the VLF and the Extremely Low Frequency (ELF) ranges. In this paper, ELF covers the following frequency range: 3 Hz–3 kHz.
Through wave-particle interactions, whistler mode waves can perturb the underlying ionosphere by scattering radia-tion belt electrons from their orbits (Helliwell et al., 1973;
Burgess and Inan, 1993). The ionospheric perturbations
produced, include X-rays, optical emissions, and density enhancements (e.g. Rosenberg et al., 1971; Helliwell and Mende, 1980; Paschmann et al., 2003).
The Cluster space fleet perigee passes (L∼4) provide ex-cellent opportunities to study whistler mode waves near the equatorial plane, which is indeed the source location of some whistler mode waves (e.g. chorus). Moreover, in the vicin-ity of the plasmapause, the equatorial region appears to be a favored location for amplification of (nearly) constant fre-quency whistler mode signals (Helliwell, 1988; Lemaire and Gringauz, 1998).
Moullard et al. (2002) reported an unidentified 3–6 kHz whistler mode emission, observed by all Cluster spacecraft near perigee, on 5 June 2001. This event was measured inside and just outside the plasmasphere (∼1 h duration). This emission band appeared anti-correlated with large den-sity enhancements, suggesting trough ducting. The authors argued that these waves could be generated near or at the
plasmapause, propagating back and forth with respect to the geomagnetic equator. Data from one Cluster satellite were displayed and no polarization evidence was presented.
A similar band-limited emission was observed by all Clus-ter spacecraft during ∼30 min, on 7 October 2001 (see Fig. 1). Like mid-latitude hiss, its frequency range is in-cluded between ∼2 and 10 kHz (Sonwalkar, 1995). Figure 2 displays fine details of this 5–6 kHz emission during 30 s. Rising tones, possibly whistlers, are embedded in the midst of the band (see white arrows in Fig. 2). This observational fact is also in common with mid-latitude hiss (Sonwalkar, 1995).
But these few similarities are not enough to qualify these two band-limited emissions as mid-latitude hiss (for a re-view, see Hayakawa and Sazhin, 1992). A survey needs to be conducted to check their geophysical properties. Mean-while, these emissions will be called banded hiss-like emis-sion (BHE); banded hiss is a VLF hiss, banded in frequency, which has long been observed on the ground in middle lati-tudes (e.g. Morgan, 1979).
We have found twenty-seven cases of BHE over the first 14 months of the Cluster mission. In this paper, we present, for the first time, some geophysical properties of the BHE, by attempting to answer the following questions: (i) what are the common features between these 27 cases?, (ii) what can we learn about the BHE source location through multipoint measurements?, (iii) what are the propagation features of the BHE?, (iv) is there any magnetic latitude or magnetic local time dependence?, (v) why have these waves not been ob-served and studied by previous satellites like DE-1 or Polar?, (vi) is it always the same frequency band? If not, is there any correlation with the geomagnetic activity? And finally, can we qualify the BHE as mid-latitude hiss?
2 Cluster instruments and data products used
The four Cluster spacecraft (thereafter called C1, C2, C3 and C4) were successfully launched in pairs in July and August 2000. After six months of maneuvers and commissioning, the scientific mission started on 1 February 2001. The wave sensors on each satellite consist of a boom-mounted three-axis search coil magnetometer and four electric probes at the ends of four 42.5 m long booms in the spin plane (Es-coubet et al., 1997a). Electric field spectrograms from 2 to 80 kHz are provided by the Waves of HIgh frequency and Sounder for Probing of Electron density by Relaxation
(WHISPER) experiment (D´ecr´eau et al., 1997). Below
4 kHz, electric and magnetic spectra are provided by the Spatio-Temporal Analysis of Field Fluctuations (STAFF) ex-periment (Cornilleau-Wehrlin et al., 1997). The WideBanD (WBD) experiment provides very high-rate digital samples of electric and magnetic waveforms in three possible fre-quency bands, 25 Hz–9.5 kHz, 50 Hz–19 kHz, and 1 kHz– 77 kHz (Gurnett et al., 1997).
The data used for this survey are primarily WHISPER spectrograms measured from February 2001 to March 2002,
and WBD high time resolution waveforms, turned to spectro-grams. STAFF data analysis was performed when the BHE were observed below 4 kHz.
3 Properties and common features of the BHE
Twenty-seven BHE cases have been found over the first 14 months of scientific operations of Cluster. They are all listed in the Appendix.
Each time, their spectral width is of the order of 1 to 2 kHz. Their frequency bandwidth is always between 2 kHz and
10 kHz, in between the lower hybrid resonance flh (∼300–
400 Hz) and fce(∼12 kHz). They last from a few minutes to
an hour, always corresponding to middle invariant latitudes (i.e. included in the 50◦–67◦range).
Thanks to the multipoint measurements of Cluster, some features of the BHE source may be deduced (Sect. 3.1). The electromagnetic nature of the BHE and its propagation char-acteristics are then presented through the analysis of a case study (Sect. 3.2). Moreover, as the Cluster mission covers all MLT sectors over one year, the question of a possible MLT dependence of the BHE is addressed in Sect. 3.3. All these properties, together with the analysis of an apparent magnetic latitude confinement, will help to understand why Cluster of-ten observes these waves (Sect. 3.4). The geomagnetic activ-ity dependence of the central frequency of the BHE is inves-tigated in Sect. 3.5. Whether or not qualifying these BHE as mid-latitude hiss is discussed in Sect. 3.6.
3.1 Features of the BHE source by multipoint analysis
Redundant features of the BHE source will now be illus-trated on two significant cases: 7 and 10 October 2001. As a reminder, the light blue curve (going on Fig. 1 from 30 to 80 kHz and then from 80 to 10 kHz) represents natural
emis-sions whose lower cutoff corresponds to Fp. This cutoff
en-ables one to follow the electron density (Ne), with Fp2(kHz) ∼81 Ne(cm−3).
On 7 October 2001 (Fig. 1), a BHE ∼5 kHz is observed simultaneously on C1, C2 and C4 (16:25–17:04 UT). As one can see in the top panel of Fig. 3, the lower the altitude, the more intense the BHE: C4>C2>C1. Forty-five minutes later, when C3 arrives in the plasmapause, following nearly the same orbit as C2, the intensity of the BHE has strength-ened. This fact has at least three possible explanations. Ei-ther the BHE source is moving towards C3, or the intensity of the source has increased, or a mix of these two possibilities.
In more than 80% of the cases selected, the BHE is ob-served on each of the four Cluster satellites. Within the five remaining cases, the BHE is only observed on three, two or one spacecraft.
Such an event occurred on 10 October 2001 (see Fig. 4), only three days after the previous case. Between these two events, the geomagnetic activity has significantly increased. The bottom panel of Fig. 3 illustrates this increase by
C3
C1
C2
C1 C2 C3Fig. 1. From top to bottom, WHISPER spectrograms measured by C1 to C4 on 7 October 2001, from 14:45 UT to 18:30 UT. Note the presence of a banded hiss-like emission from 16:25 UT to 17:04 UT, pointed out by white arrows, which intensifies with altitude: C4>C2>C1 (see right panel of Fig. 3) and with time C3 C4>C2>C1. In the last panel, the black box, pointed out by a black arrow, symbolizes the time period and the frequency range of the enlargement displayed in Fig. 2.
Fig. 2. High time resolution WBD electric field spectrogram measured by C4 on 7 October 2001, from 16:00:00.024 UT to 16:00:30.024 UT. The banded hiss-like emission (BHE) is observed just above 5 kHz. Two rising tones, possibly whistlers, are embedded in this BHE. They are pointed out by white arrows around 16:00:12 UT and 16:00:15 UT.
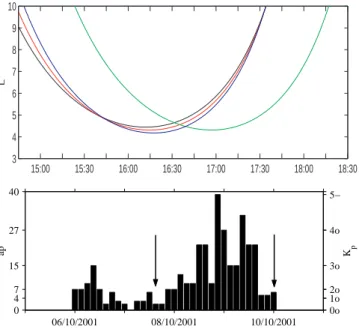
14:45 15:00 15:15 15:30 15:45 16:00 16:15 16:30 16:45 17:00 17:15 17:30 17:45 18:00 18:15 18:303 4 5 6 7 8 9 10 L 06/10/2001 08/10/2001 10/10/2001 0 4 7 15 27 40 ap 0o 1o 2o 3o 4o 5− Kp
Fig. 3. Top panel: orbit of the 4 Cluster satellites versus time on 7 October 2001 (1: black; 2: red; 3: green; 4: blue); bottom panel: evolution of the Apand the Kpindices during 6–10 October 2001
period, the arrows point at the time of the Cluster perigee passes.
this period, the plasmasphere has been thus compressed but
the Cluster perigee still remains near 4 RE. Therefore, while
on 7 October the electron density exceeded 80 cm−3for
al-most an hour (e.g. between 15:30 and 16:30 UT on C1), three days later, the electron density does not exceed 45 cm−3
(Fp<60 kHz) on C2, C3 and C4, and not even 30 cm−3
(Fp<50 kHz) on C1 (see Fig. 4).
On 10 October 2001, the BHE is clearly seen around 8 kHz on C4, between 01:29 and 01:41 UT. The same emission is barely visible on C2 and C3. No presence of this emission
can be seen on C1. This means that the Cluster spacefleet has to enter deep enough into the plasmapause to observe the BHE.
3.2 STAFF-SA analysis
Among the 27 BHE cases selected, eight of them have their frequency band lying, at least partially, below 4 kHz (STAFF upper frequency cutoff). All these STAFF cases are listed in the Appendix.
An example of such a case is presented in Fig. 5, measured by C1 on 5 June 2001. This figure shows 2 h of WHISPER (panel a) and STAFF (panels b to g) data, recorded during a perigee pass. The spacecraft is located in the dusk sector and moves along its orbit from the Southern to the Northern Hemisphere. The geomagnetic equatorial plane is crossed between 21:46 and 21:47 UT (zero crossing of the C1 Solar Magnetic latitude). Here, the BHE is banded inside the 3– 6 kHz range, observed from 21:20 to 22:20 UT (see panel a). The other panels of Fig. 5 display STAFF data and related data products from 60 Hz to 4 kHz, in logarithmic scale: (b) electric field spectrogram, (c) magnetic field spectrogram, (d) polarization planarity F , (e) parallel component of the Poynt-ing vector, normalized by its standard variation, (f) polariza-tion ellipticity L and (g) angle between the wave normal di-rection and the DC magnetic field. The calculations of the last four quantities are based on methods detailed in the fol-lowing papers and references therein (Santol´ık et al., 2001, 2003).
Before describing the BHE propagation characteristics above 2 kHz, let us first describe the most obvious fea-ture of panels (b) to (g): electromagnetic waves below
flh (∼400 Hz) but above the proton gyrofrequency fH +
C3
C2
C1
C1C2
C3
Fig. 4. WHISPER spectrograms measured by the four Cluster spacecraft on 10 October 2001, 00:30–03:30 UT. Note the presence of a short duration banded hiss-like emission, just after 01:30 on C4 and C2 (far less intense), and barely distinguishable 45 min later on C3.
(a) (b) (c) (d) (e) (f) (g)
Fig. 5. WHISPER and STAFF data measured by C1 on 5 June 2001 from 21:00 to 23:00 UT. From top to bottom: electric field spectrogram in linear scale [2 kHz, 80 kHz], electric field spectrogram [60 Hz, 4 kHz] in logarithmic scale, magnetic field spectrogram [60 Hz, 4 kHz] in logarithmic scale, polarization planarity, parallel component of the Poynting vector normalized by its standard deviation, polarization ellipticity and the angle between the DC magnetic field and the wave normal direction.
and within this frequency range, at least two distinct types of waves can be distinguished: waves below 200 Hz around the equator from 21:42 to 21:48 UT (region 1), waves outside region 1 (region 2).
With L<0.25 (panel f), the polarization of region 1 waves is close to linear, like equatorial noise or EQN (Russell et al., 1970). High values of polarization planarity (F ∼0.7) sug-gests that, for region 1 waves, the magnetic field fluctuates
close to a single plane, with a small fraction of random 3-D fluctuations, also like EQN (Santol´ık et al., 2004). Other panels reinforce the interpretation of region 1 waves as equa-torial noise. Panels (b) and (c) show that region 1 waves bear a relatively large amount of energy compared, for instance, to region 2 waves. This fact is also characteristic of EQN, ac-cording to a systematic analysis of equatorial noise, observed by Cluster below flh(Santol´ık et al., 2004).
rot, 2000; see Hayakawa and Sazhin, 1992 for a review). Let us now come back to the description of the BHE propagation characteristics.
Banded hiss-like emission is a far less visible feature of panels (b) to (g). Indeed, for each of these panels, only the values from 2 to 4 kHz are related to the BHE. This frequency range is located near the upper edge of each record. For this event, BHE is observed on each side of the geomagnetic equator, crossed by C1 around 21:45 UT.
Panel (c) shows that the BHE is an electromagnetic emis-sion from 2 kHz to 4 kHz. The scale on this figure has been chosen so that the dark blue color represents any value below 5.10−9nT2.Hz−1. Due to this scale, only the most intense
magnetic component shows up.
In panel (d), low values of the polarization planarity are found on both sides of the equator, like for plasmaspheric hiss.
Panel (e) displays the parallel component of the Poynt-ing vector, normalized by its standard variation. North of the geomagnetic equator, the value of this component is high (red values), corresponding to the propagation of these waves towards north. South but close to the equator, this quantity is blue, corresponding to a propagation towards south. This propagation behavior is similar to chorus emissions. Further south, this quantity becomes green, meaning propagation in both directions.
Panel (f) shows that on both sides of the geomagnetic equator the ellipticity of the polarization is close to +1, mean-ing that the waves are right-hand elliptically (nearly circu-larly) polarized.
The last panel (g) shows that the angle between the wave normal direction of these waves and the DC magnetic field
is of the order of 30◦. This angle can increase to 60◦when
emissions are observed further away from the equator.
3.3 MLT dependence
The Cluster orbit was chosen with a perigee at 4 RE, an
apogee at 19.6 RE, an inclination of 90◦ and a line of
ap-sides around the ecliptic plane (Escoubet et al., 1997b). The orbital period is 57 h, i.e. ∼2.5 days. In December 2000, four months after launch, the spacefleet was orbiting in the dawn-dusk meridian with perigee in the dawn sector. Then, as the Earth rotates around the Sun, the perigee was around mid-night after 3 months (March 2001), at dusk after 6 months (June 2001), around noon after 9 months (September 2001) and then again in the dawn sector one year later. As a conse-quence, by analyzing a specific phenomenon at perigee over a full year of Cluster data, one is able to study its presence and its geophysical properties at all magnetic local times.
As one can notice in Fig. 6 (left panel), the BHE tend to occur at all MLT sectors: seven cases found in the 21:00–
2 6 10 14 18 22 −60 MLT 4.8 5.4 6.0 6.6 20 24 L+
Fig. 6. Left panel: magnetic latitude ranges vs. MLT; right panel: magnetic latitude upper absolute value vs. L-shell.
03:00 MLT sector, six in the 03–09 sector, seven in the 09–15 sector and seven in the 15–21 sector. The absence of MLT dependence is also a typical feature of mid-latitude hiss (Son-walkar, 1995).
This lack of MLT dependence has some consequences in the bulge region. As a reminder, the plasmasphere encom-passes a bulge region, which extends out to greater distances most of the time in the 19:00–22:00 MLT sector (Higel et Wu, 1984). Meanwhile, the four Cluster spacecraft always have their perigee near L=4. We found six cases in this MLT
sector but always with high Kpvalues during the preceding
24 h (typical values included in the 3+, 6+ range). For such geomagnetic activity, the bulge region of the plasmasphere turns noonward (Carpenter et al., 1993). Therefore, the cases found in this MLT sector could be explained by the fact that the BHE is strongly linked with the plasmapause itself.
3.4 Magnetic latitude dependence
In the vicinity of the plasmapause, the geomagnetic equa-tor is known to be a region of damping and amplification of waves due to the presence of anisotropic distributions of 1– 30 keV electrons. Unfortunately, before January 2003, the Cluster electron instrument PEACE (Johnstone et al., 1997) was always turned off below L=6, in order to avoid any dam-age from the radiation belts. Therefore, for this study, we cannot investigate a possible correlation between the BHE and electron characteristics.
The Solar Magnetic latitude (λ) ranges versus MLT rela-tionship for all BHE events was studied to check whether these waves are only observed near the equator. For each BHE event, the upper and lower λ values have been deduced on each spacecraft, using the start and end time of each BHE. When the waves were observed on more than one space-craft, the minimum and maximum values among the differ-ent spacecraft were chosen to establish the magnetic latitude range of the event.
In more than 75% of all the events, the λ ranges fall into
the [−23◦, 23◦] range (see left panel of Fig. 6). For these
cases, the related maximum L-shell value, L+, was always
equal or below 5.3. For less than 25% of the events, the
magnetic latitude upper value (λ+)of each event ranged from
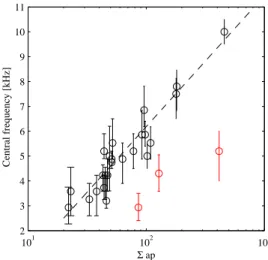
101 102 103 2 3 4 5 6 7 8 9 10 11 Σ ap Central frequency [kHz]
Fig. 7. Central frequency and spectral width of the BHE vs. the preceding 24 h sum of Apindices.
The λ+values are plotted against their corresponding L+
values in the right panel of Fig. 6. Clearly, for increasing L+,
λ+ increases. This result is not surprising considering the
strong dependence of the plasmapause position with regards
to the geomagnetic activity, using Kp as an indicator
(Car-penter and Anderson, 1992). Indeed, all these events
corre-spond to periods of quiet geomagnetic activity (Kpgoes from
2◦to O◦as λ+goes from 25◦to 36◦), for hours before each
Cluster plasmaspheric crossing. During such periods, the plasmasphere expands and is filled with ionospheric plasma, but at the same time the Cluster spacefleet still crosses the
geomagnetic equator around 4 RE. These higher λ+values
might be just the consequence of both the plasmasphere ex-pansion and the Cluster orbit.
The orbit of the spacefleet seems to indeed play a crucial role in the way we are observing the BHE on Cluster.
The [−23◦, 23◦] apparent confinement of the BHE seems
rather due to the Cluster orbit, reminding us that their mode of propagation should allow these waves to propagate along the field lines and not being confined.
Other satellites like DE-1 or Polar did not observe the BHE also because of their orbit, as none of these satellites were
crossing the geomagnetic equator around 4 RE and
skim-ming the plasmapause for about one hour.
3.5 Geomagnetic activity dependence
The central frequency and the spectral width values of all the BHE have been gathered and compared to the geomag-netic activity. The proxy chosen for the geomaggeomag-netic activity
is the sum of Kp values (turned to Ap) over the preceding
24 h. Figure 7 displays, for each event, the central frequency (circles) and the spectral width (error bar) with respect to
the sum of Ap over the preceding 24 h. It has to be
men-tioned that in the case of periods centered at 09:00, 12:00, and 15:00 MLT, respectively, the values for one, two or three immediately preceding 3-h periods were ignored to account for observed delays in the response of the dayside radius to
enhanced convection activity (Lemaire and Gringauz, 1998, and references therein). As one can see, the frequency band of most of the events lies in the 3 kHz–6 kHz for range mod-erate geomagnetic activity. Nevertheless, it seems that the higher the geomagnetic activity, the higher the central fre-quency of the BHE. A best fit has been derived from these events relating the central frequency value to the
geomag-netic activity: Fo [kHz]=2.3*ln(6Ap) −4.4. Note that the
values of three events measured around 21:00 MLT have not been taken into account in this calculation.
There are two possible explanations for the linear relation-ship in Fig. 7. The first one is to assume that these waves are generated in the vicinity of the plasmapause, near the
ge-omagnetic equator, in a given f/fce frequency bandwidth.
Now let us remember that the equatorial fce value near the
plasmapause is 1/L3dependent. When the geomagnetic
ac-tivity is high, the plasmapause will be compressed and its location will be closer to the Earth, hence its L-shell position
will decrease. In this case fce will increase, and hence the
central frequency of the BHE will increase too, with respect to our assumption.
Another possible explanation is to assume the presence of a moving source located within the plasmapause, whose cen-tral frequency seems to be around 4 to 5 kHz. The cencen-tral frequency drift would then be explained by a Doppler shift.
4 Discussion
Our study shows that, in the immediate vicinity of the plasmapause, the four Cluster spacecraft regularly observe a VLF emission with the following characteristics:
– between 2 kHz and 10 kHz, always below the electron gyrofrequency and the plasma frequency but above the lower hybrid resonance,
– 1–2 kHz wide, – banded in frequency, – electromagnetic,
– right-hand elliptically polarized, – escaping from the equator, – structure less,
– rising tones sometimes embedded within, – no MLT dependence found,
– lasting from a few minutes to an hour, always corre-sponding to invariant latitude from 50◦to 67◦.
According to this list of properties, the BHE has similar-ities with a narrow-band plasmapause hiss observed by the ISIS 1 and ISIS 2 satellites (Ondoh et al., 1980, 1981; On-doh, 1993). However, the central frequency of this banded hiss was so close to 5 kHz that it was first called narrow-band
narrow-band hiss remains around 5 kHz over the 56 –65 in-variant latitude range, corresponding to the plasmapause lo-cation. The hiss was therefore renamed narrow-band plasma-pause hiss.
On page 641 of (Ondoh, 1993), it is written: “All f-t spec-tra of narrow band hiss observed around 5 kHz by the ISIS satellites show no lower frequency cutoff”. This feature is a clear difference between this emission and the BHE, as il-lustrated in Fig. 2. Another difference is the maximum oc-currence of the narrow-band plasmapause hiss in the late evening sector (quiet and moderate conditions) and in the midnight sector (disturbed). As presented in our study, no MLT dependence is found, even though our study is based on 27 cases only.
In Hayakawa and Sazhin (1992), no difference is made between narrow-band 5-kHz hiss and mid-latitude hiss. The latter may be indeed considered as a more general denomi-nation. In other words, narrow-band plasmapause hiss might be seen as a subset of a more general VLF hiss emission: mid-latitude hiss.
As reviewed in Sonwalkar (1995), at ground stations,
mid-latitude hiss is observed at invariant mid-latitudes of about 20◦
to 70◦and peaks near latitudes 55◦to 65◦(Helliwell, 1965;
Hayakawa and Sazhin, 1992). Like on 5 June 2001 (Fig. 5), it usually appears as a band limited white noise in a 3 to 8 kHz band, lasting for an hour or so, with a relatively smooth rise and fall. Simultaneously, whistlers are rather frequently observed in the same frequency band. This could explain the presence of rising tones, possibly whistlers, in Fig. 2. Among the 27 cases selected, their presence is also rather frequent.
The possible interaction between the observed rising tones and the BHE requires further investigation. Dowden (1971) suggested that whistlers could play a role in the generation of mid-latitude hiss. Another type of interaction is the effect of noise suppression by whistlers, frequently observed near
L=4 (Gail and Carpenter, 1984). The propagation of noise
bands is also observed just outside the plasmapause near L=4 to a ground station, in the early stages of a weak magnetic storm (Carpenter, 1978). A future survey is foreseen on the interaction between whistlers and the BHE observed on Clus-ter, with a more focused High-resolution WBD data set.
The hiss-type ELF emission, described in Sect. 3.2 as re-gion 2 waves, is another issue for future investigation. This hiss-type ELF emission, most likely plasmaspheric hiss, is reviewed in Hayakawa and Sazhin (1992). The main energy of these emissions is observed between 100 Hz and 1 kHz but can extend to a few kHz. As mentioned in Hayakawa and Sazhin (1992 and references therein), it seems possible that the high frequency part of the plasmaspheric hiss may some-times result from the influence of mid-latitude hiss. Further investigation based on a large dataset of Cluster data might help providing some answers about this possible influence.
at about 7 kHz and 2 kHz wide. However, he calls this emis-sion banded hiss.
Based on all these previous observations and the present study, it seems most likely that banded hiss-like emission is in fact mid-latitude hiss.
5 Conclusion
In Moullard et al. (2002), a case study reported an uniden-tified 3–6 kHz whistler mode emission, observed by Cluster near the plasmapause.
Our study presents observational evidence that this VLF emission is most likely mid-latitude hiss (MLH). Our sur-vey indeed presents several geophysical properties in com-mon with MLH: location (plasmapause vicinity, no MLT dependence), frequency range (2–10 kHz), frequency width (1–2 kHz), spectral appearance (structure less; banded in frequency; rising tones, possibly whistlers, sometimes
em-bedded). For each case where its frequency range was
below 4 kHz, this VLF emission was found propagating with a right-hand elliptical polarization, mostly escaping the geomagnetic equator. This survey is based on twenty-seven cases found over 14 months of Cluster data (wave instru-ments: WHISPER, STAFF and WBD).
To the best of our knowledge, our survey shows, for the first time, that the central frequency value of the MLH is influenced by the geomagnetic activity: the higher the geomagnetic activity, the higher the central frequency of the MLH. Two possible explanations have been suggested. The first one assumes that the waves are generated within a given
f/fcerange, near the geomagnetic equator, in the vicinity of
the plasmapause. Keeping in mind the 1/L3dependence of
fce, the central frequency of the MLH would
geomagneti-cally drift as observed. Another possible explanation would be to consider a moving source located within the plasma-pause; the frequency drift would then be explained by a Doppler shift between the moving source and the satellite.
Further studies are foreseen on these mid-latitude hiss emissions, using multi-point and multi-missions measure-ments. Conjunctions with the IMAGE satellite and its EUV imagers are expected to reveal further insight about their source location. A dedicated study is also foreseen on the possible interaction between whistlers and hiss-like noise bands in the plasmapause region, such as MLH. Finally, an-other study is also foreseen on a possible interaction between MLH and ELF hiss.
Appendix WBD STAFF 23 February 2001 C3 28 March 2001 Off 07 April 2001 Off X 12 April 2001 C3 24 April 2001 C3 08 May 2001 C1, C3 15 May 2001 Off X 05 June 2001 C3 X 20 June 2001 C1 X 24 June 2001 Off 11 July 2001 Off 02 August 2001 C1, C3, C4 13 August 2001 Off 30 August 2001 Off 18 September 2001 Off 07 October 2001 C1, C4 10 October 2001 Off 17 October 2001 Off X 26 October 2001 C3 31 October 2001 Off 10 November 2001 Off X 12 November 2001 Off X 10 December 2001 Off 06 January 2002 Off X 15 January 2002 C1, C4 08 February 2002 C1, C2, C3, C4 11 March 2002 C1, C2, C3, C4
Acknowledgements. A. Masson deeply thanks K. P. Wenzel, C. P. Escoubet, H. Laakso, R. Grard, J. P. Lebreton, and F. Moser for their support and interest in this work.
Topical Editor T. Pulkkinen thanks two referees for their help in evaluating this paper.
References
Burgess, W. C. and Inan, U. S.: The role of ducted whistlers in the precipitation loss and equilibrium flux of radiation belt electrons, J. Geophys. Res., 98, 15 643–15 665, 1993.
Carpenter, D. L.: Whistler Evidence of a ‘knee’ in the magneto-spheric ionization density profile, J. Geophys. Res., 68, 1675, 1963.
Carpenter, D. L.: Whistlers and VLF noises propagating just outside the plasmapause, J. Geophys. Res., 83, 45–57, 1978.
Carpenter, D. L. and Anderson, R. R.: An ISEE/Whistler model of equatorial electron density in the magnetosphere, J. Geophys. Res., 97, 1097–1108, 1992.
Carpenter, D. L., Giles, B. L., Chappell, C. R., D´ecr´eau, P. M. E., Anderson, R. R., Persoon, A. M., Smith, A. J., Corcuff, Y., and Canu, P.: Plasmasphere dynamics in the duskside bulge region: a new look at an old topic, J. Geophys. Res., 98, 19 243–19 271, 1993.
Cornilleau-Wehrlin, N., Chauveau, P., Louis, S. et al.: The Cluster Spatio-Temporal Analysis of Field Fluctuations (STAFF) exper-iment, Space Sci. Rev., 79, 107–136, 1997.
D´ecr´eau, P. M. E., Fergeau, D, Krasnosels’kikh, V., et al.: A res-onance sounder and wave analyser: performances and perspec-tives for the Cluster mission, Space Sci. Rev., 79, 157–193, 1997. Dowden, R. L.: Distinction between mid-latitude VLF hiss and
dis-crete emissions, Planet. Space Sci., 19, 374–376, 1971. Escoubet, C. P., Russell, C. T., and Schmidt, R.: The Cluster and
Phoenix missions, Dordrecht, Kluwer, 1997a.
Escoubet, C. P., Schmidt, R., and Goldstein, M. L.: Cluster – sci-ence and mission overview, Space Sci. Rev., 79, 11–32, 1997b. Gail, W. B. and Carpenter, D. L.: Whistler induced suppression of
VLF noise, J. Geophys. Res., 89, 1015–1022, 1984.
Gurnett, D. A., Huff, R. L., and Kirchner, D. L.: The wide-band plasma wave investigation, Space Sci. Rev., 79, 195–208, 1997. Hayakawa, M. and Sazhin, S. S.: Mid-latitude and plasmaspheric
hiss: a review, Planet. Space Sci., 40, 10, 1325–1338, 1992. Helliwell, R. A.: Whistlers and related ionospheric phenomena,
Stanford University Press, Stanford, Calif., 349, 1965.
Helliwell, R. A.: VLF wave stimulation experiments in the mag-netosphere from Siple Station, Antarctica, Rev. Geophys., 26, 551–578, 1988.
Helliwell, R. A. and Mende, S. B.: Correlations between λ4278 optical emissions and VLF wave events observed at L ∼4 in the Antarctic, J. Geophys. Res., 85, 3376–3386, 1980.
Helliwell, R. A., Katsufrakis, J. P., and Trimpi, M.: Whistler-induced amplitude perturbation in VLF propagation, J. Geophys. Res., 78, 4679–4688, 1973.
Higel, B. and Wu, L.: Electron density and plasmapause charac-teristics at 6.6 RE: a statistical study of the GEOS-2 relaxation sounder data, J. Geophys. Res., 89, 1583–1601, 1984.
Johnstone, A. D., Alsop, C., Burge, S., et al.: Peace: A plasma electron and current experiment, Space Sci. Rev., 79, 351–398, 1997.
Lemaire, J. F. and Gringauz, K. I.: The Earth’s plasmasphere, Cam-bridge University Press, CamCam-bridge UK, New York, 1998. Morgan, M. G.: Equatorial hiss in the topside ionosphere, J.
Geo-phys. Res., 84, 7279–7287, 1979.
Moullard, O., Masson, A., Laakso, H., Parrot, M., D´ecr´eau, P., Santol´ık, O., and Andr´e, M.: Density modulated whistler mode emissions observed near the plasmapause, Geophys. Res. Lett., 29(20), 1975, doi:10.1029/2002GL015101, 2002.
Ondoh, T.: Narrow-band plasmapause hiss observed by ISIS satel-lites, Radio Sci., 28, 629–642, 1993.
Ondoh, T., Nakamura, Y., Watanabe, S., and Murakami, T.: Narrow-band VLF hiss observed in the vicinity of the plasma-pause, J. Radio Res. Labs, 27, 131, 1980.
Ondoh, T., Nakamura, Y., Watanabe, S., and Murakami, T.: Narrow-band 5 kHz hiss observed in the vicinity of the plasma-pause, Planet. Space Sci., 29, 65, 1981.
Paschmann, G., Haaland, S., and Treumann, R.: Auroral plasma physics, Space Sciences Series of ISSI, Dordrecht, Kluwer, 2003. Rosenberg, T. J., Helliwell, R. A., and Katsufrakis, J. P.: Electron precipitation associated with discrete very-low frequency emis-sions, J. Geophys. Res., 76, 8445–8452, 1971.
Russell, C. T., Holzer, R. E., and Smith, E. J.: OGO 3 observations of ELF noise in the magnetosphere, The nature of the equatorial noise, J. Geophys. Res., 73, 755–768, 1970.
Santol´ık, O. and Parrot, M.: Application of wave distribution func-tion methods to an ELF hiss event at high latitudes, J. Geophys. Res., 105, 18 885–18 894, 2000.
Santol´ık, O., Lefeuvre, F., Parrot, M., and Rauch, J. L.: Complete wave-vector directions of electromagnetic emissions: Applica-tion to INTERBALL-2 measurements in the nightside auroral
noise below the lower hybrid frequency, Ann. Geophys., 22, 7, 2587–2595, 2004.


![Fig. 5. WHISPER and STAFF data measured by C1 on 5 June 2001 from 21:00 to 23:00 UT. From top to bottom: electric field spectrogram in linear scale [2 kHz, 80 kHz], electric field spectrogram [60 Hz, 4 kHz] in logarithmic scale, magnetic field spectrogram](https://thumb-eu.123doks.com/thumbv2/123doknet/14795964.603770/7.892.80.812.93.857/whisper-measured-electric-spectrogram-electric-spectrogram-logarithmic-spectrogram.webp)