HAL Id: hal-00304877
https://hal.archives-ouvertes.fr/hal-00304877
Submitted on 31 Dec 2005HAL is a multi-disciplinary open access archive for the deposit and dissemination of sci-entific research documents, whether they are pub-lished or not. The documents may come from teaching and research institutions in France or abroad, or from public or private research centers.
L’archive ouverte pluridisciplinaire HAL, est destinée au dépôt et à la diffusion de documents scientifiques de niveau recherche, publiés ou non, émanant des établissements d’enseignement et de recherche français ou étrangers, des laboratoires publics ou privés.
waters in an upland acidic and acid sensitive
environment, mid-Wales
C. Nea
To cite this version:
C. Nea. Lanthanum, cerium, praseodymium and yttrium in waters in an upland acidic and acid sensitive environment, mid-Wales. Hydrology and Earth System Sciences Discussions, European Geo-sciences Union, 2005, 9 (6), pp.645-656. �hal-00304877�
Lanthanum, cerium, praseodymium and yttrium in waters in an
upland acidic and acid sensitive environment, mid-Wales
Colin Neal
Centre for Ecology and Hydrology, Crowmarsh Gifford, Wallingford, OXON, UK Email address [email protected]
Abstract
The less than 0.45mm filterable lanthanum (La), cerium (Ce), praseodymium (Pr) and yttrium (Y) concentrations in rainfall, cloud water, stream and groundwater in the upper River Severn catchments of mid-Wales are presented, based on up to ten years of weekly data. Results show that for rainfall, there is enrichment in the rare earth (RE) elements, especially under conditions of small volume of catch. However, within the correlations, there is a forked relationship, with one line of high La, Ce and Pr with low Y, corresponding to clear pollutant events and the other with relatively low La, Ce and Pr and higher Y to background conditions. Cloud water and stream waters show a simpler relationship indicating two types of source. Cloud, stream and ground water show no split in pattern, with singular linear relationships between the rare La, Ce, Pr and Y. However, in many cases the monitoring of the streams and groundwaters post-dates the rainfall period with high pollutant Ce inputs. RE element concentrations vary systematically, in general decreasing with increasing volume of catch for cloud-water. For the streams, occasionally, there are relatively high Ce and La concentrations (up to about a tenth the maximum in rainfall), which occur in the same year as the corresponding high values in rainfall. Apart from these anomalous periods, RE element concentrations increase with decreasing pH and increasing aluminium concentrations; RE elements are mobilised under acidic conditions. The river waters are particularly enriched in Y relative to La, Ce and Pr, both in terms of average concentrations and values normalised to standard continental shales. The RE element level in the streams is variable and seems to be linked to the main soil types within the catchment; gleys in particular show higher concentrations than their peat and podzolic counterparts. On average, groundwaters are enriched in the RE elements relative to the stream but the link with pH and aluminium observed in the stream is much weaker.
Keywords: lanthanide, rare earth elements, lanthanum, cerium, praseodymium, yttrium, Plynlimon, rainfall, mist, river, groundwater, Hafren, Hore, Tanllwyth, forest, moorland, acidification
Introduction
Studies of rare earth (RE) elements in natural waters provide important clues to the nature of weathering reactions in surface water environments; they link to issues of crustal erosion and mineral breakdown as well as to chemical fluxes to the oceans (Elderfield et al., 1990; Johannesson and Zhou, 1999). There are also issues with regard to anthropogenic inputs of RE elements to catchments and surface waters (Wilkinson et al., 1997; Nozaka et al., 2000; Weltje et al., 2002).
Under acidic conditions, the RE elements become mobilised (Brookins, 1989; McLennan, 1989; Michard, 1989). The extent of their mobilisation and subsequent fate depends upon a number of factors. These factors include the kinetics of mineral dissolution, surface sorption
desorption mechanisms (e.g. onto iron oxide/hydroxide minerals), ion complexation (e.g. with organic matter) and the degree of acidification and colloidal transport (Bookings et al., 1989; Elderfield et al., 1990; Johannesson and Zhou, 1999).
Over the past 20 years, a long-term study of an acidic and acid sensitive system in Plynlimon, mid-Wales, had a remit to examine the hydrogeochemical functioning in relation to environmental management issues of acid deposition, climate change/instability and plantation forestry (Neal et al., 1997). This work involved the measurement of a wide variety of major, minor and trace elements in rainfall, within mist (here termed cloud water), in the streams and in groundwater to fingerprint water transport within an endmember modelling context (Christophersen et al., 1990;
Neal et al., 1990). It also sought to determine the impacts of changes in land use and in climate. Within the work, there have been measurements of four RE elements (La, Ce, Pr and Y).
The findings from this RE element study at Plynlimon are presented here. Sadly, the full range of RE elements is not available and the analysis is less rigorous than more precise RE element studies in which extremely low RE element concentrations can be measured accurately. Nonetheless, important hydrogeochemical observations have been made for what is a key acidic and acid-sensitive system, and further research in this area must be encouraged. The study brings together data from previous studies by Neal et al. (1997) and Wilkinson et al. (1997) and associated key findings not available within these earlier presentations.
Study area
The study relates to the two main tributaries of the upper River Severn in mid-Wales, the Afon Hafren and the Afon Hore and their catchments. It also relates to a smaller tributary, the Nant Tanllwyth, which enters the Afon Hafren near its junction with the Afon Hore. The areas of the lower Hafren, lower Hore and Tanllwyth are 3.58, 3.17 and 0.916 km2 respectively. The Hafren and the Hore catchments have
two distinct parts:
(1) An upper half comprising a hill top plateau above the tree line and acidic moorland of blanket peat up to 2 m thick and acidic gley soils in the valley bottoms and (2) A lower half planted to rotation forestry comprising Sitka
spruce (with some Norway spruce, lodgepole pine and larch) on thin acidic and mainly podzolic soils. The Nant Tanllwyth catchment, on the lower slopes of the upper Severn catchment, comprises conifer rotation plantation with highly acidic gley soils. The underlying bedrock across the catchments is hard-rock Ordovician to Silurian age mudstones, grits and shales. The lower Hore was clearfelled during 198589 as was a small tributary of the Hore, south2Hore, which was also monitored. Over the last 20 or more years, the Hafren underwent phased felling, according to the standard Forestry Commission practice: over two-thirds of the forest has now been felled and any effect of felling will be less pronounced due to diluting out of any response. To determine the maximum effect of total forest clearance on water quality, the southern half of the Tanllwyth and the lower Hore were clear felled in 1996 as an experimental fell in joint research with the Forestry Commission and Forest Enterprise.
Weekly monitoring of rainfall and stream water quality for a wide range of chemical constituents began in May 1983. However, as the research progressed, the monitoring was extended to include stemflow and throughfall, to characterise the cycling of chemicals through the vegetation. Drainage from a small stream (south2Hore) was monitored pre-, during and post- felling from 1988 to provide information on runoff changes for forest and harvested forest within a small catchment dominated by near surface inputs. Cloud water was collected from 1990 when it became apparent that occult and dry deposition could provide important input fluxes for several major and trace elements. The upper Hafren was monitored separately for information on the chemistry of runoff from the moorland area. Small (less than 5 ha area) control and fell response sites were established for podzolic (at a site known as south east (SE)) and for gley soils (in the Tanllwyth catchment (Tan)) to examine the impacts of felling on water quality. At each of these sites, control and fell response monitoring sites, (referred to in the text with the suffix c and f respectively) were established. Groundwater samples were collected across a network of sites after the stream water quality data indicated that, under baseflow conditions, water seemed to come from shallow groundwater areas which the borehole network confirmed. At the SE and Tan sites, both control and fell response boreholes were installed to monitor variations in groundwater quality.
The time frames of monitoring across the sites have been variable, according to whether it was considered that the information being collected was of diminishing importance, or when financial rather than scientific concerns predominated. Yet, rainfall, cloud water and stream water in the upper and lower Hafren, Hore and Tanllwyth are still monitored (25 years of data), although monitoring of the other sites was stopped (1 to 10 years of data). The outcome and details of the monitoring programme and of the wide-ranging findings are presented in a Special Issue of Hydrology and Earth System Sciences, Sustainability of UK upland forestry: contemporary issues for the protection of freshwaters (Neal et al., 2004a) incorporating assessments by Neal (2004) and Neal et al. (2004b,c,d). Further details of experimental sites, felling programmes, catchment areas, etc. are in Neal and Kirchner (2000).
MONITORING AND ANALYTICAL CHEMISTRY
Samples for chemical analysis were collected weekly to fortnightly in the field. In the case of rainfall and cloud water, the samples were weekly-integrated volumes of catch and they were filtered on return to the laboratory within two hours of sampling. Instantaneous grabs were taken for the
stream and groundwater samples which were filtered immediatelty.
All samples were collected in acid washed bottles and filtration was with 0.45 mm filter circles; to minimise contamination, the filter circles and sample bottles used for storage were well washed with several aliquots of the water being sampled before the samples were collected for analysis for a wide range of chemical determinands, by methods presented in Neal et al. (1997). For the RE element determinations, the samples were acidified with concentrated high purity nitric acid (1% v/v acid) to avoid sample deterioration after storage. For the first half of the record (1988 to 1992 inclusive), the waters sampled were subjected to 20-fold pre-concentration by evaporation and all the
samples/preconcentrates were analysed by inductively coupled mass spectrometry (ICPMS) at the Wallingford laboratories, using a mixed RE element calibration with an indium internal standard. Data from the ICPMS are available only for the period 1988 to 1998 when the ICPMS was in use. The analytical protocols gave a 3 sigma value for the RE elements of 50 ng l1 without pre-concentration. For the
calculations and the plots, the raw data were used to avoid rounding errors. In a few cases, the use of the indium internal standard produced negative concentrations for the RE elements at very small concentrations, and these values were taken as zero. Figure 1 shows time series for RE element concentrations in rainfall and the lower Hore stream. Anomalously high values for the RE elements (excluding Y) show a consistency in pattern between La, Ce and Pr in the rainfall samples, while the lower Hore stream time series shows a consistent pattern with and without pre-concentration of samples prior to analysis. Apart from the notable similarities, two analytical errors must be noted. (1) in 1993, the number of significant figures was rounded down in the laboratories and, subsequently, the raw data could not be retrieved to increase the number of significant figures, and (2) in 1995, for Pr in particular, concentrations were particularly low and it was at this time that the indium internal standard probably overcompensated for drift leading to negative values.
Filtration to 0.45 mm includes not just dissolved but also micro-particulate/colloidal fractions and these can be an extremely important component of the total 0.45 mm filterable fraction (Lyvén et al., 2003). Although, to simplify the reading of this text, the word dissolved is used to describe the total 0.45 mm filtered fraction, clearly there are important issues over the particulate/colloidal material within this fraction for the RE elements (Elderfield et al., 1990).
Results
Statistical summaries of the average and maximum concentration of the RE elements for rainfall, cloud water and river water are given in Table 1; the corresponding information for groundwater is in Table 2. Figure 1 shows a time series for the RE elements in rainfall and in the lower Hore stream water to illustrate the main temporal features. The relationships between La, Ce, Pr and Y are shown in Fig. 2 for rainfall, cloud water and river water in the lower Hafren.
At several of the study sites, felling activity might well have affected the stream water signal. However, a visual examination of the time series data for the RE elements revealed no clear difference and so this aspect was not considered further in this paper.
Fig.1. Time series for Y, La and Ce concentrations for rainfall (top)
and stream water (below) in the lower Hore. Felling occurred between 1985 and 1989.
Table 1. Summary statistics for yttrium, lanthanum, cerium and praseodymium in Plynlimon rainfall, cloud water and stream water. For rainfall, the data are split into two to show the average values (1) without the anomalously high Ce concentrations and (2) for the times when Ce is anomalously high. For the flow weighted averages for rainfall, the bracketed value corresponds to the averages without the Ce pollution events and therefore to the years when the Ce anomalies were absent. The averages for the two situations are given before and after the dash, respectively. For the cloud water, two samples with anomalously high RE concentrations have been excluded from the statistical analysis. Within the table, the highest value for the anomalous points is given in brackets.
Y La Ce Pr Y La Ce Pr ng l-1 ng l-1 ng l-1 ng l-1 ng l-1 ng l-1 ng l-1 ng l-1 RAINFALL TANLLWYTH Average 14 36 516 6 432 45 131 19 1415 15381 467722 358 Fw average 7 (16) 32 (17) 583 (58) 6 (3) 508 59 169 24 Median 7 7 13 1 454 43 135 20 Minimum 0 0 0 0 79 0 28 0 Maximum 350 562 11695 100 1129 169 413 113
CLOUDWATER SOUTH2HORE
Average 113 120 186 30 76 25 85 9 Fw average 52 50 78 12 84 32 141 9 Median 42 41 64 10 71 19 45 6 Minimum 0 0 0 0 11 0 9 0 Maximum 1785 2771 4246 958 1035 1045 4890 1086 (19263) (60813) (60107) (12049)
UPPER HAFREN SOUTH EAST 1 C
Average 291 15 46 6 56 16 20 4
Fw average 358 21 63 8 66 20 25 5
Median 284 12 31 5 50 14 18 3
Minimum 47 0 0 0 20 0 0 0
Maximum 817 98 1656 27 147 66 78 18
UPPER HORE SOUTH EAST 3 F
Average 236 17 69 7 165 31 27 9
Fw average 320 27 156 11 269 49 49 18
Median 226 13 46 7 126 22 18 7
Minimum 74 0 0 0 60 8 0 0
Maximum 579 175 3434 43 676 116 140 57
LOWER HAFREN TAN NORTHC
Average 272 28 91 10 219 70 142 19
Fw average 361 52 130 15 172 58 114 15
Median 263 20 60 9 219 65 140 19
Minimum 0 0 0 0 61 7 54 0
Maximum 735 878 2500 38 446 328 277 53
LOWER HORE TAN SOUTHF
Average 224 28 108 10 223 66 134 19
Fw average 319 44 163 16 191 61 122 16
Median 218 23 63 10 207 62 132 19
Minimum 11 0 0 0 68 0 17 0
Table 2. Summary statistics for yttrium, lanthanum, cerium and praseodymium in Plynlimon groundwater.
Y La Ce Pr Y La Ce Pr
ng l-1 ng l-1 ng l-1 ng l-1 Ng l-1 ng l-1 ng l-1 ng l-1
QUARRYBOREHOLE HA 4 BOREHOLE
Average 51 11 10 2 471 108 220 34
Median 50 7 9 1 400 94 201 31
Minimum 9 0 0 0 67 17 28 0
Maximum 258 128 56 27 2171 480 889 165
SOUTH EAST 1 CBOREHOLE TAN 2 CBOREHOLE
Average 413 70 160 26 658 74 220 27
Median 209 33 73 14 642 67 199 25
Minimum 65 11 20 0 117 23 21 0
Maximum 2550 519 1205 191 1688 224 736 98
SOUTH EAST 3 FBOREHOLE TAN 1 FBOREHOLE
Average 1164 222 250 76 341 38 97 17
Median 1243 223 239 77 242 33 70 13
Minimum 132 24 7 0 32 0 0 0
Maximum 3248 658 813 224 1411 171 440 80
Fig. 2. The relationships between La, Ce, Pr and Y in rainfall (left), cloud water (centre) and stream water (right) in the lower Afon Hafren.
ATMOSPHERIC INPUTS
Rainfall
The concentration of the RE elements in rainfall is variable: Y averages 14 ng l1 (range of 0 to 350 ng l1); La averages
36 ng l1 (range of 0 to 562 ng l1); Ce averages 516 ng l1
(range of 0 to 11 695 ng l1); Pr averages 6 ng l1 (range of 0
to 100 ng l-1). Clearly, the highest RE element concentrations
are for Ce. There is a remarkably consistent pattern between La, Ce and Pr (but not Y) when their concentrations are high (Fig. 1). The relationship between the RE elements splits into two groups, one with relatively low and the other with very high Ce concentrations (cut off at Ce >2000 ng l1
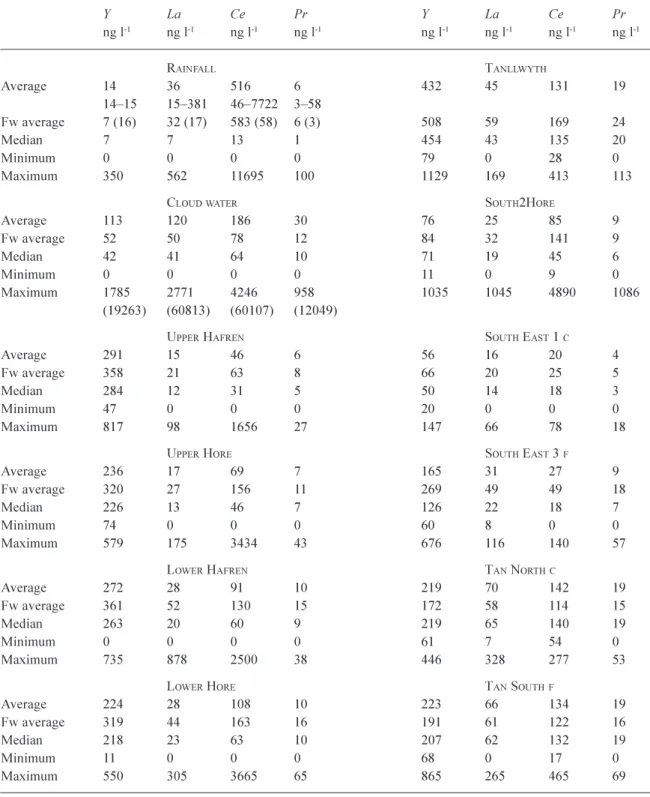
(Fig. 2). For the first group, which will be called the background pattern, the RE element concentrations decreased with increasing volume of catch (Fig. 3). This is characteristic of a washout of dust and fine particles from the atmosphere during rainfall events. The rare earths occur as cations with a high charge (mainly 3+: Ce can be 3+ and 4+). These highly charged ions would be expected to be linked to Al and Fe phases in the dust (Al and Fe oxides, hydroxides and silicates); these will increase under the more acidic conditions associated with low volumes of catch, and Y, La, Ce and Pr are linearly and positively correlated (Fig. 2). For the second group, which will be called the pollution event pattern, there are periods when rainfall has much higher La, Ce and Pr concentrations but low Y concentrations (Fig. 2). These pollution events occur more often in winter (October through to the following April) and they are sporadic, being intermixed with waters of much lower concentrations corresponding to the background pattern. The main pollution events were in 1988, 1989, 1990 and 1991 (13, 1, 5 and 6 events per year, respectively).
For the background and pollution event situations, a comparison of average concentrations reveals differences of 15 versus 381 ng l1 for La, 46 versus 7722 ng l1 for Ce
and 3 versus 58 ng l1 for Pr. Thus, between the background
and pollution event groups, enrichment of La, Ce and Pr was 25-, 168- and 19-fold, respectively. There is no significant corresponding difference for Y (14 versus 15 ng l1). The pollutant events are much less frequent than
the background events, but they have a significant affect on the straight and flow weighted average. However, if the median rather than the average value is adopted, then all the RE element concentrations are lower than the average (a factor of 30 times lower in the case of Ce) and the pollution events are filtered out.
For the background case, with dust a potential major source of RE elements, they should not only be correlated with each other but the ratios between them should reflect, approximately, the ratio for crustal sediments. Here, an enrichment/depletion factor has been determined by dividing the ratios to La for the RE elements in rainfall with those from standard continental shales in which Ce:La, Pr:La and Y:La ratios are 2.08, 0.23 and 0.71, respectively (Taylor and McLennan, 1985). The ratios for background rainfall are similar to those for standard continental shales. However, there are some differences: the ratios Ce/La, Pr/La and Y/ La in background rainfall are 3.23, 0.19 and 0.93. Thus, relative to standard continental shale, the ratios are 55% higher for Ce/La, 17% lower for Pr/La and 31% higher for Y/La and the ratios suggest a modest enrichment for Ce and perhaps Y (relative to La). In respect of the lithogenic source for the RE elements, analysis of a sample of roadside dust for La and Ce content gave a Ce/La ratio of 2.99, which
is only 8% different from that for rainfall. This adds weight to the recognition of the importance of lithogenic sources for RE elements in rainfall.
For the pollutant events, the Ce/La, Pr/La and Y/La ratios are 20.3, 0.15 and 0.04, respectively; clearly there is strong enrichment in Ce relative to La and in La relative to Y of an order of magnitude, and much smaller change for La relative to Pr.
Cloud water
Inclusion of two samples with extremely high RE element concentrations distorts the average values and ratio of values to a large degree (about a factor of two in the average concentration), but hardly any difference in the flow weighted average. The average RE element concentrations for the samples excluding the two anomalous data points are 113 for Y, 120 for La, 186 for Ce and 30 for Pr. The corresponding values for the two anomalous values are 19 263 and 4872 for Y, 60 813 and 13 551 for La, 60 107 and 11 273 for Ce and 12 049 and 2770 for Pr. The two anomalous data points were, therefore, excluded from the initial analysis.
For cloud water, as with rainfall, the RE element concentration increased with decreasing volume of catch (Fig. 3). In addition, the cloud waters were enriched in RE elements relative to the background average for rainfall. The RE elements exhibit strong linear relationships between each other (p<0.001) with intercepts statistically insignificantly different from zero. There is no equivalent split into two groups as was observed for rainfall (Fig. 2). However, the cloud water monitoring programme started later than that for rainfall and missed the main phase of Ce enrichment in 1988.
The Ce/La, Pr/La and Y/La ratios in cloud water (without the two anomalous data points) are 1.55, 0.25 and 0.95, respectively 25% lower, 9% higher and 34% higher than average values for continental shale. These values differ markedly from the rainfall values both in terms of background and polluted events. The values for the two anomalous data points are very similar to each other; Ce/ La, Pr/La and Y/La were 0.99 and 0.83, 0.20 and 0.20, and 0.32 and 0.36, respectively. These ratios are about half of those for standard continental shale in the case of Y/La and Ce/La, but only about 13% lower for Pr/La. As noted by Wilkinson et al. (1997), the Ce/La ratio for these samples is close to those for fluidised catalytic crackers.
RIVER WATER AND GROUNDWATER
River water
For the main streams that were monitored from 1988 to 1998,
there was little variation in concentration except for strong spikes in Ce especially around the time of high Ce in rainfall in 1988. For those streams monitored only later in the programme (mainly after 1990) there are considerably fewer spikes. Thus, while some of the pollutant Ce in rainfall input passed through the catchment to the stream, the concentration increases were, typically, an order of magnitude lower in the stream than in the rainfall. The frequency of the high Ce events was less than half that for rainfall and, since the enrichment was much lower than that for rainfall, it had a much smaller influence on the average concentrations relative to rainfall. There were some spikes for La as well as for Ce but the two sets of high values were poorly correlated. The salient features are as follows.
Yttrium. Average Y concentrations varied by a factor of
six across the sites; the lowest average was for the south2Hore stream (76 ng l1) and the highest for the
Tanllwyth (432 ng l1). For the upper and lower Hafren and
Hore, the concentrations are about the same upstream and downstream but the concentrations on the Hafren are moderately higher (291 and 272 ng l1 upstream, downstream
respectively) than the corresponding values for the Hore (236 and 224 ng l1). There is a marked contrast, however,
between the gley and the podzol dominated catchments. Thus, the main stem of the Tanllwyth averages (432 ng l1),
about twice the Y concentration of the main stem of the Hafren and the Hore and over five times that for the south2Hore. This difference is also observed in the data from the control and fell sites, with gley drainage (219-223 ng l1)
having around twice the concentration of the podzolic drainage (56-165 ng l1). However, there are clearly
site-to-site differences in average Y concentration (e.g. a factor of three different for SE1 and SE3).
Lanthanum. The average La concentration varies between
15 and 66 ng l1 across the sites. For the main stem of the
Hafren and the Hore, average La concentrations are the lowest for the area and they show similar patterns of increasing concentrations downstream (15 to 28 ng l1 for
the Hafren and 17 to 28 ng l1 for the Hore). The drainage
from the podzolic areas has intermediate concentrations for both south2Hore (25 ng l1) and the small drainage areas
(16 to 31 ng l1), while the drainage from the gleys shows
the highest La average concentrations (45 ng l1 for the main
stem of the Tanllwyth and 66 to 70 ng l1 for the small
drainage areas).
Cerium. The average Ce concentration varied between 20
and 141 ng l1 across the sites. The lowest Ce concentrations
by the main stem of the Hafren and Hore where Ce concentrations increased moderately downstream (46 to 91 ng l1 for the Hafren; 69 to 108 ng l1 for the Hore). The
south2Hore draining podzol had an average Ce concentration (85 ng l1) similar to that for the lower Hafren
and Hore. The highest average Ce concentrations were for drainage from the gley (131 ng l1 for the main stem of the
Tanllwyth and 134 to 141 for the associated small drainage areas).
Praseodymium. The average Pr concentrations across the
sites varied between 4 and 19 ng l1. The lowest
concentrations fitted into two groups, one with concentrations (ranging from 4 to 10 ng l1) for the main
stems of the Hafren and Hore and the podzol drainage sites and the other with a average concentration of around
19 ng l1 for all the sites draining gley. For the former group,
Pr concentrations increased downstream in the main stems of the Hafren (6 to 10 ng l1) and the Hore (7 to 10 ng l1)
and average Pr concentrations for the downstream sites are close to that for south2Hore (9 ng l1) and, for the small
area drainage for the podzol sites, averaged 4 to 10 ng l1.
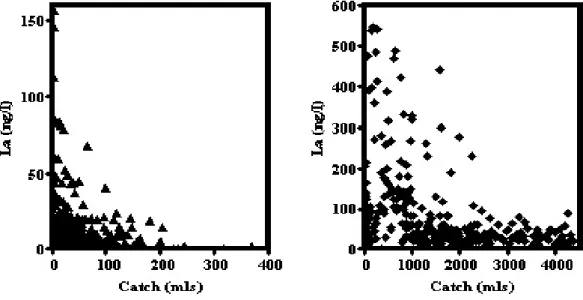
In general, the RE element concentrations are linearly related (Fig. 3) but, when their concentrations were anomalously high, the scatter in the data for La and Ce was very high. When the anomalous points were excluded, the RE element concentrations increased with increasing flow and then levelled off at high flows. The RE element concentrations increased broadly with decreasing pH and increasing aluminium concentrations (Fig. 4). This is indicative of RE element mobilisation under the acidic conditions in the soil, with flushing to the stream under high
flow conditions. The highest average RE element concentrations occurred for the gley soils which are the most acidic and exhibit a particularly flashy response to rainfall and rapid input of soil waters to the stream.
Regarding the RE ratios to La, there were clear patterns for each element (Table 3).
Y/La. The Y/La ratios ranged from 3.04 to 19.4 with an
average value across the streams of 8.29. These values are much higher than the baseline average for rainfall (1.31) as well as for standard continental shale, on average by an order of magnitude with a range of 4.28 to 27.3 times. This occurs
because the Y concentration in the streams is over an order of magnitude higher than that in rainfall, while the La concentration remains about the same. Thus, there is a large-scale enrichment of Y when rainfall interacts with the catchment, while for La there is little change. With respect to the pollution events, the enrichment factor is two orders of magnitude higher. In this case, the low Y/La ratio in rainfall reflects a high La concentration relative to the background and within the streams. La concentrations are an order of magnitude lower, reflecting either dilution of the pollutant input events (the pollutant events make up a small fraction of the total events), or there is loss of La within Table 3. Ratios of Y, Ce and Pr to La for rainfall, cloud water, stream water and groundwater.
The rainfall data are split into two to show the background (1) and pollutant event (2) components. The LHS provides the average for the ratio, while the RHS provides the same information normalised to standard continental shale.
Y/La Ce/La Pr/La Y/La Ce/La Pr/La
Normalised to shale ATMOSPHERICINPUTS Rainfall (1) 0.93 3.23 0.19 1.31 1.55 0.83 Rainfall (2) 0.04 20.27 0.15 0.06 9.75 0.65 Cloud 0.95 1.55 0.25 1.34 0.75 1.09 STREAMS U Hafren 19.4 3.07 0.40 27.3 1.48 1.74 U Hore 13.9 4.06 0.41 19.6 1.95 1.78 L Hafren 9.7 3.26 0.50 13.7 1.57 2.17 L Hore 8.13 3.93 0.36 11.5 1.89 1.57 Tanllwyth 9.60 2.91 0.42 13.5 1.40 1.83 South2Hore 3.04 3.40 0.36 4.28 1.63 1.57 SE1 3.50 1.25 0.25 4.93 0.60 1.09 SE3 5.32 0.87 0.29 7.49 0.42 1.26 Tan N 3.13 2.03 0.27 4.41 0.98 1.17 Tan S 3.38 2.03 0.29 4.76 0.98 1.26 STREAMSUMMARY Average 8.29 2.59 0.36 11.1 1.29 1.54 Minimum 3.04 0.87 0.25 4.28 0.42 1.09 Maximum 19.4 4.06 0.50 27.3 1.95 2.17 GROUNDWATER Quarry 4.64 0.91 0.18 6.54 0.44 0.78 HA4 4.36 2.04 0.31 6.14 0.98 1.35 SE1 5.90 2.29 0.37 8.31 1.10 1.61 SE3 5.24 1.13 0.34 7.38 0.54 1.48 Tan 1 8.97 2.55 0.45 12.6 1.23 1.96 Tan 2 8.89 2.97 0.36 12.5 1.43 1.57 GROUNDWATERSUMMARY Average 6.33 1.98 0.34 8.92 0.95 1.46 Minimum 4.36 0.91 0.18 6.14 0.44 0.78 Maximum 8.97 2.97 0.45 12.6 1.43 1.96
the catchment, or a combination of both. The large variation in the Y/La ratio across the sites shows a clear structure, with higher ratios occurring in the main streams compared with the small drainage areas a difference of a factor typically about five-fold: the south2Hore also shows a relatively low Y/La ratio. This occurs for the podzolic drainage because of relatively low Y concentrations and for the gley drainage due to higher La concentrations.
Ce/La. The Ce/La ratio averages 2.59 for the streams and
varies between 0.87 and 4.06 across the sites. The averages are close to those for standard continental shale (the streams are 29% higher than standard continental shale on average) and vary from 0.42 to 1.95 times that for standard continental shale. This range is much lower than that for the Y/La ratio, but a consistent pattern emerges of higher ratios for the larger streams and lower ratios for the smaller drainage areas: for the small drainage areas, the podzol has lower Ce/La ratios than the gley. The Ce/La ratio in background rainfall is moderately higher than the average for the streams, relative to standard continental shale (1.55 versus 1.29): for the pollution events, the rainfall Ce/La ratio relative to standard continental shale (9.75) is about 7.6 times higher than that for the stream (1.29). The differences reflect lower Ce concentrations in the stream compared to rainfall and there may well be an uptake of Ce relative to La within the catchment.
Pr/La. The Pr/La ratio in the streams averages 0.36 with a
range of 0.25 to 0.50. This corresponds to an average enrichment of 54% over that of standard continental shale and the range is a factor of 1.09 to 2.17 relative to standard continental shale. The Pr/La ratio in the streams is higher than that in rainfall: a difference typically of around 1.6. The Pr/La ratio is moderately higher relative to standard continental shale for the larger streams (1.57 to 2.17) compared to the small drainage areas (1.09. to 1.57), but there is little difference between the Pr/La ratio for the podzol and the gley.
GROUNDWATER
The average concentrations of the RE elements in groundwater are generally higher than those in the streams by a factor of about two. Average RE concentrations also range widely from borehole-to-borehole. Thus, the range for Y is 51 to 1164 ng l1 ng l1, for La 11 to 222 ng l1, for
Ce 10 to 250 ng l1 and for PR 2 to 76 ng l1. The low values
for the RE elements monitored is the quarry borehole site and the high values are all for the SE3 borehole site. Nonetheless, there is no consistent behaviour between the
podzol and gley sites although, within each borehole, their concentrations are highly correlated. Broadly, RE element concentrations increased with decreasing pH and Al in line with the rivers but the relationships are much weaker and there was some correlation with beryllium and cadmium.
RE element ratios to La in groundwaters were similar (in part moderately lower) to those for the streams, with the clearest enrichment for Y (Table 3). For example, the ratios relative to standard continental shale for groundwater and the streams were respectively, 8.92 versus 11.1 for Y/La, 0.95 versus 1.29 for Ce/La, and 1.46 to 1.54 for Pr/La). There are however some clear site-to-site differences. Thus,
l Y/La. The Y/La ratios relative to standard continental
shale are higher for the gley (12.512.6) than the podzol (6.148.31) areas and the La concentrations were typically lower than for the other borehole sites, except for the borehole at the quarry site.
l Ce/La. The lowest Ce/La and Pr/La ratio relative to
standard continental shale was for the quarry borehole (0.44 and 0.78 respectively) compared to the other sites (0.54 to 1.43 and 1.35 to 1.96, respectively). The Y/La ratio to standard continental shale was also low for the Quarry site (the second lowest ratio).
l The highest Ce/La and Pr/La ratios were for the gley (1.23 to 1.43 and 1.57 to 1.96, respectively) compared to the podzol sites (0.44 to 1.10 and 0.8 to 1.61, respectively), although the difference was relatively small and, in some cases, insignificant.
Discussion
Although the Plynlimon catchments are over 60 km from any industrial development and in the centre of rural mid-Wales, the area has pollutant deposition associated with acidification and heavy metals including La, Ce and Pr (Wilkinson et al., 1997; Neal et al., 2001, Robson and Neal, 1996). This pollutant deposition, especially of the transition metals and RE elements was unexpected at the outset; their measurement came about only because the availability of ICPMS facilities allowed the assay of a wide spectrum of chemical elements with a single and rapid determination. Indeed, had a project to examine RE element deposition and within-catchment attenuation been proposed at the time of the inception of the present project, or even today without the insight gained from the present study, funding support would have been most unlikely. Wilkinson et al. (1997) showed that the RE element concentrations in rainfall and cloud water were correlated with several pollutant components and this correlation was tied in with atmospheric scavenging with the highest concentrations at the lowest
volumes of rain catch. The anomalously high La and Ce concentrations in rainfall were exceptions to this relationship and correspond to a different type of pollutant input. In terms of these anomalous rainfall inputs, anecdotal evidence from an engineer in the power industry for Northern Ireland (Frank Toone) stated that, in the late 1980s, to prevent deposition of heavy metals (V in particular) on super-heated tubes after combustion, Ce- bearing solids were added as slurry to fuel oil prior to final oil heating and then combustion. The practice was stopped soon after because it led to the formation of deposits at the bottom of the furnace. Further details of this have not been available but, clearly, there are issues for at least one RE element and there might well have been other uses that led to atmospheric contamination towards the end of the 1980s and the early 1990s. Furthermore, other sources of RE elements might have occurred in rainfall and in cloud water e.g. from fluidised catalytic crackers (Wilkinson et al., 1997).
The atmospheric deposition of RE elements may well have led to contamination in the streams but, apart from a few outlier values of concentration much lower than the outliers in rainfall, this feature is not clearly distinguishable. In part, less frequent and more dilute RE element pollutant signals in the streams are to be expected because of the uptake of RE elements, as highly charged ions, by the soil in the catchment. However, there are also issues of within-catchment storage and fractal processing. Within-within-catchment storage often accounts for a damping of the rainfall signal as occurs for unreactive chemicals entering a catchment from atmospheric sources (e.g. chloride: Neal and Kirchner, 2000). However, this does not explain the RE element outlier points within the stream. While the outlier RE element values occur within the same years as the rainfall outliers, as of course would be expected, the peaks do not coincide for all the streams monitored. This implies a very intermittent signal within the stream and this feature has been observed previously for chromium, another atmospheric contaminant (Neal et al., 1996). The results imply a decoupling of La and Ce within the streams, as the outlier values are not correlated. As noted by Kirchner et al. (2004) for water quality, high-resolution (sub-daily) data are required to show the ranges of response by the stream to rainfall inputs. It must also be borne in mind that rainfall, measured as an integrated weekly catch only, will damp shorter-term rainfall variation in the RE elements, whereas the stream represents an instantaneous grab sample damped by the transit time of the water through the catchment.
Clearly, since the concentrations of the RE elements in the streams are similar or higher than those in the rainfall, there is a significant input relative to the stream output. The extent of the atmospheric component can be estimated at
least semi-quantitatively using the water balance and flow-weighted average concentrations in rainfall and stream water. At Plynlimon, average rainfall deposition is 2518 mm yr1 and evaporation and transpiration losses amount to
491 and 632 mm yr1 for the moorland and mixed moorland/
forested catchments, respectively (Hudson et al., 1997). Correspondingly, cloud water inputs are about 33 and 140 mm yr1 for moorland and forest cover, respectively
(Wilkinson et al., 1997). For the case where the rainfall is representative of background conditions, there is on average a net outflux of RE elements from the catchment, particularly of Y. Thus, the ratios for output to input flux are factors of 11.0-fold (range 2.8 to 21.4) for Y, 1.6-fold (range 0.8 to 2.4) for La, 1.65-fold (range 0.39 to 2.61) for Ce and 2.91-fold (range 1.1 to 5.3) for Pr. If the pollution events in rainfall are included, then, while there remains a net output flux for Y and Pr (factors of 22 fold with range 5.6 to 43.3 for Y and 1.54 fold with range 0.6 to 2.8 for Pr), there is a modest net retention for La (about 18% a factor of 0.78 with range 0.4 to 1.21) and a much greater retention for Ce (about 86% a factor of 0.14 with range 0.03 to 0.22).
Within the streams, the influence of catchment size and soil types is marked. There are much higher Y/La ratios in the larger streams than in the small drainage areas and there are high aluminium and iron oxide components in the soil that may well be RE-bearing. For the larger streams, average ratios for Ce/La and Pr/La are higher, although the differences are less pronounced. Also, for the larger streams, the decrease in the Y/La ratio from upstream to downstream is not matched by the rations for Ce/La and Pr/La. The highest La, Ce and Pr concentrations occur for the gley areas (the main stem and small drainage areas in the Tanllwyth) where high iron oxide and aluminium components in the soil may well be RE element-bearing. Further, the high acidity in the gley soils coupled with reducing conditions that help solubilise iron, may well combine to promote leaching from the gley soils. The groundwater samples often, but not always, have the highest average RE element concentrations. Yet, compared with the stream waters, the link between the RE elements and pH and aluminium concentrations in the groundwaters remains unclear; indeed, groundwater chemistry varies from site to site for reasons that cannot easily be pinned down. Rather, differences seem to be localised and patterns of groundwater behaviour are heterogeneous, linked to fracture flow and erratic flow pathways.
Clearly, the atmospheric inputs provide a significant RE element flux for all but the Y component, which is strongly linked to processes within the catchment. Nevertheless, it is not clear that these atmospheric inputs necessarily get transferred simply through the catchment to the stream.
Within-catchment sources of RE elements seem to affect RE element ratios with each other, and the atmospheric input may well be retained within the soils or precipitated out under less acidic conditions within the catchment. To understand both the pollution climate and processes within the catchment, there remains a need for long-term studies and higher resolution monitoring to elucidate sources and the dynamics of change.
References
Bookings, D.G., 1989. Aqueous geochemistry of RE elements. Rev. Min., 21, Min Soc. Amer., 201226.
Christophersen, N., Neal, C., Hooper, R.P, Vogt, R.D. and Andersen, S., 1990. Modelling streamwater chemistry as a mixture of soilwater end-members - a step towards second-generation acidification models. J. Hydrol., 116, 307320. Elderfield, H., Upstill-Goddard, R. and Sholkovitz, E.R., 1990.
The RE elements in rivers, estuaries, and coastal seas and their significance to the composition of ocean waters. Geochim. Cosmochim. Acta, 54, 971992.
Hudson, J.A., Crane, S.B. and Blackie, J.R., 1997b. The Plynlimon water balance 1969-1995: the impact of forest and moorland vegetation on evaporation and streamflow in upland catchments. Hydrol. Earth Syst. Sci., 1, 409427.
Johannesson, K.H. and Zhou, X., 1999. Origin of middle RE element enrichments in acid waters of a Canadian high Arctic lake. Geochim. Cosmochim. Acta, 63, 153165.
Kirchner, J.W., Feng, X., Neal, C. and Robson, A.J., 2004. The fine structure of water-quality dynamics: the (high-frequency) wave of the future. Hydrol. Process., 18, 13531359. Lyvén, B., Hassellöv, M., Turner, D.R., Haraldsson, C. and
Andersson, K., 2003. Competition between iron- and carbon-based colloidal carriers for trace metals in a freshwater assessed using flow field-flow fractionation coupled to ICPMS. Geochim. Cosmochim. Acta, 67, 37913802.
McLennan, S.M., 1989. RE elements in sedimentary rocks: influence of provenance and sedimentary processes. Rev. Min.,
21, Min. Soc. Amer., 169200.
Michard, A., 1989. RE element systematics in hydrothermal fluids, 1989. Geochim. Cosmochim. Acta, 53, 745750.
Neal, C., 2004. The water quality functioning of the upper River Severn, Plynlimon, mid Wales: issues of monitoring, process understanding and forestry. Hydrol. Earth Syst. Sci., 8, 521 532.
Neal, C. and Kirchner, J.W., 2000. Sodium and chloride levels in rainfall, mist, streamwater and groundwater at the Plynlimon catchments, mid-Wales: inferences on hydrological and chemical controls. Hydrol. Earth Syst. Sci., 4, 295310.
Neal, C., Robson, A.J. and Smith, C.J., 1990. Acid neutralization capacity variations for the Hafren forest streams, Mid-Wales: inferences for hydrological processes. J. Hydrol., 121, 85101. Neal, C., Smith, C.J., Jeffery, H.A., Harrow, M.L. and Neal, M., 1996. Dissolved chromium pollution in rainfall and surface waters in Mid-Wales during the mid 1980s. Sci. Total Envir.,
188, 127138.
Neal, C., Wilkinson, R.J., Neal, M., Harrow, M.L., Wickham, H., Hill, L. and Morfitt, C., 1997. The hydrochemistry of the headwaters of the River Severn, Plynlimon, Wales. Hydrol. Earth Syst. Sci., 1, 583618.
Neal, C., Reynolds, B., Neal, M., Pugh, B., Hill, L. and Wickham, H., 2001. Long term changes in the water quality of rainfall, cloud-water and stream water for moorland, forested and clear-felled catchments at Plynlimon, mid-Wales. Hydrol. Earth Syst. Sci., 5, 459476.
Neal, C., Ormerod, S.J., Langan, S.J., Nisbet, T.R. and Roberts, J., 2004 (Editors). Sustainability of UK upland forestry: contemporary issues for the protection of freshwaters. Hydrol. Earth Syst. Sci., 8, 277595.
Neal, C., Reynolds, B., Neal, M. and Williams, B., 2004b. The hydrochemistry of plantation spruce forest catchments with brown earth soils, Vyrnwy in mid Wales. Hydrol. Earth Syst. Sci., 8, 460484.
Neal, C., Reynolds, B., Neal, M., Wickham, H., Hill, L. and Williams, B., 2004c. The water quality of streams draining a plantation forest on gley soils: the Nant Tanllwyth, Plynlimon, mid-Wales. Hydrol. Earth Syst. Sci., 8, 485502.
Neal, C., Reynolds, B., Neal, M., Wickham, H., Hill, L. and Williams, B., 2004d. The impact on conifer harvesting on stream water quality: the Afon Hafren, mid-Wales. Hydrol. Earth Syst. Sci., 8, 503520.
Nozaki, Y., Lerche, D., Alibo, D.S. and Snidvonos, A., 2000. The estuarine geochemistry of RE elements and indium in the Chao Phraya River, Thailand. Geochim. Cosmochim. Acta, 64, 3983 3994.
Robson, A.J. and Neal, C., 1996. Water quality trends at an upland Welsh site. Hydrol. Process., 10, 183203.
Smedley, P.L., 1991. The geochemistry of RE elements in groundwater from the Carnmenellis area, southwest England. Geochim. Cosmochim. Acta, 55, 27672779.
Taylor, S.R. and McLennan, S.M., 1985. The continental crust: its composition and evolution. Blackwell, Oxford, UK. 312pp. Weltje, L., Heidenreich, H., Zhu, W., Wolterbeek, H. Th., Korhammer, S., de Goeif, J.J.M. and Markert, B., 2002. Lanthanide concentrations in freshwater plants and molluscs, related to those in surface water, pore water and sediment. A case study in The Netherlands. Sci. Total Envir., 286, 191 214.
Wilkinson, R.J., Reynolds, B., Neal, C., Hill, S., Neal, M. and Harrow, M.L. 1997. Major, minor and trace element composition of cloud water and rain water at Plynlimon, Mid-Wales. Hydrol. Earth Syst. Sci., 1, 557570.