HAL Id: hal-03153917
https://hal.archives-ouvertes.fr/hal-03153917
Submitted on 2 Mar 2021
HAL is a multi-disciplinary open access
archive for the deposit and dissemination of
sci-entific research documents, whether they are
pub-lished or not. The documents may come from
teaching and research institutions in France or
abroad, or from public or private research centers.
L’archive ouverte pluridisciplinaire HAL, est
destinée au dépôt et à la diffusion de documents
scientifiques de niveau recherche, publiés ou non,
émanant des établissements d’enseignement et de
recherche français ou étrangers, des laboratoires
publics ou privés.
Distributed under a Creative Commons Attribution| 4.0 International License
Extended dilation of the radiocarbon time scale between
40,000 and 48,000 y BP and the overlap between
Neanderthals and Homo sapiens
Édouard Bard, Timothy Heaton, Sahra Talamo, Bernd Kromer, Ron Reimer,
Paula Reimer
To cite this version:
Édouard Bard, Timothy Heaton, Sahra Talamo, Bernd Kromer, Ron Reimer, et al.. Extended dilation
of the radiocarbon time scale between 40,000 and 48,000 y BP and the overlap between Neanderthals
and Homo sapiens. Proceedings of the National Academy of Sciences of the United States of America
, National Academy of Sciences, 2020, 117 (35), pp.21005-21007. �10.1073/pnas.2012307117�.
�hal-03153917�
Extended dilation of the radiocarbon time scale
between 40,000 and 48,000 y BP and the overlap
between Neanderthals and Homo sapiens
Edouard Barda,1, Timothy J. Heatonb, Sahra Talamoc, Bernd Kromerd, Ron W. Reimere, and Paula J. Reimere
aCEREGE, Aix-Marseille University, CNRS, IRD, INRAE, Collège de France, Technopôle de l’Arbois, 13545 Aix-en-Provence, France;bSchool of Mathematics
and Statistics, University of Sheffield, S3 7RH Sheffield, United Kingdom;cDepartment of Chemistry G. Ciamician, Alma Mater Studiorum, University of
Bologna, 40126 Bologna, Italy;dInstitute of Environmental Physics, Heidelberg University, 69120 Heidelberg, Germany; andeThe14CHRONO Centre for
Climate, the Environment and Chronology, School of Natural and Built Environment, Queen’s University Belfast, BT7 1NN Belfast, United Kingdom
Edited by Thure E. Cerling, University of Utah, Salt Lake City, UT, and approved July 14, 2020 (received for review June 19, 2020)
The new radiocarbon calibration curve (IntCal20) allows us to calculate the gradient of the relationship between14C age and cal-endar age over the past 55 millennia before the present (55 ka BP). The new gradient curve exhibits a prolonged and prominent max-imum between 48 and 40 ka BP during which the radiocarbon clock runs almost twice as fast as it should. This radiocarbon time dilation is due to the increase in the atmospheric14C/12C ratio caused by the 14C production rise linked to the transition into the Laschamp geo-magnetic excursion centered around 41 ka BP. The major maximum in the gradient from 48 to 40 ka BP is a new feature of the IntCal20 calibration curve, with far-reaching impacts for scientific communi-ties, such as prehistory and paleoclimatology, relying on accurate ages in this time range. To illustrate, we consider the duration of the overlap between Neanderthals andHomo sapiens in Eurasia.
radiocarbon
|
geochronology|
paleomagnetism|
NeanderthalT
he radiocarbon method is the most widely used dating method over the past 55 ka BP. It relies on the beta decay of the14C isotope produced in the upper atmosphere by interactionwith cosmic-ray particles. Samples of organic material or carbon-ates dated by14C either incorporated their carbon directly from the atmosphere as in plant photosynthesis, indirectly through the food chain, or by various chemical reactions. The14C content of a fossil sample is compared to the atmospheric14C content, which constitutes the starting reference for its disappearance by radio-active decay with a half-life of 5,700± 30 y.
In its raw form, the14C method is not accurate as atmospheric
14C content has not been constant over time, instead having
varied due to changes in its production rate and global carbon cycle rearrangements. To calculate a true calendar age from a14C measurement, one needs to know the initial atmospheric14C/12C
ratio at the time the sample carbon last exchanged with the at-mosphere. We therefore calibrate the radiocarbon method by comparing14C measurements against samples for which accurate (“true”) ages have been measured with independent dating tech-niques such as counting tree rings in subfossil tree logs, counting annually laminated sediments, or dating corals and stalagmites using uranium–thorium (U-Th). Over the past three decades, the resulting radiocarbon calibration curves have been provided by an international working group (IntCal). The new IntCal20 curve covering the past 55 ka BP has just been published (1), updating the previous IntCal13 version (2).
Over the past 55 ka, the14C calibration curve shows that14C
ages are usually younger than true ages (1, 2), that is, the14C clock generally ticks at a slower pace than it should. This is due to the overall decrease of the atmospheric14C/12C ratio over the past 40 ka (Fig. 1D), which partly compensates for the loss by radioactive decay in dated samples. Additionally, the relation-ship between14C ages and true calendar ages is far from linear. Compression of the14C time scale is particularly obvious during specific periods called 14C age plateaus, when the decreasing
atmospheric14C/12C ratio fully compensates for radioactive de-cay. This implies that archeological sites and artifacts from these periods cannot be dated precisely with radiocarbon. The14C age plateaus on the order of a few centuries are linked to modulation of cosmogenic production by variable solar activity. Longer age plateaus may correspond to changes in the carbon cycle and deep ocean circulation, for example during the plateau that occurred at the end of the Younger Dryas climatic event (3–5).
In parallel to periods when the14C clock runs too slowly, there are also specific periods characterized by an increasing atmo-spheric14C/12C ratio—also a consequence of solar and carbon cycle changes. Here, the14C clock ticks faster than it should.
One major outcome of the recent IntCal20 curve is that the pace of the 14C clock can be calculated at unprecedented pre-cision. We have computed the evolution of the first derivative of the IntCal20 curve, focusing on its multimillennial component (Fig. 1A). Over most of the past 55 ka, the gradient is below 1, meaning that the14C time scale is mostly compressed. However, the gradient is also characterized by a prominent maximum from 48 to 40 ka BP, reaching values up to 1.5 to 2 for the different sliding windows. Over this multimillennial period, there are about twice as many14C years as calendar years.
This expanded14C time scale was absent, or much less prominent, in former calibration curves, as seen by the comparison with IntCal13 (Fig. 1A). The 48 to 40 ka BP gradient maximum is directly tied to the rising trend of atmospheric Δ14C, minimal until 48 ka BP before rising by more than 500‰ over a period of only a few millennia, to reach a maximum around 40 ka BP. As shown, the Δ14C maximum (Fig. 1D) is broadly in phase with the minimum
intensity of the geomagnetic field (Fig. 1B) during the Laschamp excursion (6) and the maximum concentration of10Be (Fig. 1C)
measured in polar ice (7)—10Be is also formed by cosmic-ray
particles. The precise relationships, in phase and amplitude, be-tween14C,10Be, and paleomagnetic intensity are complex, notably
because14C atoms are mixed in the global carbon cycle, but can be studied with numerical models (7–10).
The maximumΔ14C value above modern,∼700‰ at 41 ka BP, has been known from14C and U-Th dating in corals since the late 1990s (8), but the earlierΔ14C minimum around 50 to 45 ka BP
was only evidenced later with marine sediments (9, 11). TheΔ14C record prior to 40 ka BP has been refined with independent data
Author contributions: E.B. designed research; E.B., T.J.H., and S.T. performed research; E.B., T.J.H., S.T., B.K., R.W.R., and P.J.R. analyzed data; and E.B. wrote the paper. The authors declare no competing interest.
This open access article is distributed underCreative Commons
Attribution-NonCommercial-NoDerivatives License 4.0 (CC BY-NC-ND).
1To whom correspondence may be addressed. Email: [email protected].
This article contains supporting information online athttps://www.pnas.org/lookup/suppl/
doi:10.1073/pnas.2012307117/-/DCSupplemental.
First published August 17, 2020.
www.pnas.org/cgi/doi/10.1073/pnas.2012307117 PNAS | September 1, 2020 | vol. 117 | no. 35 | 21005–21007
EARTH, ATMOS PHERIC, AND PLANETARY SCIENC ES ANTHR OPOLOGY BR IEF REPORT
based on counting tree rings in subfossil kauri logs from New Zealand (12), and with14C and U-Th dating of stalagmites from the Hulu Cave in China (10). These independent data and their updates confirmed each other and were used collectively with updated statistical techniques (13) in order to construct the new IntCal20 calibration curve (1).
The radiocarbon time dilation over the 48 to 40 ka BP window, occurring just before the Δ14C maximum, is thus a novel and major feature of the new IntCal20 curve. This time expansion effect has remained unnoticed, even though it was present to a
lower extent in IntCal13. The difference between IntCa20 and IntCal13 is mainly linked to new data, notably Hulu stalagmites (10) and kauri trees (12), corrections and screening of existing data (1), and improved statistical modeling (13).
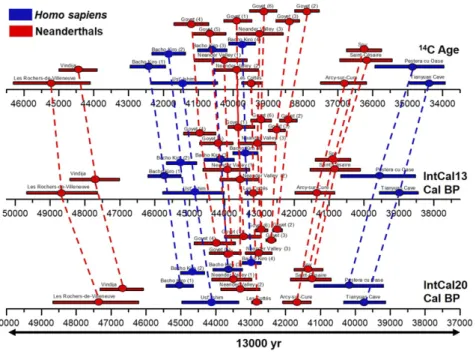
To illustrate the impact of the 48- to 40-ka-BP time dilation, Fig. 2 presents the14C and calendar chronologies of a selection
of prehistoric sites dated using14C from human bone collagen. This includes famous sites occupied by Neanderthals (in red) and byHomo sapiens (in blue). In terms of the radiocarbon clock, the chronological overlap between the oldest H. sapiens remains
0
200
400
600
800
0
10000
20000
30000
40000
50000
Δ
14C
Calendar age (years Before Present)
10
Be flux
5
15
10
Palaeomag intensity
0.6
0.2
0.4
0.5
1
1.5
2
0.5
0.0
1
1.5
2
14C/Cal
IntCal20 with 3kyr window and 95% confidence interval IntCal13 with 3kyr window IntCal20 with 5kyr window IntCal20 with 4kyr window IntCal20 with 2kyr window
14
C clock too fast
14
C clock too slow
A
B
C
D
Fig. 1. (A) First derivative of the IntCal20 curve (1) computed by calculating the14C age vs. calendar age gradient over sliding windows of between 5,000- and
2,000-y durations. The purple area shows the 95% confidence interval for the 3,000-y window (to maintain legibility this is the only interval plotted). The green curve shows the first derivative of the IntCal13 curve (2) using the 3,000-y window (to be compared with the purple curve for IntCal20). When the
gradient is above (below) unity, the14
C clock ticks faster (slower) than it should. (B) Evolution of the intensity (in 1022Am2) of the geomagnetic field (6); note
the reversed scale. (C) The10Be flux (in 106atoms·cm−2·y−1) measured in Greenland ice cores (7). (D) Atmospheric Δ14C (in per mille above modern) based on
the IntCal20 in red (1) and IntCal13 in green (2). The prominent maximum of the gradient curve (A) centered around 43 ka BP corresponds to the rising phase
of theΔ14
C curve (D) and thus predates the Δ14C and10
Be flux maxima (C) and the paleomagnetic intensity minimum (B) corresponding to the Laschamp geomagnetic excursion (vertical dashed line).
21006 | www.pnas.org/cgi/doi/10.1073/pnas.2012307117 Bard et al.
(Bacho Kiro Cave) and the youngest Neanderthal age (Saint-Césaire) is 6,250± 91014C years (uncalibrated). When calibrated against the IntCal13 and IntCal20 curves, this difference is reduced to 5,000± 860 and 3,960± 710 calendar years, respectively, clearly illustrating how the expanded14C time scale is compressed by about 60% after conversion to calendar ages with the new IntCal20 calibration. We note, however, that to investigate possible cultural and genetic exchanges, contact between two populations should be considered at a regional scale for adjacent sites.
For prehistory and human evolution, the impact of the 48 to 40 ka BP time dilation goes beyond the study of late Neanderthal and earlyH. sapiens in Europe. Indeed, it will also affect the current discussion onH. sapiens spread across Eurasia and into Australia and help improve the genetic clock with a better cali-bration of genome mutation rates (e.g., refs. 14 and 15).
The new prominent maximum between 48 and 40 ka BP in the gradient between14C and calendar years is important as it en-ables improved resolution to separate events during this period (e.g., different stratigraphic levels in the same site). In addition to the compression converting14C to calendar time, the combined
effects of the radiocarbon time dilation and the IntCal data im-provements also lead to increased calendar age precision (e.g., the 1σ uncertainty for the Les Cottés Neanderthal in Fig. 2 ranges from 270 in14C years to 250 and 160 calendar years with IntCal13
and IntCal20, respectively). Determining the relative calendar age ordering of multiple events dated by14C in this period is therefore not affected. The structure of IntCal20 beyond 40 ka BP rein-forces the need to measure accurately and precisely the small14C content of old samples, and in particular the use of updated pretreatment techniques to purify the original carbon fraction in order to eliminate residual contaminations.
Data Availability. All study data are included in the paper andDataset S1.
ACKNOWLEDGMENTS. E.B. is supported by the EQUIPEX ASTER-CEREGE, the Collège de France, and the Agence Nationale de la Recherche project CARBOTRYDH. P.J.R. acknowledges the support of the UK Research and Innovation Natural Environment Research Council (Grant NE/M004619/1). T.J.H. is supported by Leverhulme Trust Fellowship RF-2019-140\9. We thank both referees for their useful comments.
1. P. J. Reimer et al., The IntCal20 Northern Hemisphere radiocarbon calibration curve (0-55 kcal BP). Radiocarbon In press.
2. P. J. Reimer et al., IntCal13 and marine13 radiocarbon age calibration curves 0-50,000 years cal BP. Radiocarbon 55, 1869–1887 (2013).
3. H. Oeschger et al.,14C and other parameters during the Younger Dryas cold phase. Radiocarbon 22, 299–310 (1980).
4. T. Goslar et al., High concentration of atmospheric14C during the Younger Dryas cold episode. Nature 377, 414–417 (1995).
5. K. A. Hughen et al., Deglacial changes in ocean circulation from an extended radio-carbon calibration. Nature 391, 65–68 (1998).
6. C. Laj, H. Guillou, C. Kissel, Dynamics of the earth magnetic field in the 10-75 kyr period comprising the Laschamp and Mono Lake excursions: New results from the French Chaîne des Puys in a global perspective. Earth Planet. Sci. Lett. 387, 184–197 (2014). 7. R. Muscheler, J. Beer, P. W. Kubik, H. A. Synal, Geomagnetic field intensity during the
last 60,000 years based on10Be and36Cl from the Summit ice cores and14 C. Quat. Sci. Rev. 24, 1849–1860 (2005).
8. E. Bard, Geochemical and geophysical implications of the radiocarbon calibration. Geochim. Cosmochim. Acta 62, 2025–2038 (1998).
9. K. Hughen et al.,14C activity and global carbon cycle changes over the past 50,000 years. Science 303, 202–207 (2004).
10. H. Cheng et al., Atmospheric14C/12C changes during the last glacial period from Hulu Cave. Science 362, 1293–1297 (2018).
11. E. Bard, F. Rostek, G. Ménot-Combes, Radiocarbon calibration beyond 20,000 B.P. by means of planktonic foraminifera of the Iberian Margin. Quat. Res. 61, 204–214 (2004). 12. C. S. M. Turney et al., The potential of New Zealand kauri (Agathis australis) for testing the synchronicity of abrupt climate change during the Last Glacial Interval (60,000-11,700 years ago). Quat. Sci. Rev. 29, 3677–3682 (2010).
13. T. J. Heaton et al., The IntCal20 approach to radiocarbon calibration curve construc-tion: A new implementation using Bayesian splines and errors-in-variables. Radio-carbon In press.
14. J. F. O’Connell et al., When did Homo sapiens first reach Southeast Asia and Sahul? Proc. Natl. Acad. Sci. U.S.A. 115, 8482–8490 (2018).
15. Q. Fu et al., A revised timescale for human evolution based on ancient mitochondrial genomes. Curr. Biol. 23, 553–559 (2013).
16. C. Bronk Ramsey, Bayesian analysis of radiocarbon dates. Radiocarbon 51, 337–360 (2009).
Fig. 2. Comparison between radiocarbon ages (Upper) and corresponding calibrated ages with IntCal13 (Middle) and IntCal20 (Lower) for a selection of
human bone samples of Neanderthals (red) and early H. sapiens (blue). The14C ages (±1σ) were calibrated using IntCal13 (ref. 2, Middle) and IntCal20 (ref. 1,
Lower) in OxCal 4.2 (16). Note that the time axes of the three panels have exactly the same duration (13,000 y). The oblique dashed lines highlight the time
dilation effect centered around 43 ka BP.Dataset S1provides data and sources.
Bard et al. PNAS | September 1, 2020 | vol. 117 | no. 35 | 21007
EARTH, ATMOS PHERIC, AND PLANETARY SCIENC ES ANTHR OPOLOGY BR IEF REPORT