HAL Id: hal-00304650
https://hal.archives-ouvertes.fr/hal-00304650
Submitted on 1 Jan 2002HAL is a multi-disciplinary open access archive for the deposit and dissemination of sci-entific research documents, whether they are pub-lished or not. The documents may come from teaching and research institutions in France or abroad, or from public or private research centers.
L’archive ouverte pluridisciplinaire HAL, est destinée au dépôt et à la diffusion de documents scientifiques de niveau recherche, publiés ou non, émanant des établissements d’enseignement et de recherche français ou étrangers, des laboratoires publics ou privés.
model using data from a Mediterranean mountain
catchment
S. P. Anderton, J. Latron, S. M. White, P. Llorens, F. Gallart, C. Salvany, P.
E. O’Connell
To cite this version:
S. P. Anderton, J. Latron, S. M. White, P. Llorens, F. Gallart, et al.. Internal evaluation of a physically-based distributed model using data from a Mediterranean mountain catchment. Hydrology and Earth System Sciences Discussions, European Geosciences Union, 2002, 6 (1), pp.67-84. �hal-00304650�
Internal evaluation of a physically-based distributed model using
data from a Mediterranean mountain catchment
S.P. Anderton
1*, J. Latron
2, S.M. White
3†, P.Llorens
2, F. Gallart
2, C. Salvany
2and P.E.
O’Connell
11Water Resource Systems Research Laboratory, Department of Civil Engineering, University of Newcastle upon Tyne, Newcastle upon Tyne, NE1 7RU, UK 2Institute of Earth Sciences Jaume Almera (CSIC), Solé Sabarís s/n, 08028 Barcelona, Spain
3Instituto Pirenaico de Ecología (CSIC), Avda. Montañana 1005, 50059 Zaragoza, Spain
*now at Scottish Environment Protection Agency, 5 Redwood Crescent, Peel Park, East Kilbride G74 5PP, UK †Now at Institute of Water and Environment, Cranfield University, Silsoe, Beds MK45 4DT, UK
E-mail for corresponding author: [email protected]
Abstract
An evaluation of the performance of a physically-based distributed model of a small Mediterranean mountain catchment is presented. This was carried out using hydrological response data, including measurements of runoff, soil moisture, phreatic surface level and actual evapotranspiration. A-priori model parameterisation was based as far as possible on property data measured in the catchment. Limited model calibration was required to identify an appropriate value for terms controlling water loss to a deeper regional aquifer. The model provided good results for an initial calibration period, when judged in terms of catchment discharge. However, model performance for runoff declined substantially when evaluated against a consecutive, rather drier, period of data. Evaluation against other catchment responses allowed identification of the problems responsible for the observed lack of model robustness in flow simulation. In particular, it was shown that an incorrect parameterisation of the soil water model was preventing adequate representation of drainage from soils during hydrograph recessions. This excess moisture was then being removed via an overestimation of evapotranspiration. It also appeared that the model underestimated canopy interception. The results presented here suggest that model evaluation against catchment scale variables summarising its water balance can be of great use in identifying problems with model parameterisation, even for distributed models. Evaluation using spatially distributed data yielded less useful information on model performance, owing to the relative sparseness of data points, and problems of mismatch of scale between the measurement and the model grid.
Keywords: physically-based distributed model, SHETRAN, parameterisation, Mediterranean mountain catchment, internal evaluation,
multi-response
Introduction
It has been shown that, even for simple lumped conceptual models with relatively few parameters, a large number of alternative parameterisations can produce similar results, in terms of an integrated measure of system response like catchment discharge (Duan et al., 1993; Sorooshian and Gupta, 1983). This problem has been referred to variously as underdetermination, non-uniqueness or equifinality in parameter estimation (Beven, 1993; 1996; Oreskes et al., 1994). Equifinality implies that incorrectly parameterised internal processes might still produce acceptable results in terms of discharge, as a result of compensating errors (see Grayson et al., 1992a for an example of compensating errors in a distributed model). Failure to represent internal
catchment processes accurately might mean that model robustness is not maintained under changing environmental conditions, or that systematic errors might result from the use of the model for simulating sediment or solute transport. In the case of physically-based distributed models (PBDMs), the equifinality problem is exacerbated potentially by the fact that their distributed structure and relatively complex process equations generate a far larger number of parameters for which values must be estimated. It has been argued that rigorous a priori use of existing information, for instance on the distribution of topography, soils and land use in a catchment, can reduce substantially the dimensionality of the parameterisation problem for PBDMs (Refsgaard and Storm, 1996; Refsgaard, 1997). However, in most cases,
the readily available spatial data provide only general descriptive information on catchment properties, which cannot be used directly in model parameterisation. Actual model parameter values must be extrapolated from sparse measurements in the catchment, from values reported in the literature for similar conditions, or by way of empirical relationships between proxy variables and the parameters themselves (e.g. soil pedotransfer functions). Even where measurements of quantities that relate directly to model parameters do exist, measurements often cannot be translated directly into parameter values because of mismatches between the scales of measurement and model parameterisation, and because of the imperfect representation of real processes in models (Beven, 1989, 2000, 2001; Grayson et al., 1992b). Thus, it is inevitable that substantial uncertainty will remain as to the most appropriate value of many PBDM parameters.
Several authorities have suggested that an effective method for reducing uncertainty in parameter identification in PBDMs might be through their evaluation against a number of measurements representing different aspects of hydrological functioning and their spatial distribution within the catchment (Dunne, 1983; Grayson et al., 1992b; O’Connell and Todini, 1996; Beven, 2000). It is argued that this would facilitate rejection of those parameterisations for which the correct outlet discharge is being simulated erroneously as a result of internal compensating errors. The explicit representation of internal processes and the distributed structure of PBDMs makes them particularly amenable to such ‘internal’ evaluation. Examples of the use of multi-response calibration and/or evaluation of semi- or fully-distributed models have appeared recently in the literature (Ambroise et al., 1995; Refsgaard, 1997; Franks
et al., 1998; Lamb et al., 1998; Güntner et al., 1999; Vertessy
and Elsenbeer, 1999). Some of these studies have enabled greater discrimination between alternative parameterisations or model structures than the use of catchment discharge alone. Franks et al. (1998) demonstrated that the uncertainty in parameter estimates for TOPMODEL could be reduced substantially through the inclusion of estimates of saturated area extent as well as catchment runoff in the parameterisation process. Güntner et al. (1999) used observed spatial patterns of saturated areas and hydrograph separation to reveal the inadequacy of TOPMODEL’s description of runoff generation for a catchment in southern Germany, despite superficially good simulation of the outlet discharge. However, some catchment responses offer greater discriminatory power between different model structures and parameterisations than others. In an application of a lumped conceptual runoff and water quality model, Kuczera and Mroczkowski (1998) found that augmentation of
streamflow data with groundwater levels did little to reduce uncertainty in model parameterisation, whereas the inclusion of stream salinity data proved much more discriminatory. Likewise, Lamb et al. (1998) found that inclusion of piezometer data in the parameterisation procedure for TOPMODEL for a small catchment in Norway did little to reduce the overall uncertainty in prediction of catchment discharges.
This paper presents an evaluation of an application of the SHETRAN modelling system to a nested ensemble of small research catchments in north-eastern Spain. Detailed field data on a number of hydrological responses are available from the catchments (Gallart et al., in press), and these data have been used in a comprehensive evaluation of model performance. The objective of this exercise was to assess the degree to which field data on internal catchment responses can be used to evaluate individual aspects of process representation in the model. In this way, it was hoped that any shortcomings in model process representation could be identified more easily and attributed to specific problems with model parameterisation or structure, thereby easing the problem of model identifiability.
The SHETRAN modelling system
SHETRAN is a physically-based distributed modelling system for water flow, sediment and contaminant transport in river basins (Ewen et al., 2000). It is a development of the SHE system (Abbott et al., 1986a, b), which has been subject to many improvements and additions, most notably the development of a three-dimensional variably saturated sub-surface water flow model (Parkin, 1996), and the development of components for simulating sediment and contaminant transport (Ewen, 1995; Wicks 1988). This work has used the water flow component only, which is composed of individual modules for evapotranspiration (with an optional snow-melt module), overland and channel flow, and subsurface flow.Finite difference methods are used to solve the partial differential equations for flow and transport that are at the heart of SHETRAN. To facilitate this, the catchment area is discretised into rectangular computational elements, and the underlying soil zone and aquifer are represented by columns of cells which extend downwards from each of the surface grid squares. The river network is represented by a network of links that run around the edges of ground surface grid elements. This grid and column based structure allows the representation of spatial variability in catchment properties, in topography, soils and geology, land use and meteorological inputs, to be incorporated explicitly into catchment models.
Description of catchments
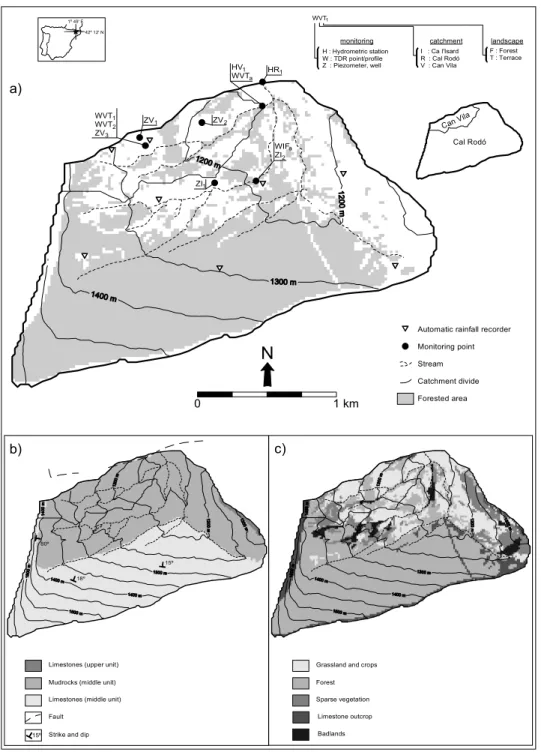
The subject of this application is the Cal Rodó catchment, and its subcatchment Can Vila, which are located in the headwaters of the Llobregat river on the southern margin of the Pyrenees, Catalonia, north-eastern Spain (Fig. 1). Cal Rodó and Can Vila are part of an ensemble of small research catchments, which are collectively named after the nearby village of Vallcebre and are described in detail by Gallart et
al., (in press). Cal Rodó as a whole has an area of 4.17 km2,
with elevation ranging from 1104 to 1643 m a.s.l. Can Vila occupies the north-western part of Cal Rodó, and has an area of 0.56 km2 and elevations ranging from 1115 to 1415 m
a.s.l.
The prevailing climate is sub-Mediterranean, with a mean annual rainfall of 924 mm, a mean annual temperature of 8ºC, and a mean annual reference evapotranspiration around 900 mm (Gallart et al., in press). Rainfall maxima occur in spring and autumn, although intense convective storms may also provide significant rainfall during the summer.
The northern part of Cal Rodó, including most of Can Vila, is underlain by mudstones, which are prone to landsliding and the formation of badlands on the steep slopes around the channel network. The southern part of Cal Rodó is underlain by a monoclinal outcrop of massive limestones, which dips below the mudstone beds at about 16o to the
NNE.
Climax vegetation for the region is mixed woodland dominated by oak and pine (Quercus pubescens and Pinus
sylvestris). However, most of the gentler slopes in the
catchment were deforested in the past and terraced for agricultural use, although cultivation of these terraces has been abandoned progressively during the second half of the 20th century. The terraced areas of the catchment are now
largely used for extensive pasture, and large areas have been subjected to spontaneous regrowth by Pinus sylvestris. Mediterranean scrub covers areas of thinner soils that occur on steeper slopes and on the limestone.
Soils in the catchments are generally of silt loam texture. The surface horizon tends to be well-structured with consequently high infiltration capacities, although hydraulic conductivity decreases rapidly with depth. Soil thickness varies greatly, depending on lithology, geomorphology and the changes induced by terracing. Badland areas exhibit regoliths whose thickness varies throughout the year but which rarely reach 15 cm; limestone areas are overlain by discontinuous soils up to about 40 cm thick; soils on hillslopes over mudstones are up to 80 cm thick and agricultural terraces can have soils thicker than 3 m.
Instrumentation of the Vallcebre catchments started in 1989 to analyse hydrological and sediment yield
consequences of land use changes (Llorens and Gallart, 1992) and the dynamics of badland areas (Balasch et al., 1992). Since 1994, instrumentation has been improved to undertake studies related to water balance and runoff generation processes: a detailed description of the catchment instrumentation and of the data it has yielded may be found in Gallart et al. (in press).
Previous studies on the hydrology of these catchments have addressed the hydrological response and sediment balance of terraced areas (Llorens and Gallart, 1992; Llorens
et al., 1997b); the role of terraces in runoff generation
(Gallart et al., 1994); runoff generation mechanisms (Latron
et al., 1997); sediment dynamics from badland areas (Regüés et al., 1995, 2000; Gallart et al., 1998) and forest rainfall
interception (Llorens et al., 1997a; Llorens, 1997). More recently, an overview of the range of runoff generation mechanisms found in the catchment and a summary of catchment water balance may be found in Gallart et al. (in press).
Parameterisation of the catchment
model
Refsgaard and Storm (1996) and Refsgaard (1997) emphasise the need for a rigorous parameterisation procedure to avoid methodological problems in subsequent phases of model calibration and validation. In particular, they stress that spatial patterns of parameter values should reflect only the significant and systematic variation described in the available field data, as exemplified by the use of representative parameter values for individual lithologies, soils and land uses. This approach, it is claimed, can reduce the number of free parameters in any subsequent calibration exercise. A similarly systematic approach was taken to parameterisation of the catchment model in this case. Spatial patterns of catchment properties were based on those observed in the catchment and parameter values for different soils, lithologies and land use classes were based as far as possible on measurements made in the catchment. Where data were not available for any particular catchment property class, parameter estimates were based on values quoted in the literature and from previous experience with SHETRAN.
TOPOGRAPHY, CHANNEL NETWORK, AND SURFACE FLOW PARAMETERS
Digital elevation data were available for Cal Rodó at a pixel resolution of 20 m. However, a default grid resolution of 100 m was chosen for the SHETRAN model of Cal Rodó: it was thought that this resolution would be sufficient to
capture most of the variability in macro-topography, and soil and vegetation types occurring in the catchment, while keeping model run times within reasonable limits.
Simulated channel dimensions were based on those observed in the field; channel and overland flow resistance coefficients were based on values reported by Chow (1959).
LAND USE AND EVAPOTRANSPIRATION PARAMETERS
Five distinct land use categories were identified within the catchment from analysis of aerial photographs and field surveys:
1. pasture, occupying 21.8% of the catchment area; 2. forest cover underlain by mudstone, occupying 17.6%
of the catchment area;
3. forest cover underlain by limestone, occupying 40.6% of the catchment area;
4. sparse mediterranean scrub, occupying 17.4% of the catchment area, and
5. largely unvegetated rock outcrops and badland areas, occupying 2.6% of the catchment area.
Vegetation parameters (root density functions, leaf area indices, and canopy storage and drainage variables) were determined from field and modelling studies carried out in the area (Llorens, 1997) and from experience gained from previous SHETRAN applications to Mediterranean areas (Parkin et al., 1996). Note that the parameterisation of Land Use Classes 2 and 3 was identical, except for differences in rooting depth resulting from different depths of soils found in the limestone and mudstone parts of the catchment.
SOILS AND GEOLOGY
The same process of field survey and analysis of aerial photographs allowed differentiation of four soil and rock types within the catchment:
1. soils derived primarily from mudstones, occupying 44.6% of the catchment area ;
2. mudstone outcrops, including areas with badland characteristics, occupying 6.4% of the catchment area; 3. thin soils underlain by limestone, occupying 46.2% of
the catchment area, and
4. limestone outcrops, occupying 2.8% of the catchment area.
These subdivisions formed the basis for the spatial distribution of soil types in the catchment model. In the
absence of detailed information, uniform soil layering and depths were assigned to each of the four classes. Soils in Class 1 were modelled as two layers: a highly permeable A-horizon to a depth of 0.2 m and a less permeable B-horizon to a depth of 0.8 m. Field observations have shown that the mudstone parent material is effectively impermeable, consequently it was excluded from the representation of the soil profile. A 0.1m thick surface layer of regolith material was included in the representation of the badland areas, below which the mudstone parent material was again assumed to be impermeable. Soils in Class 3 were modelled as a thin, humus rich, surface layer to a depth of 0.05 m, underlain by a mineral soil horizon to a depth of 0.25 m. The underlying limestone was incorporated to a depth of 1.0 m; limestone was also incorporated into the model to a depth of 1.0 m where it outcrops (Class 4). This depth of limestone was included to allow for the effects of lateral transmission of water through the highly fissured zone at the base of the soil profile.
SHETRAN’s Variably Saturated Subsurface model is based around a three-dimensional Richards-type equation. Consequently, the parameters required for each individual soil or rock layer are:
1. saturated and residual soil moisture content (θs, θr)
2. saturated hydraulic conductivity (Ks)
3. soil moisture retention and unsaturated hydraulic conductivity curves as summarised by the parameters α and n of the van Genuchten model (van Genuchten, 1980).
Some soil texture and saturated hydraulic conductivity data were available from field and laboratory experiments on surface soils, mostly for Class 1 (soils derived from mudstones) but also for Class 3 (thin soils over limestone). Initial parameter estimates for these classes were based on these data: hydraulic conductivity data were used directly; texture data were used to estimate the parameters θs, θr, α
and n using pedotransfer functions (Saxton et al., 1986). However, no information was available on the hydraulic properties of the limestone itself or of the outcropping mudstones in the badlands areas (Classes 2 and 4). Initial parameterisation of these classes drew upon a number of sources: previous unpublished work carried out in the area for the badlands; examples from the literature (Ford and Williams, 1989) for ranges of values for the hydraulic conductivity of limestone, and experience from previous applications of SHETRAN (Dunn and Mackay, 1995). The vertical cell discretisation ranged from 0.01 m at the top of the soil profile, increasing to 0.1 m at depth.
limestone area of the catchment was that a significant, but unquantified, amount of the hydrologically effective rainfall falling on this area is lost through percolation to a deeper regional aquifer. This process was represented through the application of a unit head gradient boundary condition at the base of the limestone area. This allowed control of water loss by calibration of the vertical component of the hydraulic conductivity in the bottom cell of each column in the limestone area: v v q K z z K q = ∴ =− ∂ ∂ ∂ ∂ − = ψ , ψ 1.0 (1) where
q specific water flux across the bottom boundary of
the limestone area (m s-1)
ψ
potential (m)z vertical distance (m)
Kvvertical hydraulic conductivity (m s-1)
Imposition of a lower boundary condition of this type allows the magnitude of the loss term to vary in response to changes in moisture content in time and space. It was felt that this would yield a more realistic representation of water percolation through the limestone than direct calibration of a fixed value for the loss term.
METEOROLOGICAL INPUT DATA
Twenty-minute interval precipitation and reference (potential) evapotranspiration series, running from September 1994 to June 1997 inclusive, were used to drive the catchment model (Gallart et al., in press).
The different components of actual evapotranspiration were calculated as a proportion of the reference evapotranspiration within SHETRAN during the simulation. The Rutter model was used to calculate canopy interception losses (Rutter et al., 1971; Rutter et al., 1975). Soil evaporation and transpiration were calculated as a function of the soil matric potential in the root zone (Feddes et al., 1976).
The calibration-evaluation exercise
OVERVIEW OF APPROACH
As discussed above, reasonable a priori estimates of all model parameters could be obtained, with the exception of the vertical conductivity parameter controlling the magnitude of the aquifer loss term in the limestone area of the catchment (Kv). Model calibration was therefore necessary in order to estimate a reasonable value for this
parameter. All other model parameters were treated as fixed. A split-sample calibration-evaluation test using discharge at two points was used: the calibration period ran from September 1994 to January 1996 (17 months); the evaluation period ran from February 1996 to June 1997 (17 months). The magnitude of the Kv parameter for the lowest layer of cells in the limestone area was manipulated using trial and error to minimise the difference between observed and simulated discharge from Cal Rodó for the calibration period. Flow data from the Can Vila subcatchment were also used to judge model results during calibration. Since Can Vila is almost entirely underlain by impermeable mudstones, this comparison provided an indicator of model performance independent of the effects of the calibrated loss term.
The performance of the calibrated model was then evaluated against discharge from Cal Rodó and Can Vila for the subsequent evaluation period. It should be noted that the calibration period, with an average monthly rainfall of 113 mm, was much wetter than the evaluation period with an average monthly rainfall of 84 mm (Gallart et al., in press). As such, this constitutes a more rigorous test of a model’s ability to simulate the full range of climate conditions found in the catchment than would a split sample test with similar conditions during both calibration and evaluation periods (Klemeš, 1986).
In addition to discharge, the performance of the model was evaluated against a number of other catchment responses:
1. Soil moisture observations from four locations, measured using time domain reflectrometry (TDR). 2. Catchment average soil moisture reserve for Cal Rodó
and Can Vila. This was calculated from a number of point TDR measurements using a GIS-based weighted averaging procedure, which takes into account the topographic situation and vegetation cover of each of the measurement points (Gallart et al., in press). 3. Phreatic surface level at five locations.
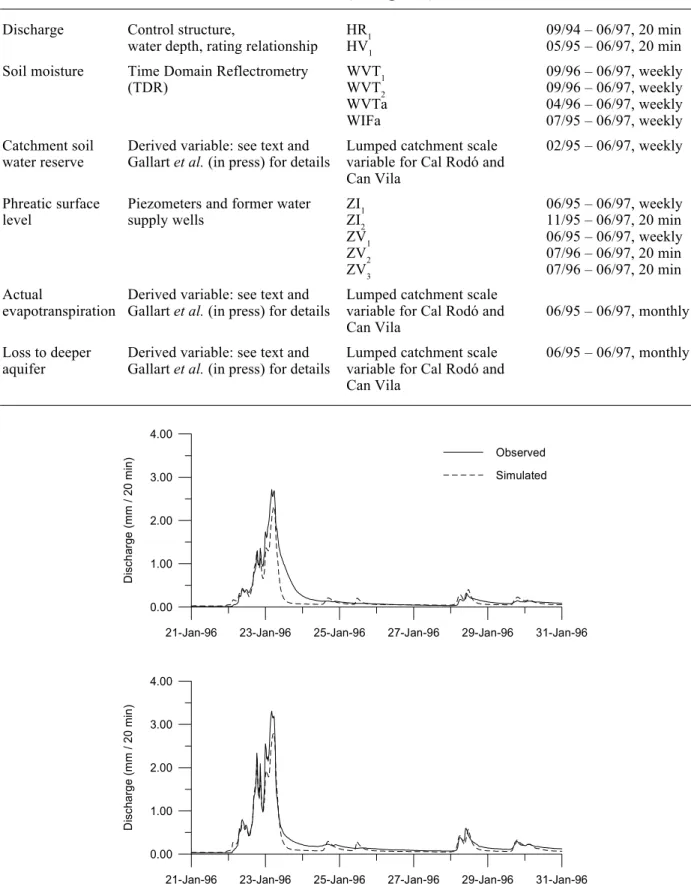
4. Water balance derived estimates of actual evapotranspiration (AE) and the aquifer loss term. Refer to Fig. 1 for locations of instrumentation and Table 1 for a brief summary of the evaluation data (detailed descriptions of the measurement and derivation of these data are given in Gallart et al., in press). Note that the duration of the observed data series varied. To make maximum use of the internal data, their use in evaluation was not confined to the period used for evaluation of the discharge response. This was considered justified, given that none of these internal data were used in model calibration.
15º 18º
80º
a)
b) c)
Limestones (upper unit) Mudrocks (middle unit) Limestones (middle unit) Fault
Strike and dip 15º
Grassland and crops Forest Sparse vegetation Limestone outcrop Badlands
N
0 1 km H : Hydrometric station W : TDR point/profile Z : Piezometer, well WVT1 F : Forest T : Terrace landscape monitoring I : Ca l'Isard R : Cal Rodó V : Can Vila catchment 1º 49' E 42º 12' N ZV1 WVT WVT ZV 1 2 3 ZV2 HR1 WIF ZI2 ZI1Automatic rainfall recorder Monitoring point Stream Catchment divide Forested area Can Vil a Cal Rodó a HV WVT1a
Fig. 1. Maps of the Cal Rodó and Can Vila catchments, showing (a) instrumentation, (b) geology and
(c) land use. Codes for instrumentation shown in (a) are used throughout the paper.
CALIBRATION RESULTS
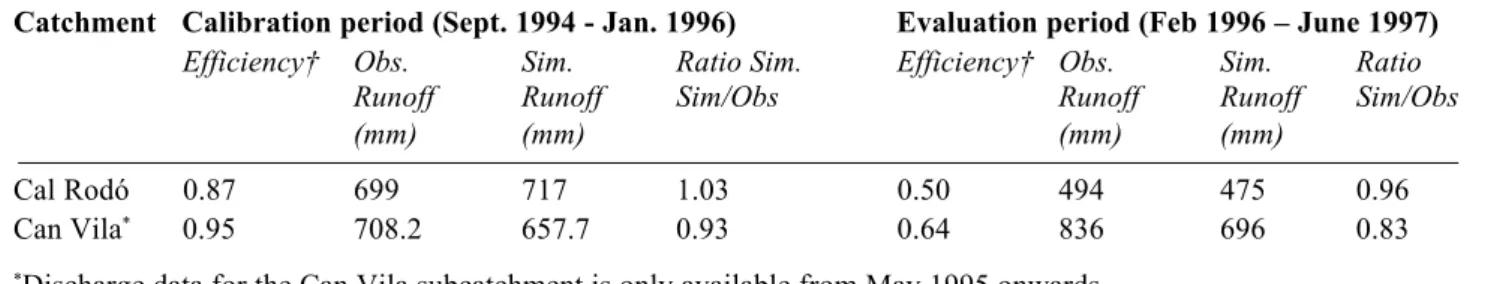
Model performance during calibration was evaluated using two criteria: Nash-Sutcliffe Efficiency (Nash and Sutcliffe, 1970) was used to measure the goodness of fit of the observed and simulated hydrograph, while comparisons of cumulative runoff were used to detect any long term bias in simulated flows. It may be seen from Table 2 that efficiencies at a 20-minute timestep were good for both catchments, and
that the cumulative error in simulated runoff volume for both catchments was acceptably small. Visual comparison of observed and simulated hydrographs demonstrated that the calibrated model simulated peak flows fairly accurately (Fig. 2). However, in both cases, simulated hydrograph recessions tended to be too steep initially and then to flatten out too quickly.
Table 1. Details of data used for model evaluation
Quantity Measurement Type Location of measurement Duration and interval of
(see Figure 1) data series
Discharge Control structure, HR1 09/94 – 06/97, 20 min
water depth, rating relationship HV1 05/95 – 06/97, 20 min Soil moisture Time Domain Reflectrometry WVT1 09/96 – 06/97, weekly
(TDR) WVT2 09/96 – 06/97, weekly
WVTa 04/96 – 06/97, weekly
WIFa 07/95 – 06/97, weekly
Catchment soil Derived variable: see text and Lumped catchment scale 02/95 – 06/97, weekly water reserve Gallart et al. (in press) for details variable for Cal Rodó and
Can Vila
Phreatic surface Piezometers and former water ZI1 06/95 – 06/97, weekly
level supply wells ZI2 11/95 – 06/97, 20 min
ZV1 06/95 – 06/97, weekly
ZV2 07/96 – 06/97, 20 min
ZV3 07/96 – 06/97, 20 min
Actual Derived variable: see text and Lumped catchment scale
evapotranspiration Gallart et al. (in press) for details variable for Cal Rodó and 06/95 – 06/97, monthly Can Vila
Loss to deeper Derived variable: see text and Lumped catchment scale 06/95 – 06/97, monthly aquifer Gallart et al. (in press) for details variable for Cal Rodó and
Can Vila
21-Jan-96 23-Jan-96 25-Jan-96 27-Jan-96 29-Jan-96 31-Jan-96
0.00 1.00 2.00 3.00 4.00 Di sch ar ge ( mm / 2 0 m in ) Observed Simulated
21-Jan-96 23-Jan-96 25-Jan-96 27-Jan-96 29-Jan-96 31-Jan-96
0.00 1.00 2.00 3.00 4.00 D is ch ar ge ( m m / 20 m in)
EVALUATION RESULTS Discharge
The performance of the model in simulating discharge for the evaluation period was judged using the same criteria as were used during the calibration process. It may be seen that there is appreciable deterioration in efficiency values for the evaluation period for both Cal Rodó and Can Vila (Table 2).
This decline in efficiency seems to result from the fact that the evaluation period was significantly drier than the calibration period. The Nash-Sutcliffe efficiency criterion
used in the study tends to be biased towards highest flows through the use of squared differences in its calculation; furthermore, the model’s prediction of these flow peaks was reasonably good. Thus, high efficiency values were obtained for the calibration period. Lower efficiency values for the evaluation period were a reflection of the reduced occurrence of high flows, which allowed the impact of errors at flows nearer the mean (i.e. in flow recessions, which were simulated relatively poorly by the model) to have a greater influence on efficiency values.
Cumulative flow residuals indicate that the overall catchment water balance for Cal Rodó appears to have been well maintained throughout the simulation (Table 2, Figure
Table 2. Summary of comparison of observed and simulated discharge
Catchment Calibration period (Sept. 1994 - Jan. 1996) Evaluation period (Feb 1996 – June 1997)
Efficiency† Obs. Sim. Ratio Sim. Efficiency† Obs. Sim. Ratio
Runoff Runoff Sim/Obs Runoff Runoff Sim/Obs
(mm) (mm) (mm) (mm)
Cal Rodó 0.87 699 717 1.03 0.50 494 475 0.96
Can Vila* 0.95 708.2 657.7 0.93 0.64 836 696 0.83
*Discharge data for the Can Vila subcatchment is only available from May 1995 onwards. † Nash-Sutcliffe efficiency calculated on a 20 minute timestep
1-Sep-94 20-Mar-95 6-Oct-95 23-Apr-96 9-Nov-96 28-May-97
0 50 100 Ru no ff ( m m / d ay ) -200 -100 0 100 C um ul ati ve Fl ow Re si du al ( mm) Cal Rodó Can Vila CALIBRATION EVALUATION
Fig. 3. Cumulative flow residuals for Cal Rodó and Can Vila, with daily runoff for Cal
Rodó shown for reference (N.B. Cumulated flow residuals are defined as , where Qs is the simulated daily runoff, and Qo is the observed).
∑
=− n i i o s Q Q 1 ) (
3). However, it is apparent from the form of the flow residual curve that underestimates of recession flows have been compensated for by a slight overestimation of baseflow.
For the Can Vila subcatchment, it may be seen that there is a substantial underestimate in the total runoff by the end of the evaluation period (Table 2, Fig. 3). This subcatchment is largely impermeable, so that the calibrated limestone loss term has a negligible effect on the water balance. The largest flow residuals occur during recession flows, which is symptomatic of the problem already seen in the runoff hydrographs. Interestingly, this problem was not observed during the calibration period: this may be because the period of calibration flows available for Can Vila was rather shorter than for Cal Rodó (only 8½ months, as opposed to 17 months).
Soil moisture content
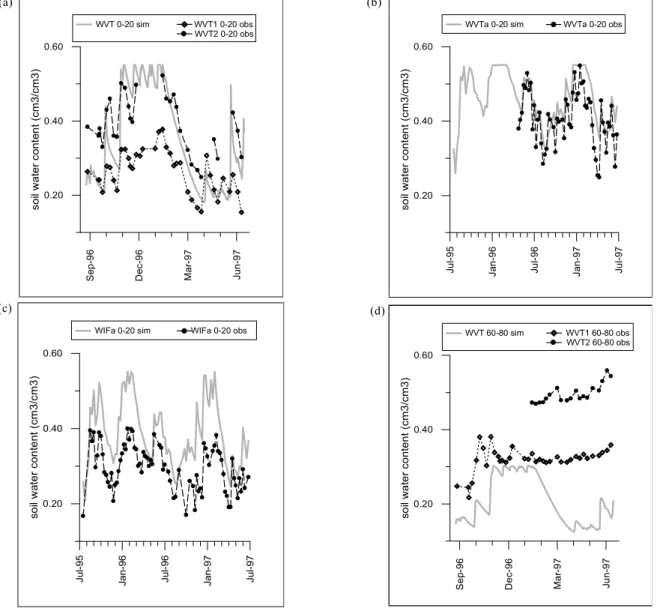
Soil moisture data from the top 20 cm of the soil profile from four locations were used to evaluate the model’s simulation of moisture dynamics in the A-horizon of surface soils (Fig. 1). Data were also available for deeper in the soil profile at two of these locations (WVT1 and WVT2). Data from 60–80 cm below ground surface from these two points were used to evaluate the model’s simulation of moisture dynamics in the B-horizon of surface soils. It should be pointed out that the comparisons presented below are between point measurements and model results from the corresponding 100 × 100 m grid. Consequently, it was not expected that the model results would replicate field measurements exactly. However, it was hoped that the model could reproduce broad trends in soil moisture behaviour over time, and in space, in terms of hillslope position and vegetation type.
0-20 cm profiles
Measurement points WVT1 and WVT2 are located on the outer and inner parts respectively of the same pasture-covered terrace in a mid-slope location, and are contained within the same grid element in the SHETRAN simulation. Despite being only metres apart, the soil moisture data from these points demonstrate quite different behaviours (Fig. 4a). Model results reproduce the data series from WVT2 quite accurately (albeit with a tendency to become too dry during dry periods), while they substantially overestimate soil moisture at WVT1. Soil moisture variations at WVTa
(valley floor position, pasture covered terrace) are generally well simulated although, in contrast to WVT2, the model appears to underestimate variability at this point (Fig. 4b). Point WIFa is located on a forested terrace in a valley floor location and displays generally lower soil moisture contents
than those points that are pasture-covered: this is thought to be the result of greater rainfall interception by the forest canopy. The model reproduces overall trends in data from WIFa quite well but tends to overestimate water content substantially (Fig. 4c). This is probably due to the fact that the model grid corresponding to point WIFa is actually parameterised as being pasture-covered. Again, this is a problem of model scale: the 100 m grid resolution was insufficient to differentiate the small forest patch in which WIFa was situated from the surrounding, predominantly pasture-covered, area.
60-80 cm profiles
It may be seen that the model underestimates the absolute value of moisture content deeper in the soil profile to some extent at WVT1, and to a larger extent at WVT2 (Fig. 4d). Model results also exaggerate variability in moisture content, simulating a seasonal change in moisture content which appears not to have occurred in reality.
Catchment average soil moisture reserve
The relatively small number of measurements available and the great local variability of soil moisture content observed in the field data presented above led to the adoption of a further model evaluation procedure based on a catchment average soil moisture value, hereafter referred to as the catchment water reserve. This quantity was determined using weekly soil water content readings from the upper 80 cm of the soil profile at five points in the nearby Cal Parisa catchment (Gallart et al., in press). The use of data from Cal Parisa to estimate the water reserve for Can Vila was considered justified because of the longer data records available for Cal Parisa, and because of the proximity and similarity of the catchments. The methodology for estimation of catchment water reserve is based on the results of Gallart et al. (1997), that topography and vegetation cover were the main influences on the spatial variability of soil water content in the Vallcebre area. Thus, each of the five instrumented soil moisture profiles in Cal Parisa was assumed to be typical of its topographic and vegetation cover setting. Extrapolation of data to Cal Rodó and Can Vila was then carried out using a GIS-based classification approach, in which the appropriate moisture regime from the Cal Parisa measurements is assigned to each pixel in a 20 m DTM according to pixel values of topographic index and vegetation cover. The average catchment water reserve was then calculated as a weighted average of the assigned soil moisture classes, adjusted according to soil depth. Some error in its estimation may arise from the assumptions used in this procedure and from the representativeness (or
otherwise) of individual point measurements of their surroundings. However, while this might cause some systematic error in the absolute value of the water reserve, it should not affect estimates of water reserve variations significantly over time .
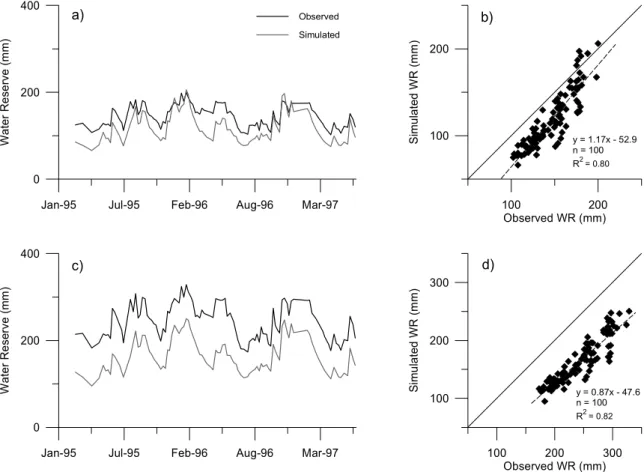
For Cal Rodó as a whole, water reserve values for wetter conditions are very well reproduced generally although the model tends to underestimate for drier conditions; this is especially noticeable for a period lasting from late February to mid-April 1996 (Fig. 5a). Consequently, the average simulated value for the period presented is some 28 mm lower than the observed. The use of least squares regression to fit a line to a scatterplot of observed and simulated data confirms the good fit between them (R2 = 0.80, Fig. 5b).
The slope of the best-fit line slightly exceeds unity (1.17), highlighting the tendency of the model to overpredict the range of soil moisture variation in the catchment.
For Can Vila, simulated water reserve values tend to be substantially lower than the observed values (some 80 mm lower, on average, for the period of data presented, Fig. 5c), probably because of underestimation of soil moisture in the deeper horizons. However, changes in the simulated moisture reserve generally correspond very closely to the observed, the only exception to this being for the same period in early 1996 as noted above, when depletion of the water reserve is again overestimated. Figure 5d demonstrates the close correspondence between variations in observed and simulated values (R2 = 0.82). The slope of the line fitted
Se p-96 De c-96 Mar -9 7 Ju n-97 0.20 0.40 0.60 so il w a ter c ont e n t ( cm3/c m3) WVT 0-20 sim WVT1 0-20 obs WVT2 0-20 obs 0.20 0.40 0.60 so il wa te r c o n te n t (c m 3 /c m 3 )
WVTa 0-20 sim WVTa 0-20 obs
Ju l-95 Ja n-96 Ju l-96 Ja n-97 Ju l-97 0.20 0.40 0.60 so il w a te r co n te n t (cm 3 /c m 3 )
WIFa 0-20 sim WIFa 0-20 obs
Jul-95 Jan-96 Jul-96 Jan-97 Jul-97
Fig. 4. Comparison of simulated and observed soil moisture: (a) WVT1 and WVT2, 0-20 cm below ground surface; (b) WVTa, 0-20 cm below ground surface; (c) WIFa, 0-20 cm below ground surface; (d) WVT1 and WVT2, 60-80 cm below
ground surface. Refer to Figure 1 for instrumentation locations.
S e p-96 Dec -9 6 M a r-9 7 Jun-97 0.20 0.40 0.60 so il wate r c ontent (c m3/c m3) WVT 60-80 sim WVT1 60-80 obs WVT2 60-80 obs (a) (b) (c) (d)
to the scatterplot data is slightly less than unity (0.87), indicating a slight tendency towards underestimation of the full range of variation in the observed values.
Phreatic surface level
Phreatic surface level data from wells and piezometers at Cal Rodó display a high degree of linear intercorrelation, which suggests that the groundwater response in the catchment presents a generally coherent overall behaviour (Gallart et al., in press). For this reason, data for individual piezometers were considered to be representative of the general behaviour of the phreatic surface in the surrounding area. It was, therefore, considered reasonable to compare point piezometer data against model grid estimates, despite the mismatch of scale. It should be noted that soils for the grid elements in question were simulated only to a depth of 80 cm. In most cases, the actual soil depths at the piezometers were somewhat deeper than this (up to 3 m deep). However, the available soil property data suggested that the transmissivity of the soil layer below 80 cm (i.e.
the base of the B-horizon) was minimal, and so it was decided during the parameterisation process to neglect the lower part of the soil profile.
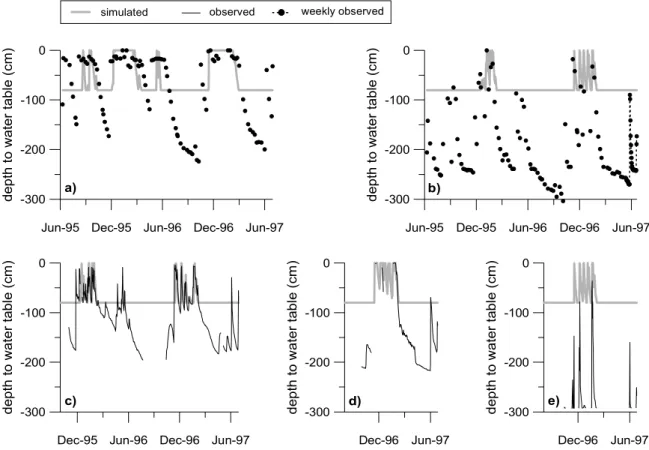
Data from five wells and piezometers were available for the comparisons (Fig. 1, Table 1). Phreatic surface level is predicted quite well by the model for the piezometers located in wetter valley floor locations for those periods when it rises to within 80 cm of the soil surface (ZI1, ZI2, ZV2, Fig. 6a, c, d). The phreatic levels at ZI2 and ZV2 are particularly well simulated, although the short length of the observed record for ZV2 makes it difficult to draw firm conclusions about model performance. The only real problem with the simulation for ZI2 was its failure to reproduce the period of high water table conditions during March 1996 (this is consistent with a tendency to under-predict overall catchment water reserve for the same period, noted above). The simulated water table response for ZI1 reproduces the observed behaviour for the main wet periods. However, the simulated water table at this site tends to rise and fall rather more rapidly than was observed in reality; it also tends to over-predict the duration of saturation at the site. The
Jan-95 Jul-95 Feb-96 Aug-96 Mar-97
0 200 400 W at er R es erv e (m m )
Jan-95 Jul-95 Feb-96 Aug-96 Mar-97
0 200 400 W ate r Re se rv e ( m m ) 100 200 300 Observed WR (mm) 100 200 300 S imu la te d WR ( m m) 100 200 Observed WR (mm) 100 200 S imu la te d W R ( m m ) y = 0.87x - 47.6 n = 100 R2 = 0.82 y = 1.17x - 52.9 n = 100 R2 = 0.80 Observed Simulated a) b) c) d)
Fig. 5. Comparison of simulated and observed catchment water reserve: (a) Cal Rodó time-series;
Jun-95 Dec-95 Jun-96 Dec-96 Jun-97 -300 -200 -100 0 dept h t o wat e r table (cm)
Jun-95 Dec-95 Jun-96 Dec-96 Jun-97 -300 -200 -100 0 dept h t o wat e r table (cm)
Dec-95 Jun-96 Dec-96 Jun-97 -300 -200 -100 0 dept h t o wat e r t a bl e (c m ) Dec-96 Jun-97 -300 -200 -100 0 dept h t o wat e r t a bl e (c m ) Dec-96 Jun-97 -300 -200 -100 0 dept h t o wat e r t a bl e (c m )
simulated observed weekly observed
a) b)
c) d) e)
Fig. 6. Comparison of simulated and observed phreatic surface level at (a) ZI1,(b) ZV1, (c) ZI2, (d) ZV2, (e) ZV3.
Refer to Figure 1 for instrumentation locations.
observed phreatic surface for the drier interfluve locations was below the base of the modelled region for most of the simulation (ZV1 and ZV3, Fig. 6b, e).
Evapotranspiration
Monthly water balances were carried out for Cal Rodó as a whole and for the Can Vila subcatchment by Gallart et al. (in press). The availability of information on changes in catchment water reserve allowed monthly estimates of total actual evapotranspiration (AE) to be derived as the residual term for the impermeable Can Vila subcatchment. Unquantified water loss through the limestone prevented a similar estimation of AE for Cal Rodó as a whole. The Can Vila AE estimate was therefore extrapolated to Cal Rodó as a whole by assuming a uniform rate of evapotranspiration loss for both catchments, and correcting the rate of interception loss for the greater extent of forest cover (60% for Cal Rodó as a whole, compared to only 34% for Can Vila). It is acknowledged that some assumptions have been made in the derivation of these estimates of AE: refer to Gallart et al. (in press) for a discussion of these issues.
However, it is thought that the water balance derived data provide a reasonable impression of the magnitude of, and seasonal variability in, evapotranspirative losses. Their use in model evaluation was therefore considered reasonable. For brevity, the water balance derived AE is hereafter referred to as the ‘observed’ AE.
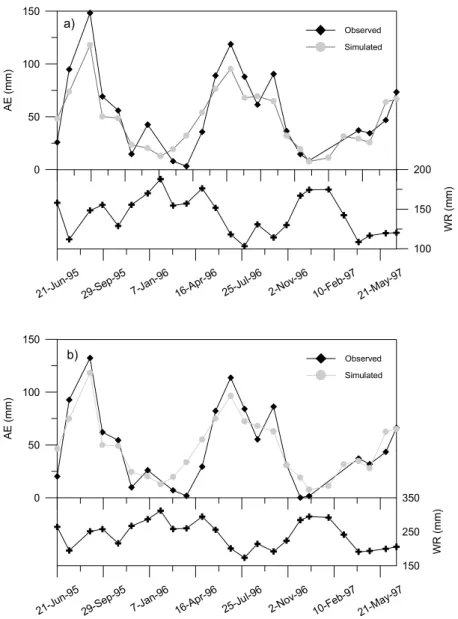
Monthly simulated and observed AE are shown in Fig. 7, together with water reserve. It may be seen that the model tends to underestimate AE during the summer months, when peak evapotranspirative demand coincides with low soil moisture reserve. AE seems to be estimated reasonably well during wet periods, when water reserve is being replenished or is already high. In contrast, AE appears to be rather overestimated during periods of declining soil moisture reserve during late winter and spring.
Examination of Fig. 7 also offers a reason why the underestimation of runoff for Can Vila seen for the evaluation period was not detected during the calibration period. The period of calibration data available for Can Vila was rather short: only 8½ months, from May 1995 to January 1996, as opposed to 17 months for Cal Rodó. It may be seen that this coincided with a period in which monthly AE
was reasonably well simulated. Significant overestimation of AE started to occur only during the evaluation period, during times of depletion of soil moisture reserve (notably in early 1996 and 1997).
Observed and simulated AE totals for the period of available data (June 1995 to June 1997 inclusive) are shown in Table 3. It may be seen that the total observed AE for Cal Rodó is somewhat higher than for Can Vila. This is the result of the assumption of higher interception losses from Cal Rodó as a whole compared to Can Vila, as a consequence of the more extensive forest cover in the former catchment. In contrast, it may be seen that the simulated AE totals for both Cal Rodó and Can Vila are very similar, and that the
21-Jun -95 29-Se p-95 7-J an-96 16-Ap r-96 25-Jul -96 2-N ov-96 10-Fe b-97 21-Ma y-97 0 50 100 150 AE (mm) 100 150 200 WR (m m ) Observed Simulated 21-Jun -95 29-Se p-95 7-J an-96 16-Ap r-96 25-Jul -96 2-N ov-96 10-Fe b-97 21-Ma y-97 0 50 100 150 AE (mm) 150 250 350 W R ( mm) Observed Simulated a) b)
Fig. 7. Comparison of monthly observed and simulated actual evapotranspiration for (a) Cal
Rodó and (b) Can Vila. The observed catchment water reserve is also shown for reference. (N.B. The ‘observed’ data were derived from the catchment water balance: those points for
which this estimate was negative have been omitted.)
Table 3. Observed and simulated actual evapotranspiration
totals, June 1995 to June 1997 inclusive
Catchment Actual evapotranspiration (mm)
Obs. Sim. Ratio Sim/Obs
Cal Rodó 1177 1162 0.99
Can Vila 1017 1169 1.15
simulated totals lie between the observed totals for the two catchments. Thus, the simulated AE totals underestimate very slightly those observed for Cal Rodó as a whole and
somewhat overestimate those observed for Can Vila (implying that there is a rather more substantial underestimation of AE for that part of Cal Rodó outside Can Vila). Decomposition of the total simulated AE into evapotranspiration and interception losses reveals why this occurred. Underestimation of hydrograph recessions and reasonably good representation of changes in WR strongly suggest that evapotranspiration is being overestimated for both catchments. However, there is also evidence that rainfall interception by the forest canopy is being underestimated. Field experiments in the area suggest that, on average, approximately 24% of the annual rainfall incident on a forest patch was intercepted (Llorens et al., 1997a). In contrast, simulated interception losses from forested grid elements amounted to only 12% of incident rainfall over the course of the entire simulation. The greater extent of forest cover in Cal Rodó compared with that in Can Vila suggests that underestimation of interception at the catchment scale was much greater for Cal Rodó as a whole than for Can Vila. Thus, the total AE for Cal Rodó appears to have been well simulated erroneously, simply as a result of compensating errors.
AQUIFER LOSSES
Simulated aquifer losses for the limestone underlain part of Cal Rodó can also be compared with water balance-derived estimates, as presented by Gallart et al. (in press). At the monthly timestep, simulated aquifer losses approximate well to those derived from water balance calculations (Fig. 8). However, the simulated total is slightly lower than the water balance-derived total over the duration of the available data, with simulated losses accounting for only 86% of the observed. This arose primarily from substantial
underestimation of the aquifer loss during April 1996 and January 1997.
Discussion
The SHETRAN model succeeded in reproducing many of the aspects of hydrological process operation in the Cal Rodó catchment reasonably well. The model captured the magnitude of runoff event peaks fairly accurately; changes in catchment-scale soil water reserve were reproduced reasonably well and the dynamics of the water table in valley floor areas were well represented. However, some aspects of simulated process operation were less satisfactory. In particular, the underestimation of hydrograph recessions was the most obvious shortcoming in model performance, and was responsible for the marked decline in efficiency values when moving from the calibration to evaluation periods. Further evaluation indicated that the underestimation of flow recessions appears to have been linked to overestimation of evapotranspiration. It appears that water that should have drained from the catchment in the days following rainfall was in fact retained in the soil profile in the simulation. However, despite this, changes in water reserve for both Cal Rodó and Can Vila were generally well simulated, at least at the weekly interval of the available data. Thus, it appears that, instead of contributing to runoff, the excess soil moisture generated by underestimation of recession flows was consumed by an overestimation of evapotranspiration from the soil profile.
There are several possible explanations for this. The first is that although the current model structure and grid resolution are appropriate, the combination of parameter values used in the soil moisture and root zone evapotranspiration models is inappropriate. However, there is also the possibility that the scale of model application is insufficient to capture important micro-scale heterogeneity in process operation in the catchments. It may be that neglecting the micro-scale spatial heterogeneity in soil moisture and runoff pathways arising from the presence of terracing as well as drainage ditches (Gallart et al., 1994) is one of the reasons for the incorrect simulation of recession flows, and the consequent over-availability of soil moisture for evapotranspiration. Finally, it may be that important processes governing runoff generation and soil moisture dynamics in the catchment are not incorporated within SHETRAN.
It is probable that a combination of all three of these issues is responsible for the observed shortcomings in model performance. The first of these issues has been explored further in a sensitivity analysis of the SHETRAN soil water model for Can Vila (Anderton et al., in press). This
21-Jun -95 29-Se p-95 7-J an-96 16-Ap r-96 25-Jul -96 2-N ov-96 10-Fe b-97 21-Ma y-97 0 40 80 A qu ife r lo ss ( mm) Observed Simulated
Fig. 8. Observed and simulated monthly aquifer losses for Cal Rodó.
(N.B. The ‘observed’ data were derived from the catchment water balance: those points for which this estimate was negative have been
demonstrated that, by changing soil hydraulic parameters within reasonable limits, a number of simulations could be produced which reproduced different aspects of the catchment response (stream hydrographs, water reserve and phreatic level). However, no one part of the parameter space yielded simulations that gave optimum results in terms of all responses. Further work is required to explore the second and third issues. In the first instance, this is likely to involve a combination of detailed field and modelling studies at the hillslope plot scale.
In contrast to the overestimation of soil evapo-transpiration, it appeared that the model was underestimating canopy interception losses for the forested areas of the catchments. This has been attributed to the imposition of an unrealistic upper limit on evaporation from canopy interception in the model. Work is ongoing to achieve a more realistic representation of both interception and evapotranspiration within the catchment model.
The information available for evaluation of the model’s representation of spatial variability was limited. Furthermore, the mismatch of scale impeded comparison of locally highly variable soil moisture measurements with grid scale results. In one case, the model was unable to distinguish between the different soil moisture conditions prevailing on the inside and outside parts of an agricultural terrace. At a second site the measurement point was located in a small forest patch which was represented as pasture in the corresponding model grid. Adoption of a finer model grid might have avoided the second problem. However, even the finest topographic data available for the catchment (a 20 m digital elevation model) was too coarse to resolve the hillslope microtopography caused by the terracing. Thus, even if the model had been parameterised at the finest spatial scale possible, the problem of terrace microtopography would have remained. A pragmatic response to this problem was to adopt a catchment scale measure of soil moisture for model evaluation. At this scale at least, the model seemed to predict changes in soil moisture fairly well for both catchments.
Phreatic surface level measurements displayed greater spatial correlation than the soil moisture data, thereby making them more suitable for comparison with grid scale model results and allowing some evaluation of simulation of spatial variability in water table response. Comparisons demonstrated that the phreatic surface level was simulated reasonably well for wetter valley bottom locations. This is, perhaps, of most importance since a large proportion of the catchment storm runoff is generated as a result of the development of saturation in these areas. However, since only the A- and B-horizons of the surface soils were simulated in the SHETRAN simulation, the dynamics of
the deeper water table at drier interfluve locations were not captured in the simulation results. Nevertheless, since runoff generation at these locations is primarily the result of ephemeral perched water table formation, the omission of the deeper saturated zone is not thought to be important from the runoff generation point of view.
Conclusions
The catchment model presented in this paper provided good results when judged in terms of catchment discharges for an initial calibration period. However, model performance for discharge declined quite dramatically when evaluated against a consecutive, rather drier, period of data. As discussed above, model evaluation against data from other hydrological responses in the catchment has identified the reasons for this decline in performance.
Given the results presented here, it is argued that model evaluation using the catchment scale water balance can be a useful tool for model calibration and validation, even for distributed models. This is because deficiencies in the simulation of the catchment water balance can be related to specific problems with process representation in the model. The utility of this technique can be enhanced if water balances can be constructed for subcatchments with contrasting physical characteristics. In this case, it was possible to isolate the Can Vila subcatchment, which has rather different proportions of the main land use and soil types than those found in Cal Rodó as a whole. This was particularly useful in demonstrating that the apparently good simulation of overall actual evapotranspiration for Cal Rodó was, in fact, the result of compensating errors in the simulation of canopy interception and evapotranspiration. It is suggested that catchment scale evaluation of models could be extended profitably through the use of isotopic hydrograph separation techniques (e.g. Güntner et al., 1999). This might further restrict the degrees of freedom in model parameterisation through providing estimates of the relative importance of different runoff components, against which model performance could be evaluated.
It is acknowledged that the point soil moisture and phreatic surface level data available in this study permitted only a limited evaluation of the representation of spatial variability by the model. This was the result of the relative sparseness of measurements and, for soil moisture especially, problems associated with the mismatch between measurement and model grid scales. However, by the standards of most catchments, Cal Rodó is an extremely data-rich environment, and the collection and processing of the data presented here has proved to be a formidable task. Collection of soil moisture and phreatic level data at a spatial resolution
appropriate for comprehensive evaluation of distributed models like SHETRAN is likely to be prohibitively expensive, even for small catchments like Cal Rodó. Furthermore, even if this were possible practically, issues like the mismatch of scale and the impossibility of uniquely parameterising every cell in the catchment model (Beven, 2000) would continue to hinder comparison of observed and simulated data. Nevertheless, the work presented here has shown that these problems can be minimised to some extent through spatial aggregation of data (as with soil moisture), and through the use of point measurements that display good spatial correlation (as with phreatic surface level). Recent studies incorporating model evaluation based on the spatial patterns may also provide a way forward in respect of the validation of process representation in distributed models (e.g. Franks et al., 1998; Güntner et al., 1999).
Acknowledgements
This work was carried out as part of project VAHMPIRE (Validating Hydrological Models using Process Studies and Internal Data from Research Basins: tools for assessing the hydrological impacts of environmental change), which was funded by the European Commission Framework IV Environment and Climate Program (Contract No. ENV4-CT95-0134).
Simulations were carried out on a UNIX workstation funded jointly by UK Nirex Ltd. and NERC grant GR3/ E0009.
The authors would like to thank the three anonymous reviewers, whose comments helped to improve the final version of this manuscript.
References
Abbott, M.B., Bathurst, J.C., Cunge, J.A., O’Connell, P.E. and Rasmussen, J., 1986a. An introduction to the European Hydrological System - Système Hydrologique Européen, ‘SHE’, 1: history and philosophy of a physically-based, distributed modelling system. J. Hydrol., 87, 45–59.
Abbott, M.B., Bathurst, J.C., Cunge, J.A., O’Connell, P.E. and Rasmussen, J., 1986b. An introduction to the European Hydrological System - Système Hydrologique Européen, ‘SHE’, 2: structure of a physically-based, distributed modelling system.
J. Hydrol., 87, 61–77.
Ambroise, B., Perrin, J.L. and Reutenauer, D., 1995. Multicriterion validation of a semidistributed conceptual model of the water cycle in the Fecht catchment (Vosges Massif, France). Water
Resour. Res., 31, 1467–1481.
Anderton, S.P., Latron, J. and Gallart, F., in press. Sensitivity analysis and multi-response, multi-criteria evaluation of a physically-based distributed model. Hydrol. Process.
Balasch, J.C., Castelltort, X., Llorens, P. and Gallart, F., 1992. Hydrological and sediment dynamics network design in a Mediterranean mountainous area subject to gully erosion. In:
Erosion and Transport Monitoring Programmes in River Basins,
J. Bogen, D.E. Walling and T. Day (Eds.), IAHS Publ. No. 210, 433–442.
Beven, K.J., 1989. Changing ideas in hydrology — the case of physically-based models. J. Hydrol., 105, 157–172.
Beven, K.J., 1993. Prophecy, reality and uncertainty in distributed hydrological modelling. Adv. Water Resour., 16, 41–51. Beven, K.J., 1996. The limits of splitting: hydrology. Sci. Total
Environ., 183, 89–97.
Beven, K.J., 2000. Uniqueness of place and process representations in hydrological modelling. Hydrol. Earth Syst. Sci., 4, 203– 213.
Beven, K.J., 2001. How far can we go in distributed hydrological modelling? Hydrol. Earth Syst. Sci., 5, 1–12.
Chow, V.T., 1959. Open Channel Hydraulics. McGraw Hill, New York, USA, 680 pp.
Duan, Q., Gupta, V.K. and Sorooshian, S., 1993. Effective and efficient global optimization for conceptual rainfall-runoff models. Water Resour. Res., 28, 1015–1031.
Dunn, S.M. and Mackay, R., 1995. Spatial variation in evapotranspiration and the influence of land use on catchment hydrology. J. Hydrol., 171, 49–73.
Dunne, T., 1983. Relation of field studies and modelling in the prediction of storm runoff. J. Hydrol., 65, 25–48.
Ewen, J., 1995. Contaminant transport component of the catchment modelling system SHETRAN. In: Solute Modelling in
Catchment Systems, S.T. Trudgill (Ed.), Wiley, Chichester, UK,
417–441.
Ewen, J., Parkin, G. and O’Connell, P.E., 2000. SHETRAN: a coupled surface / subsurface modelling system for 3D water flow and sediment and solute transport in river basins. J. Hydrol.
Eng. ASCE, 5, 250–258.
Feddes, R.A., Kowalik, P., Neuman, S.P. and Bresler, E., 1976. Finite difference and finite element simulation of field water uptake by plants. Hydrol. Sci. Bull., 21, 81–98.
Ford, D.C. and Williams, P.W., 1989. Karst Geomorphology and
Hydrology. Unwin Hyman, London, UK, 601 pp.
Franks, S.W., Gineste, P., Beven, K.J. and Merot P., 1998. On constraining the predictions of a distributed model: The incorporation of fuzzy estimates of saturated areas into the calibration process. Water Resour. Res., 34, 787–797. Gallart, F., Llorens, P. and Latron, J., 1994. Studying the role of
old agricultural terraces on runoff generation in a Mediterranean mountainous basin. J. Hydrol., 159, 291–303.
Gallart, F., Latron, J., Llorens, P. and Rabadà, D., 1997. Hydrological functioning of Mediterranean mountain basins in Vallcebre, Catalonia: some challenges for hydrological modelling. Hydrol. Process., 11, 1263–1272.
Gallart, F., Latron, J. and Regüés, D., 1998. Hydrological and erosion processes in the research catchments of Vallcebre (Pyrenees). In: Modelling Soil Erosion by Water, J. Boardman and D. Favis-Mortlock (eds.), Springer, Berlin-Heidelberg, Germany, 503-511.
Gallart, F., Latron, J., Llorens, P., Salvany, C., Josa, R., Anderton, S.P. and White, S.M., in press. Analysis of the hydrological functioning of a Mediterranean mountain catchment through monitoring of internal dynamics. J. Hydrol.
Grayson, R.B., Moore, I.D. and McMahon, T.A., 1992a. Physically based hydrologic modelling 1. A terrain-based model for investigative purposes. Water Resour. Res., 28, 2639–2658. Grayson, R.B., Moore, I.D. and McMahon, T.A., 1992b.
Physically based hydrologic modeling 2. Is the concept realistic?
Güntner, A., Uhlenbrook, S., Seibert, J. and Leibundgut, C., 1999. Multi-criterial validation of TOPMODEL in a mountainous catchment. Hydrol. Process., 13, 1603–1620.
Klemeš, V., 1986. Operational testing of hydrological simulation models. Hydrol. Sci. J., 31, 13–24.
Kuczera, G. and Mroczkowski, M., 1998. Assessment of hydrologic parameter uncertainty and the worth of multiresponse data. Water Resour. Res., 34, 1481–1489.
Lamb, R., Beven, K. and Myrabo, S., 1998. Use of spatially distributed water table observations to constrain uncertainty in a rainfall-runoff model. Adv. Water Resour., 22, 305–317. Latron, J., Llorens, P. and Gallart, F., 1997. Studying spatial and
temporal patterns of runoff generation processes in a mountain Mediterranean basin (Vallcebre, Catalonia). In: Ecohydrological
Processes in Small Basins, D. Viville and I. Littlewood
(Eds.),IHP-V Technical Documents in Hydrology, 14, UNESCO, Paris, France, p. 1–5.
Llorens, P., 1997. Rainfall Interception by a Pinus sylvestris forest patch overgrown in a Mediterranean mountainous abandoned area II. Assessment of the applicability of Gash’s analytical model. J. Hydrol., 199, 346–359.
Llorens, P. and Gallart F., 1992. Small basin response in a Mediterranean mountainous abandoned farming area: research design and preliminary results. Catena, 19, 309–320. Llorens, P., Poch, R., Latron, J. and Gallart, F., 1997a. Rainfall
Interception by a Pinus sylvestris forest patch overgrown in a Mediterranean mountainous abandoned area I. Monitoring design and results down to the event scale. J. Hydrol., 199, 331–345.
Llorens, P., Queralt, I., Plana, F. and Gallart, F., 1997b. Studying solute and particulate sediment transfer in a small mediterranean mountainous catchment subject to land abandonment. Earth
Surf. Process. Landf, 22, 1027–1035.
Nash, J.E. and Sutcliffe, J.V., 1970. River flow forecasting through conceptual models. J. Hydrol., 10, 282–290.
O’Connell, P. E. and Todini, E., 1996. Modelling of rainfall, flow and mass transport in hydrological systems: an overview. J.
Hydrol., 175, 3-16.
Oreskes, N., Shrader-Frechette, K. and Belitz, K., 1994. Verification, validation, and confirmation of numerical models in the earth sciences. Science, 263, 641-646.
Parkin, G., 1996. A three-dimensional variably-saturated
subsurface modelling system for river basins. PhD Thesis,
Department of Civil Engineering, University of Newcastle upon Tyne, UK.
Parkin, G., O’Donnell, G., Ewen, J., Bathurst, J.C., O’Connell, P. E. and Lavabre, J., 1996. Validation of catchment models for predicting land-use and climate change impacts. 2. Case study for a Mediterranean catchment. J. Hydrol., 175, 595-613. Refsgaard, J. C., 1997. Parameterisation, calibration and validation
of distributed hydrological models. J. Hydrol., 198, 69-97. Refsgaard, J. C. and Storm, B., 1996. Construction, calibration
and validation of hydrological models. In: Distributed
Hydrological Modelling, M.B. Abbott and J.C. Refsgaard (Eds.),
Kluwer Academic, Dordrecht, Netherlands. 41–54.
Regüés, D., Pardini, G. and Gallart, F., 1995. Regolith behaviour and physical weathering of clayey mudrock as dependent on seasonal weather conditions in a badland area at Vallcebre, Eastern Pyrenees, Catena, 25, 199–212.
Regüés, D., Guàrdia, R. and Gallart, F., 2000. Geomorphic agents versus vegetation spreading as causes of badland occurrence and evolution in a Mediterranean humid mountainous area.
Catena, 40, 173–187.
Rutter, A.J., Kershaw, K.A., Robins, P.C. and Morton, A.J., 1971. A predictive model of rainfall interception in forests, 1. Derivation of the model from observations in a plantation of Corsican pine. Agr. Meteorol., 9, 267–384.
Rutter, A.J., Robins, P.C. and Morton, A.J., 1975. A predictive model of rainfall interception in forests, 2. Generalisation of the model and comparison in some coniferous and hardwood stands. J. Appl. Ecol., 12, 367–380.
Saxton, K.E., Rawls, W.J., Romberger, J.S. and Papendick, R.I., 1986. Estimating generalised soil-water characteristics from texture. Soil Sci. Soc. Amer. J., 50, 1031–1036.
Sorooshian, S.M. and Gupta, V.K., 1983. Automatic calibration of conceptual rainfall-runoff models: the question of parameter observability and uniqueness. Water Resour. Res., 19, 487–495. van Genuchten, M.T., 1980. A closed-form equation for predicting the hydraulic conductivity of unsaturated soils. Soil Sci. Soc.
Amer. J., 44, 892–898.
Vertessy, R.A. and Elsenbeer, H., 1999. Distributed modeling of storm flow generation in an Amazonian rain forest catchment: Effects of model parameterisation. Water Resour. Res., 35, 2173–2187.
Wicks, J.M., 1988. Physically-based mathematical modelling of
catchment sediment yield. PhD Thesis, Department of Civil