HAL Id: hal-00303286
https://hal.archives-ouvertes.fr/hal-00303286
Submitted on 6 Feb 2008HAL is a multi-disciplinary open access
archive for the deposit and dissemination of sci-entific research documents, whether they are pub-lished or not. The documents may come from teaching and research institutions in France or abroad, or from public or private research centers.
L’archive ouverte pluridisciplinaire HAL, est destinée au dépôt et à la diffusion de documents scientifiques de niveau recherche, publiés ou non, émanant des établissements d’enseignement et de recherche français ou étrangers, des laboratoires publics ou privés.
Intercomparison of erythemal broadband radiometers
calibrated by seven UV calibration facilities in Europe
and the USA
G. Hülsen, J. Gröbner, A. Bais, M. Blumthaler, P. Disterhoft, B. Johnsen, K.
O. Lantz, C. Meleti, J. Schreder, J. M. Vilaplana Guerrero, et al.
To cite this version:
G. Hülsen, J. Gröbner, A. Bais, M. Blumthaler, P. Disterhoft, et al.. Intercomparison of erythemal broadband radiometers calibrated by seven UV calibration facilities in Europe and the USA. Atmo-spheric Chemistry and Physics Discussions, European Geosciences Union, 2008, 8 (1), pp.2249-2273. �hal-00303286�
ACPD
8, 2249–2273, 2008 Comparison of UV calibration facilities Title Page Abstract Introduction Conclusions References Tables Figures ◭ ◮ ◭ ◮ Back Close Full Screen / EscPrinter-friendly Version Interactive Discussion
EGU
Atmos. Chem. Phys. Discuss., 8, 2249–2273, 2008 www.atmos-chem-phys-discuss.net/8/2249/2008/ © Author(s) 2008. This work is licensed
under a Creative Commons License.
Atmospheric Chemistry and Physics Discussions
Intercomparison of erythemal broadband
radiometers calibrated by seven UV
calibration facilities in Europe and the
USA
G. H ¨ulsen1, J. Gr ¨obner1, A. Bais2, M. Blumthaler3, P. Disterhoft4, B. Johnsen5,
K. O. Lantz4, C. Meleti2, J. Schreder6, J. M. Vilaplana Guerrero7, L. Ylianttila8
1
Physikalisch-Meteorologisches Observatorium Davos / World Radiation Center, Dorfstrasse 30, 7278 Davos Dorf, Switzerland
2
Aristotle University of Thessaloniki, Laboratory of Atmospheric Physics, Campus Box 149, 541 24 Thessaloniki, Greece
3
Innsbruck Medical University, Division for Biomedical Physics, M ¨ullerstr. 44, 6020 Innsbruck, Austria
4
National Oceanic and Atmospheric Administration, Central UV Calibration Facility, 325 Broadway, 80305 Boulder, CO, USA
5
Norwegian Radiation Protection Authority, Grini Naeringspark 13, 1361 Osteras, Norway
6
ACPD
8, 2249–2273, 2008 Comparison of UV calibration facilities Title Page Abstract Introduction Conclusions References Tables Figures ◭ ◮ ◭ ◮ Back Close Full Screen / EscPrinter-friendly Version Interactive Discussion
EGU
7
Instituto Nacional de T ´ecnica Aerospacial, Estaci ´on de Sondeos Atmosf ´ericos El Arenosillo, 21130 Mazagon, Spain
8
STUK, Radiation and Nuclear Safety Authority, Non-Ionizing Radiation Laboratory, P.O. Box 14, 00881 Helsinki, Finland
Received: 7 December 2007 – Accepted: 3 January 2007 – Published: Correspondence to: G. H ¨ulsen ([email protected])
Abstract
A bi-lateral intercomparison of erythemal broadband radiometers was performed be-tween seven UV calibration facilities. The owners calibrations were compared relative to the characterisation and calibration performed at PMOD/WRC in Davos, Switzer-land. The calibration consisted in the determination of the spectral and angular
re-5
sponse of the radiometer, followed by an absolute calibration performed outdoors rela-tive to a spectroradiometer which provided the absolute reference.
The characterization of the detectors in the respective laboratories are in good agree-ment: The determination of the angular responses have deviations below ±4% and the spectral responses agree within ±20%. A “blind” intercomparison of the erythemally
10
weighted irradiances derived by the respective institutes and PMOD/WRC showed con-sistent measurements to within ±2% for the majority of institutes. One institute showed slightly larger deviation of 10%. The differences found between the different instrument calibrations are all within the combined uncertainty of the calibration.
ACPD
8, 2249–2273, 2008 Comparison of UV calibration facilities Title Page Abstract Introduction Conclusions References Tables Figures ◭ ◮ ◭ ◮ Back Close Full Screen / EscPrinter-friendly Version Interactive Discussion
EGU
1 Introduction
Routine measurements of solar ultraviolet (UV) radiation are often performed with UV broadband radiometers due to their simple operational requirements. Even though the operation of these radiometers is straightforward (they require only a power supply and a voltmeter), the relationship between the raw signal and the desired UV radiation
5
product is complex and requires an elaborate characterization and calibration proce-dure for each individual broadband radiometer (Lantz et al.,1999;Leszczynski et al.,
1998;H ¨ulsen and Gr ¨obner,2007).
Here, we will compare the calibrations of six broadband radiometers performed by 6 UV calibration facilities (UVCF) in Europe and the United States with the calibration
10
performed by the European reference UV calibration facility of the PMOD/WRC (see Table1). This exercise was part of a large-scale intercomparison and calibration cam-paign organized within the COST726 activities and hosted by PMOD/WRC in August 2006 (Gr ¨obner et al.,2007).
The comparisons were organized as “blind comparisons”, i.e. the results were only
15
communicated to the participants at the end of the measurement campaign when all the data was delivered to PMOD/WRC. The calibration comparison results will be pre-sented as bi-lateral comparisons between the owners institute and PMOD/WRC and therefore allow a cross-comparison between the institutes using PMOD/WRC as trans-fer standard.
20
It is the first time that such a large-scale intercomparison of UV calibration facil-ities has been performed. The results of this study show the level of consistency currently achievable in the calibration of broadband UV radiometers measuring ery-themally weighted UV radiation by different laboratories. This effort fits within the de-clared goal of the WMO-GAW strategic plan 2008–2015 to link UV calibration services
25
ACPD
8, 2249–2273, 2008 Comparison of UV calibration facilities Title Page Abstract Introduction Conclusions References Tables Figures ◭ ◮ ◭ ◮ Back Close Full Screen / EscPrinter-friendly Version Interactive Discussion
EGU
2 Methods
UV broadband radiometers are designed for measuring the incoming irradiance weighted with a specific spectral responsivity, e.g. the action spectrum for ultraviolet induced erythema (McKinlay and Diffey,1987;ISO,1999). The output signal of these instruments depends therefore on the intensity of the receiving radiation and on its
5
spectral shape. The knowledge about the detector spectral responsivity is an impor-tant step in the calibration procedure. As this function differs from the nominal action spectrum, a suitable conversion is required to convert from the detector weighted radi-ation to the one representative for the desired weighting.
A second requirement for such instruments is the weighting of the radiation with
10
the cosine of the incoming angle relative to normal incidence. This ideal case can be fulfilled only to a certain degree by the input optics of the detector. In the UV wavelength range the resulting deviation depends strongly on the solar zenith angle and also on the atmospheric situation, because the ratio of the direct unscattered solar radiation to the diffuse radiation changes considerably during the day.
15
To account for the intrinsic properties of broadband detectors the calibration proce-dure includes three steps. First, the spectral response function (SRF) is determined. Second, the angular response function (ARF) is measured in the laboratory. Third, the absolute calibration factor of the radiometer is derived from a direct comparison to a reference instrument. This calibration method is described inH ¨ulsen and Gr ¨obner
20
(2007).
2.1 The COST726 campaign
During the PMOD/WRC-COST726 characterisation and calibration campaign (Gr ¨obner
et al.,2007), a total of 36 UV broadband radiometers where calibrated at PMOD/WRC, from 30 July to 25 August 2006.
25
Six of these detectors belong to UVCF’s as listed in Table 1. These radiometers were characterized and calibrated at their home institute prior to the COST726
cam-ACPD
8, 2249–2273, 2008 Comparison of UV calibration facilities Title Page Abstract Introduction Conclusions References Tables Figures ◭ ◮ ◭ ◮ Back Close Full Screen / EscPrinter-friendly Version Interactive Discussion
EGU
paign. This allowed first the intercomparison of the laboratory measurements (SRF and ARF) and secondly to compare the absolute calibration factors of the instruments. The unprocessed (raw) data of the instruments, obtained during the outdoor calibration period at PMOD/WRC, were sent to the respective home institutes. There the raw data were converted to erythemally weighted irradiances using the owners specific
conver-5
sion procedures. From this processed data a ’blind’ intercomparison relative to the PMOD/WRC calibration was performed.
2.2 Laboratory characterization
The relative spectral response facility in use at the seven UVCF’s is quite similar and essentially consists of a single or double monochromator which produces a nearly
10
monochromatic beam of radiation which irradiates the radiometer. The spectral re-sponsivity of the radiometer is retrieved by adjusting the monochromator to successive wavelengths between about 270 and 400 nm. The width of the monochromator output slitfunction is a compromise between the output intensity and the wavelength resolution of the system.
15
For the measurement of the angular response function the radiometer is mounted on a goniometer. The detector sensor is illuminated by a radiation source which is mounted at a distance of at least 1 m from the goniometer. Either a high intensity Xenon or tungsten-halogen lamp is used.
2.3 Absolute calibration
20
When the radiometer is used for measuring erythemally weighted solar irradiance, the best radiation source for the absolute calibration is the sun, because the detector output signal depends significantly on the spectral shape of the receiving radiation.
The instrument of choice for the measurement of absolute spectral solar radiation is a well characterized spectroradiometer which is installed in close proximity to the
25
ACPD
8, 2249–2273, 2008 Comparison of UV calibration facilities Title Page Abstract Introduction Conclusions References Tables Figures ◭ ◮ ◭ ◮ Back Close Full Screen / EscPrinter-friendly Version Interactive Discussion
EGU
reference instrument, which represents the European reference for spectral solar UV irradiance (Gr ¨obner et al.,2005;Gr ¨obner and Sperfeld,2005;Gr ¨obner et al.,2006).
During the outdoor calibration period the reference and the broadband instruments measure simultaneously the solar radiation continuously for several days. From this dataset the sensitivity of the radiometer is retrieved following a calibration procedure
5
outlined in the following section.
2.4 Determination of the calibration factors and functions
The first step of the calibration is the determination of a conversion function, f , to convert the detector weighted solar irradiance to erythemally weighted irradiance. It is defined as:
10
f (SZA, TO3) = R
CIE(λ)Erad(SZA, TO3, λ)d λ R
SRF(λ)Erad(SZA, TO3, λ)d λ , (1)
where Erad represents solar spectra calculated with a radiative transfer model for dif-ferent solar zenith angles (SZA) and total ozone column (TO3) (Lantz et al., 1999;
Leszczynski et al.,1998). The SRF is obtained from the laboratory measurement
de-scribed in section 2.2 and CIE represents the erythemal action spectrum (McKinlay
15
and Diffey,1987;ISO,1999).
Most UVCF’s use the libradtran package (Mayer and Kylling,2005) or similar models to calculate the simulated solar spectra. The input parameters vary depending on the actual installation place of the radiometer. However, the variation of these parameters have only an effect smaller than 1% on the variability of f (H ¨ulsen and Gr ¨obner,2007).
20
Any deviations of the angular response of the detector entrance optic from the nom-inal cosine response will result in systematic measurement errors depending on the current atmospheric conditions. This error is usually called cosine error and can be partially corrected using the methodology described inGr ¨obner et al.(1996);Bais et al.
(1998).
ACPD
8, 2249–2273, 2008 Comparison of UV calibration facilities Title Page Abstract Introduction Conclusions References Tables Figures ◭ ◮ ◭ ◮ Back Close Full Screen / EscPrinter-friendly Version Interactive Discussion
EGU
The cosine error of an instrument depends on the radiance distribution of the incident radiation which is usually separated into the direct and diffuse radiation component, Edir and Edif. The standard procedure to correct for a detector cosine error is based on the following equations:
Coscor= 1
fglo , (2)
5
fglo=fdirEdir
Eglo+fdif Edif
Eglo , (3)
where fglo is the global cosine error and Eglo is the sum of Edir and Edif; fdir represents the direct cosine error which is equal to the ARF obtained in the laboratory divided by the cosine of the zenith angle and fdif is called the diffuse cosine error and is here calculated by assuming a homogeneous radiance distribution integrated over the whole
10 hemisphere, fdif=2 · Z π 2 0 ARF(Θ) sin(Θ)d Θ . (4)
The direct and diffuse radiation components Edir and Edif are usually estimated by radiative transfer calculations as done by CUCF, INTA, NRPA and PMOD/WRC. An-other approach is to implicitly include an average cosine error of the radiometer into its
15
absolute calibration by retrieving an absolute calibration as a function of SZA. This is the method used by LAP, UIIMP and STUK.
To calculate the erythema weighted irradiance from the raw data of a broadband radiometer the following equation is used (Webb et al.,2006):
ECIE= (U−Uoffset) · C · fn(SZA, TO3) · Coscor, (5)
20
where U and Uoffset are the raw and dark signal respectively and C represents the absolute calibration factor. The conversion function fnis calculated according to Eq.1
ACPD
8, 2249–2273, 2008 Comparison of UV calibration facilities Title Page Abstract Introduction Conclusions References Tables Figures ◭ ◮ ◭ ◮ Back Close Full Screen / EscPrinter-friendly Version Interactive Discussion
EGU
and is normalized to its value f0at SZA=40◦and TO
3=300 DU. If the cosine error of the instrument is explicitly taken into account, it is corrected by the Coscor-function (Eq.2, CUCF, INTA, NRPA, PMOD/WRC), otherwise it is set to unity (LAP, UIIMP, STUK).
The dark signal Uoffset is obtained from the average of a large number of nighttime readings of the radiometer. The calibration factor C is calculated for each solar
irradi-5
ance scan by the comparison of the SRF-weighted solar spectrum measurement ED with the average radiometer signal UD:
C= ED UD−Uoffset · 1 Coscor· 1 f0 , (6)
The retrieved calibration factor C should be the same under all atmospheric conditions and for all radiation spectra. If any significant variability of C is observed (for example
10
depending on SZA) this would indicate a mismatch of the measured SRF and ARF with the radiometer characteristics at the time of the solar measurements, or an inadequate cosine correction.
The final absolute calibration factor is obtained as the average of all measurements satisfying a pre-defined set of criteria, e.g. at this campaign for measurement conditions
15
without precipitation and SZA smaller than 75◦. 2.5 Deviations from Equation5
– CUCF: the calibration is performed not for a single radiometer relative to the
ref-erence instrument but for a radiometer triad. The absolute calibration factor is therefore the mean of the triad and an additional scaling factor is needed.
20
– UIIMP: an average cosine correction is already included in the conversion function
(Coscor=1); the conversion function is not normalized.
– LAP – as UIIMP: an average cosine correction is already included in the
ACPD
8, 2249–2273, 2008 Comparison of UV calibration facilities Title Page Abstract Introduction Conclusions References Tables Figures ◭ ◮ ◭ ◮ Back Close Full Screen / EscPrinter-friendly Version Interactive Discussion
EGU
– STUK: only a single absolute calibration factor is used to convert the raw data to
erythema weighted irradiance (Coscor=1, fn=1).
– INTA: an average cosine correction is already included in the conversion function
(Coscor=1).
3 Results
5
The intercomparison of the UVCF’s was accomplished through bilateral comparisons between the originating UVCF calibration and the PMOD/WRC calibration for the re-spective radiometer of each UVCF. Thus, even though there was no direct comparison between each UVCF, PMOD/WRC acted as the pilot laboratory and through its perfor-mance all UVCF’s can be related to each other. In the following section, the outdoor
10
measurements of each radiometer, processed by the respective UVCF, will be com-pared to the PMOD/WRC processed data and analysed with respect to the laboratory characterisations done at both laboratories. Thus, the consistency of the whole cali-bration chain of a UV broadband radiometer will be investigated and discussed. 3.1 Laboratory characterization
15
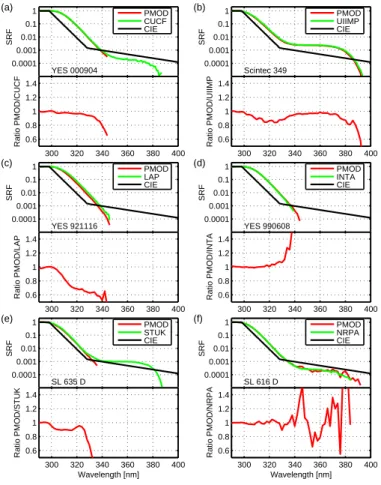
3.1.1 Spectral Response Function
The responsivities of the UV broadband radiometers investigated in this study span about 3 orders of magnitude over a 40 nm region, between their maximum at about 297 nm to the low sensitivity plateau starting at around 340 nm, similarly to the defi-nition of the CIE erythemal action spectrum. Errors in the wavelength calibration and
20
the determination of the spectral transmission function of the monochromatic source introduce therefore significant discrepancies in the derived spectral response function of the test radiometer.
ACPD
8, 2249–2273, 2008 Comparison of UV calibration facilities Title Page Abstract Introduction Conclusions References Tables Figures ◭ ◮ ◭ ◮ Back Close Full Screen / EscPrinter-friendly Version Interactive Discussion
EGU
Figure1shows the SRF as derived by PMOD/WRC and the owners institute for each radiometer and the ratio in the corresponding lower figures. The agreement between the measurements is fairly consistent in the shorter wavelength range, up to about 340 nm, with deviations not exceeding ±20% for most institutes. Larger deviations are only found with two institutes. The large sensitivity gradient between about 300 and
5
340 nm is reproduced faithfully by all institutes. Measurements in that wavelength range are strongly influenced by the resolutions of the respective monochromatic sources, and observed deviations between institutes, such as between UIIMP and PMOD/WRC for example, can be explained by this effect (Schreder et al.,2004).
At wavelengths longer than approx. 340 nm the measurement of the SRF becomes
10
difficult due to the low signal of the radiometer and the correspondingly high noise level of the measurements. This is the reason for the limited extent of the SRF measure-ments for some radiometers, particularly the YES UVB-1 radiometers which have an unusually high noise level which limit the SRF measurement to about 340 nm. However, improvements to the spectral response bench at CUCF have allowed better
measure-15
ments in the tail region of the SRF of the YES UVB 000904 (Fig.1a). For the Solar Light 501 digital radiometers the limitation comes from the low resolution of the digital recorders manufactured by Solar Light. This can be overcome by sampling the out-put signal by a custom made readout electronic, as was done at STUK (Fig.1e). The SRF of the Solar Light 616 from NRPA could be obtained at PMOD/WRC and NRPA
20
with a good agreement (Fig. 1f); nevertheless the SRF measurement performed at PMOD/WRC shows slightly higher noise in the UVA range which could be improved by increasing the sampling time at each wavelength step.
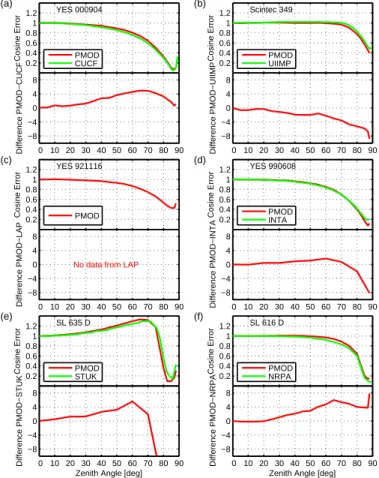
3.1.2 Angular Response
Figure2 shows the cosine errors derived from the measured ARF’s. The differences
25
between the measurement performed at PMOD/WRC and the owners institute is below ±4% for zenith angle less than 75◦. This result shows that the angular response can be measured with high accuracy by different laboratories.
ACPD
8, 2249–2273, 2008 Comparison of UV calibration facilities Title Page Abstract Introduction Conclusions References Tables Figures ◭ ◮ ◭ ◮ Back Close Full Screen / EscPrinter-friendly Version Interactive Discussion
EGU
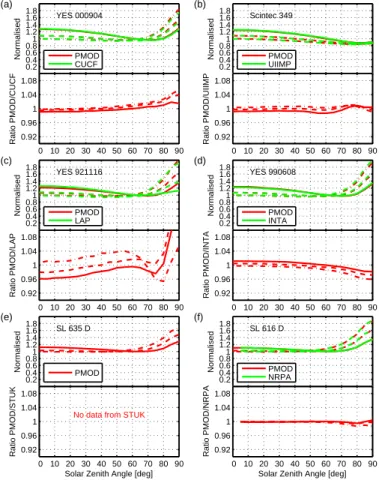
3.1.3 Derived conversion and cosine correction functions
Figure 3 shows the conversion functions f as derived from the SRF measurements (Fig.1) using Eq.1. For the calculation missing data of the SRF must be extrapolated to fill the full UV wavelength range. But although each institute used a different extrap-olation, the resulting conversion functions are nearly identical. The good agreement
5
of f between the institutes and PMOD/WRC also underlines the fact that the choice of parameters to calculate the spectra (Erad in Eq. 1) used to derive f do not introduce any significant discrepancies in the determination of f .
For most conversion functions the ratio between PMOD/WRC and the owners cal-culation are within ±2%. The observed differences in the SRF measurements, as
dis-10
cussed in the previous section are therefore not significant. This is not the case for the conversion function of the YES 921116 from LAP where a significant difference with the PMOD/WRC can be seen (Fig.3c). The deviations exceed ±4% for higher SZA and the functions differ by more than 5% for TO3 values between 200 and 400 DU. These differences were traced to the different determinations of the respective SRF
measure-15
ments of both institutes as could be verified by using the same radiative transfer model spectra to derive f .
The cosine correction functions for nominal diffuse and clear sky were derived from the angular response functions (Fig. 2) using Eqs. 2 to4. The diffuse and clear sky cosine errors are shown in respectively Table2and Table3. The differences between
20
the owners institutes and PMOD/WRC are usually below ±3%, which indicates that the methods used to derive the cosine correction functions from the ARF measurements were consistent between all institutes.
3.2 Absolute calibration factor
The absolute calibration factors C derived from the outdoor measurement campaign
25
are given in Table 4. As some institutes (UIIMP, LAP and STUK) did not explicitly correct C with the cosine error of their radiometer (Eq. 5), the comparison of these
ACPD
8, 2249–2273, 2008 Comparison of UV calibration facilities Title Page Abstract Introduction Conclusions References Tables Figures ◭ ◮ ◭ ◮ Back Close Full Screen / EscPrinter-friendly Version Interactive Discussion
EGU
derived calibration factors are affected by the cosine errors of the radiometers. So as to provide a meaningful comparison in these cases, the listed values of C correspond to the absolute calibration factors corrected by the clear sky cosine correction factor derived by PMOD/WRC. It should be noted that this procedure introduces systematic differences in the derivation of C due to the differences between the theoretical clear
5
sky cosine correction and the average cosine error of the radiometer which will depend on the atmospheric conditions during the calibration period at the respective UVCF’s. Nevertheless an excellent agreement of the order of ±2% could be found between the majority of calibration facilities which is very satisfying considering the difficulties in measuring accurately global spectral solar irradiance.
10
The deviation of approx. 4% found between LAP and PMOD/WRC can be attributed to differences in the absolute calibrations of the reference spectroradiometers used to measure the reference solar spectra. This was verified during a QASUME quality
as-surance site audit in 2002 were a mean spectral difference of 3.8% between the spec-trophotometer of LAP (Brewer #086 – GRT) and QASUMEwas found (Gr ¨obner et al.,
15
2003). In the case of STUK, the large deviation of approx. 8% is so far unexplained. 3.3 Intercomparison of erythemally weighted Irradiances
The calibration factors and correction functions introduced previously were used to con-vert the raw data of the radiometers to erythemally weighted irradiance using Eq.5(or the corresponding equation used by the respective UVCF). The raw data was sent to
20
each UVCF to be processed using their own calibration procedures; the processed data was then forwared to PMOD/WRC which performed the comparison with the PMOD/WRC derived values. This intercomparison was ”blind” in the sense that no information was exchanged between the institutes prior to the comparison performed by PMOD/WRC. Any later submission of newly processed data was labeled as revised
25
and required a detailed explanation by the corresponding institute. Only LAP submit-ted a revised data set due to the discovery of a software error in their processing chain
ACPD
8, 2249–2273, 2008 Comparison of UV calibration facilities Title Page Abstract Introduction Conclusions References Tables Figures ◭ ◮ ◭ ◮ Back Close Full Screen / EscPrinter-friendly Version Interactive Discussion
EGU
The results are summarized in Fig.4and the mean ratios to the reference spectro-radiometer QASUME are listed in Table 5. These final results show that the
erythe-mally weighted irradiances derived by the majority of UVCF’s are consistent to within ±2%. The variability between the radiometers and the QASUME reference
spectrora-diometer can be largely attributed to the challenging meteorological conditions of the
5
campaign, which consisted of only one and a half clear sky days, while the most part of the campaign was either fully overcast or with rapidly changing cloud conditions. The latter introduced a large variability in these radiometers having a large cosine er-ror since these days were treated as diffuse in terms of the applied cosine correction even though clear sky periods (solar disk free of clouds) alternated with overcast
con-10
ditions. As discussed inH ¨ulsen and Gr ¨obner(2007) this can lead to variabilities of up to ±7.2% for radiometers with a large cosine error such as the YES radiometers. This is confirmed by the lower variabilities of the Scintec radiometer which has a very low cosine error compared to the other radiometers in this study.
Neglecting the cosine correction in Eq. 5 leads to a significant variability in
depen-15
dence on the SZA for radiometers with a large cosine error as can be seen for the radiometers of INTA and STUK. Neither institute applies a cosine correction and es-pecially at high SZA deviations relative to QASUMEof up to 20% are observed. In the case of STUK the high deviations at high SZA could also be due to the setting of the conversion function fn, which was set to unity.
20
4 Conclusions
A joint intercomparison of broadband radiometers measuring erythemally weighted solar irradiance was performed between six UV calibration facilities in Europe and one in the USA. The characterisation and calibration campaign was organised by PMOD/WRC in Davos, Switzerland.
25
The owners calibrated their UV broadband radiometers prior to sending them to PMOD/WRC. The subsequent calibration done by PMOD/WRC was compared to the
ACPD
8, 2249–2273, 2008 Comparison of UV calibration facilities Title Page Abstract Introduction Conclusions References Tables Figures ◭ ◮ ◭ ◮ Back Close Full Screen / EscPrinter-friendly Version Interactive Discussion
EGU
owners calibration. It was assumed that the radiometers did not significantly change from the time of the calibration performed at the home insitute and the one done at PMOD/WRC.
The calibration consisted in the determination of the spectral and angular response of the radiometer, followed by an absolute calibration performed outdoors relative to a
5
spectroradiometer which provided the absolute reference.
The characterization of the detectors in the respective laboratories were found to be in good agreement, especially concerning the determination of the angular response, with deviations below ±4% in the calculated cosine error. The larger differences ob-served with the spectral response functions is due to the differences in the laboratory
10
setups used to determine the SRF. However the differences do not introduce any sig-nificant discrepancies in the resulting calibration apart from one case.
A ’blind’ intercomparison of the erythemally weighted irradiances derived by the re-spective institutes and PMOD/WRC showed consistent measurements to within ±2% for the majority of institutes. Only one institute (STUK) showed slightly larger deviation
15
of 10% (see Table5and Fig.4).
The absolute calibration of the spectroradiometers, which are used to calibrate the erythema detectors, has an uncertainty of at least ±5%. Therefore the results of the intercomparison are very good, since nearly all instrument calibrations are will within their estimated uncertainties.
20
Acknowledgements. The instrumentation of the UV Center at PMOD/WRC is made available by the Joint Research Centre of the European Commission in Ispra under the cooperation agreement 2004-SOCP-22187. G. H ¨ulsen acknowledges support from the European Coop-eration in the field of Scientific and Technical Research (COST), SBF No. C05.0068. Many thanks also to C. Wilson from CUCF for laboratory measurements of the YES UVB-1 000904.
ACPD
8, 2249–2273, 2008 Comparison of UV calibration facilities Title Page Abstract Introduction Conclusions References Tables Figures ◭ ◮ ◭ ◮ Back Close Full Screen / EscPrinter-friendly Version Interactive Discussion
EGU
References
Bais, A., Kazadzis, S., Balis, D., Zerefos, C., and Blumthaler, M.: Correcting global solar ultra-violet spectra recorded by a Brewer spectroradiometer for its angular response error, Appl. Optics, 37, 6339–6344, 1998. 2254
Gr ¨obner, J. and Sperfeld, P.: Direct traceability of the portable QASUME irradiance scale to the
5
primary irradiance standard of the PTB, Metrologia, 42, 134–139, 2005. 2254
Gr ¨obner, J., Blumthaler, M., and Ambach, W.: Experimental investigation of spectral glabal irradiance measurement errors due to a non ideal cosine response, Geophys. Res. Lett., 23, 2493–2496, 1996. 2254
Gr ¨obner, J., Kazadzis, S., Schreder, J., Bais, A. F., Blumthaler, M., G ¨orts, P., Koskela, T.,
10
Seckmeyer, G., Webb, A. R., and Wuttkeand, S.: Quality assurance of spectral ultraviolet measurements in Europe through the development of a transportable unit, Doc. EUR 20991 EN (European Commission, 2003), 2003. 2260
Gr ¨obner, J., Schreder, J., Kazadzis, S., Bais, A. F., Blumthaler, M., G ¨orts, P., Tax, R., Koskela, T., Seckmeyer, G., Webb, A. R., and Rembges, D.: Traveling reference spectroradiometer for
15
routine quality assurance of spectral solar ultraviolet irradiance measurements, Appl. Optics, 44, 5321–5331, 2005. 2254
Gr ¨obner, J., Blumthaler, M., Kazadzis, S., Bais, A., Webb, A., Schreder, J., Seckmeyer, G., and Rembges, D.: Quality assurance of spectral solar UV measurements: results from 25 UV monitoring sites in Europe, 2002 to 2004, Metrologia, 43, 66–71, 2006. 2254
20
Gr ¨obner, J., H ¨ulsen, G., Vuilleumier, G. L., Blumthaler, M., Vilaplana, J. M., Walker, D., and Gil, J. E.: Report of the PMOD/WRC-COST Calibration and Intercomparison of Erythe-mal Radiometers, available at:http://i115srv.vu-wien.ac.at/uv/COST726/COST726 Dateien/
Results/PMOD WRC COST726 campaign 2006 R.pdf, 2007.2251,2252,2260
H ¨ulsen, G. and Gr ¨obner, J.: Characterization and calibration of ultraviolet broadband
radiome-25
ters measuring erythemally weighted irradiance, Appl. Optics, 46, 5877–5886, 2007. 2251,
2252,2254,2261
ISO: Erythema reference action spectrum and standard erythema dose, International Organi-zation for StandardiOrgani-zation, ISO/CIE 17166:1999, 1999. 2252,2254
Lantz, K., Disterhoft, P., DeLuisi, J., Early, E., Thompson, A., Slusser, J., and Bigelow, D.:
30
A Methodology for Deriving Clear-Sky Erythema Calibration Factors for UVB Broadband Radiometers of the CUCF, J. Atmos. Ocean. Tech., 16, 1736–1752, 1999.2251,2254
ACPD
8, 2249–2273, 2008 Comparison of UV calibration facilities Title Page Abstract Introduction Conclusions References Tables Figures ◭ ◮ ◭ ◮ Back Close Full Screen / EscPrinter-friendly Version Interactive Discussion
EGU
Leszczynski, K., Jokela, K., Ylianttila, L., Visuri, R., and Blumthaler, M.: Erythemally weighted radiometers in solar UV monitoring: Results from the WMO/STUK Intercomparison, Pho-tochem. Photobiol., 67, 212–221, 1998. 2251,2254
Mayer, B. and Kylling, A.: The libRadtran software package for radiative transfer calculations – description and examples of use, Atmos. Chem. and Phys., 5, 1855–1877, available at:
5
http://www.libradtran.org, 2005.2254
McKinlay, A. and Diffey, B.: A reference action spectrum for ultraviolet induced erythema in human skin, CIE J., 6, 17–22, 1987. 2252,2254
M ¨uller, G., Artz, R., Baltensperger, U., Carmichael, G., Dlugokencky, E., Penkett, S., St ¨ahelin, J., Webb, A., Hov, O., Klausen, J., Sturges, B., Barrie, L., Braathen, G., Jalkanen, L., and
10
Nickovic, S.: WMO Global Atmosphere Watch (GAW) Strategic Plan: 2008–2015, World Meteorological Organization WMO/GAW Rep., WMO TD NO. 1384, available at:http://www.
wmo.int/pages/prog/arep/gaw/documents/gaw172 sp 15may.pdf, 2007. 2251
Schreder, J., Gr ¨obner, J., Los, A., and Blumthaler, M.: Intercomparison of monochromatic source facilities for the determination of the relative spectral response of emal broadband
15
filter radiometers, Opt. Lett., 29, 1455–1457, 2004.2258
Webb, A., Gr ¨obner, J., and Blumthaler, M.: A Practical Guide to Operating Broadband Instru-ments Measuring Erythemally Weighted Irradiance, available at: http://i115srv.vu-wien.ac.
at/uv/COST726/COST726 Dateien/Results/GuideBB COST726.pdf, EUR 22595, ISBN 92-898-0032-1, 2006. 2255
ACPD
8, 2249–2273, 2008 Comparison of UV calibration facilities Title Page Abstract Introduction Conclusions References Tables Figures ◭ ◮ ◭ ◮ Back Close Full Screen / EscPrinter-friendly Version Interactive Discussion
EGU Table 1. UV calibration facilities participating in the intercomparison.
UV calibration facility Country Abbreviation Instrument Physikalisch-Meteorologisches Observatorium Davos / Switzerland PMOD/WRC (Reference) World Radiation Center
National Oceanic and Atmospheric Administration, USA CUCF YES 000904 Central UV Calibration Facility
Innsbruck Medical University, Austria UIIMP Scintec 349 Division for Biomedical Physics
Aristotle University of Thessaloniki, Greece LAP YES 921116 Laboratory of Atmospheric Physics
Instituto Nacional de T ´ecnica Aerospacial Spain INTA YES 990608 STUK, Radiation and Nuclear Finland STUK SL 635 D Safety Authority, Finland
ACPD
8, 2249–2273, 2008 Comparison of UV calibration facilities Title Page Abstract Introduction Conclusions References Tables Figures ◭ ◮ ◭ ◮ Back Close Full Screen / EscPrinter-friendly Version Interactive Discussion
EGU
Table 2. Diffuse cosine error calculated according to Eq. 4 using the measured angular
re-sponse functions shown in Fig.2.
Instrument PMOD/WRC Owner PMOD/Owner [%]
YES 000904 0.85 0.82 +3
Scintec 349 0.98 none none
YES 921116 0.90 none none
YES 990608 0.88 0.87 +1
SL 635 D 1.12 1.10 +2
ACPD
8, 2249–2273, 2008 Comparison of UV calibration facilities Title Page Abstract Introduction Conclusions References Tables Figures ◭ ◮ ◭ ◮ Back Close Full Screen / EscPrinter-friendly Version Interactive Discussion
EGU
Table 3. Clear sky cosine correction factor at SZA=40◦calculated according to Eq.2using the
measured angular response functions shown in Fig.2.
Instrument PMOD/WRC Owner PMOD/Owner [%]
YES 000904 1.121 1.157 −3.1
Scintec 349 1.010 none none
YES 921116 1.075 none none
YES 990608 1.088 1.100 −1.1
SL 635 D 0.889 none none
ACPD
8, 2249–2273, 2008 Comparison of UV calibration facilities Title Page Abstract Introduction Conclusions References Tables Figures ◭ ◮ ◭ ◮ Back Close Full Screen / EscPrinter-friendly Version Interactive Discussion
EGU
Table 4. Absolute calibration factor at TO3=300 DU and SZA=40◦. For comparibility, the
own-ers calibration factors indicated with * are divided by the clear sky cosine correction calculated by PMOD/WRC since these institutes do not separate the absolute calibration factor and the cosine correction. The units are in Wm−2/V for the first four radiometers and in Wm−2/MED h−1
for the last two (Solar Light).
Instrument PMOD/WRC Owner PMOD/Owner [%]
YES 000904 0.1151 0.1126 +2.2 Scintec 349 0.1480 0.1524 * −3.0 YES 921116 0.1506 0.1570 * −4.1 YES 990608 0.1199 0.1183 +1.4 SL 635 D 0.0569 0.0525 * +8.4 SL 616 D 0.0559 0.0549 +1.9
ACPD
8, 2249–2273, 2008 Comparison of UV calibration facilities Title Page Abstract Introduction Conclusions References Tables Figures ◭ ◮ ◭ ◮ Back Close Full Screen / EscPrinter-friendly Version Interactive Discussion
EGU
Table 5. Summary results of the outdoor measurement campaign (see also Fig.4). The second
and third columns list the mean and standard deviation of the erythemally weighted irradiances ratios between the radiometer and the QASUME reference spectroradiometer, calibrated by PMOD/WRC and the owners, respectively.
Instrument PMOD/WRC Owner
YES 000904 0.985±0.049 0.982±0.063 Scintec 349 1.004±0.019 1.020±0.054 YES 921116 0.983±0.050 0.981±0.061 YES 990608 0.975±0.052 0.977±0.074 SL 635 D 1.006±0.049 0.912±0.051 SL 616 D 1.000±0.035 0.990±0.071
ACPD
8, 2249–2273, 2008 Comparison of UV calibration facilities Title Page Abstract Introduction Conclusions References Tables Figures ◭ ◮ ◭ ◮ Back Close Full Screen / EscPrinter-friendly Version Interactive Discussion EGU 300 320 340 360 380 0.0001 0.001 0.01 0.1 1 SRF (a) YES 000904 PMOD CUCF CIE 300 320 340 360 380 400 0.6 0.8 1 1.2 1.4 Ratio PMOD/CUCF 300 320 340 360 380 0.0001 0.001 0.01 0.1 1 SRF (b) Scintec 349 PMOD UIIMP CIE 300 320 340 360 380 400 0.6 0.8 1 1.2 1.4 Ratio PMOD/UIIMP 300 320 340 360 380 0.0001 0.001 0.01 0.1 1 SRF (c) YES 921116 PMOD LAP CIE 300 320 340 360 380 400 0.6 0.8 1 1.2 1.4 Ratio PMOD/LAP 300 320 340 360 380 0.0001 0.001 0.01 0.1 1 SRF (d) YES 990608 PMOD INTA CIE 300 320 340 360 380 400 0.6 0.8 1 1.2 1.4 Ratio PMOD/INTA 300 320 340 360 380 0.0001 0.001 0.01 0.1 1 SRF (e) SL 635 D PMOD STUK CIE 300 320 340 360 380 400 0.6 0.8 1 1.2 1.4 Ratio PMOD/STUK Wavelength [nm] 300 320 340 360 380 0.0001 0.001 0.01 0.1 1 SRF (f) SL 616 D PMOD NRPA CIE 300 320 340 360 380 400 0.6 0.8 1 1.2 1.4 Ratio PMOD/NRPA Wavelength [nm]
Fig. 1. Spectral response functions as measured at PMOD/WRC and at the owners calibration
facility (see Table1). The ratio of the two measurements are shown in the bottom half of the respective figure.
ACPD
8, 2249–2273, 2008 Comparison of UV calibration facilities Title Page Abstract Introduction Conclusions References Tables Figures ◭ ◮ ◭ ◮ Back Close Full Screen / EscPrinter-friendly Version Interactive Discussion EGU 10 20 30 40 50 60 70 80 0.2 0.4 0.6 0.8 1 1.2 Cosine Error (a) YES 000904 PMOD CUCF 0 10 20 30 40 50 60 70 80 90 −8 −4 0 4 8 Difference PMOD−CUCF 10 20 30 40 50 60 70 80 0.2 0.4 0.6 0.8 1 1.2 Cosine Error (b) Scintec 349 PMOD UIIMP 0 10 20 30 40 50 60 70 80 90 −8 −4 0 4 8 Difference PMOD−UIIMP 10 20 30 40 50 60 70 80 0.2 0.4 0.6 0.8 1 1.2 Cosine Error (c) YES 921116 PMOD 0 10 20 30 40 50 60 70 80 90 −8 −4 0 4 8 Difference PMOD−LAP
No data from LAP
10 20 30 40 50 60 70 80 0.2 0.4 0.6 0.8 1 1.2 Cosine Error (d) YES 990608 PMOD INTA 0 10 20 30 40 50 60 70 80 90 −8 −4 0 4 8 Difference PMOD−INTA 10 20 30 40 50 60 70 80 0.2 0.4 0.6 0.8 1 1.2 Cosine Error (e) SL 635 D PMOD STUK 0 10 20 30 40 50 60 70 80 90 −8 −4 0 4 8 Difference PMOD−STUK
Zenith Angle [deg]
10 20 30 40 50 60 70 80 0.2 0.4 0.6 0.8 1 1.2 Cosine Error (f) SL 616 D PMOD NRPA 0 10 20 30 40 50 60 70 80 90 −8 −4 0 4 8 Difference PMOD−NRPA
Zenith Angle [deg]
Fig. 2. Cosine Error derived from the angular response functions as measured at PMOD/WRC
and at the owners calibration facility (see Table1). The difference of the two measurements in percent are shown in the bottom half of each figure. The ARF of the YES 921116 radiometer was not determined at LAP before the COST726 campaign.
ACPD
8, 2249–2273, 2008 Comparison of UV calibration facilities Title Page Abstract Introduction Conclusions References Tables Figures ◭ ◮ ◭ ◮ Back Close Full Screen / EscPrinter-friendly Version Interactive Discussion EGU 10 20 30 40 50 60 70 80 0.2 0.4 0.6 0.8 1 1.2 1.4 1.6 1.8 Normalised (a) YES 000904 PMOD CUCF 0 10 20 30 40 50 60 70 80 90 0.92 0.96 1 1.04 1.08 Ratio PMOD/CUCF 10 20 30 40 50 60 70 80 0.2 0.4 0.6 0.8 1 1.2 1.4 1.6 1.8 Normalised (b) Scintec 349 PMOD UIIMP 0 10 20 30 40 50 60 70 80 90 0.92 0.96 1 1.04 1.08 Ratio PMOD/UIIMP 10 20 30 40 50 60 70 80 0.2 0.4 0.6 0.8 1 1.2 1.4 1.6 1.8 Normalised (c) YES 921116 PMOD LAP 0 10 20 30 40 50 60 70 80 90 0.92 0.96 1 1.04 1.08 Ratio PMOD/LAP 10 20 30 40 50 60 70 80 0.2 0.4 0.6 0.8 1 1.2 1.4 1.6 1.8 Normalised (d) YES 990608 PMOD INTA 0 10 20 30 40 50 60 70 80 90 0.92 0.96 1 1.04 1.08 Ratio PMOD/INTA 10 20 30 40 50 60 70 80 0.2 0.4 0.6 0.8 1 1.2 1.4 1.6 1.8 Normalised (e) SL 635 D PMOD 0 10 20 30 40 50 60 70 80 90 0.92 0.96 1 1.04 1.08 Ratio PMOD/STUK
Solar Zenith Angle [deg]
No data from STUK
10 20 30 40 50 60 70 80 0.2 0.4 0.6 0.8 1 1.2 1.4 1.6 1.8 Normalised (f) SL 616 D PMOD NRPA 0 10 20 30 40 50 60 70 80 90 0.92 0.96 1 1.04 1.08 Ratio PMOD/NRPA
Solar Zenith Angle [deg]
Fig. 3. Conversion function f in dependence of solar zenith angle for 200 DU (solid line), 300 DU
(dashed line) and 400 DU (solid dashed line) calculated using the SRF measured, respectively, by PMOD/WRC and the home institute (see Fig.1). The ratio of the two conversion functions are shown in the bottom half of each figure. The conversion function of the Solar Light 635
ACPD
8, 2249–2273, 2008 Comparison of UV calibration facilities Title Page Abstract Introduction Conclusions References Tables Figures ◭ ◮ ◭ ◮ Back Close Full Screen / EscPrinter-friendly Version Interactive Discussion EGU 40 50 60 70 80 0.8 0.9 1 1.1 1.2 (a) YES 000904 40 50 60 70 80 0.8 0.9 1 1.1 1.2 Radiometer / QASUME PMOD CUCF 0.8 0.9 1 1.1 1.2 0.5 0.8 0.9 1 1.1 1.2 0.5 1 40 50 60 70 80 0.8 0.9 1 1.1 1.2 (b) Scintec 349 40 50 60 70 80 0.8 0.9 1 1.1 1.2 Radiometer / QASUME PMOD UIIMP 0.8 0.9 1 1.1 1.2 0.5 0.8 0.9 1 1.1 1.2 0.5 1 40 50 60 70 80 0.8 0.9 1 1.1 1.2 (c) YES 921116 40 50 60 70 80 0.8 0.9 1 1.1 1.2 Radiometer / QASUME PMOD LAP 0.8 0.9 1 1.1 1.2 0.5 0.8 0.9 1 1.1 1.2 0.5 1 40 50 60 70 80 0.8 0.9 1 1.1 1.2 (d) YES 990608 40 50 60 70 80 0.8 0.9 1 1.1 1.2 Radiometer / QASUME PMOD INTA 0.8 0.9 1 1.1 1.2 0.5 0.8 0.9 1 1.1 1.2 0.5 1 40 50 60 70 80 0.8 0.9 1 1.1 1.2 (e) SL 635 D 40 50 60 70 80 0.8 0.9 1 1.1 1.2
Solar Zenith Angle [deg]
Radiometer / QASUME PMOD STUK 0.8 0.9 1 1.1 1.2 0.5 0.8 0.9 1 1.1 1.2 0.5 1 40 50 60 70 80 0.8 0.9 1 1.1 1.2 (f) SL 616 D 40 50 60 70 80 0.8 0.9 1 1.1 1.2
Solar Zenith Angle [deg]
Radiometer / QASUME PMOD NRPA 0.8 0.9 1 1.1 1.2 0.5 0.8 0.9 1 1.1 1.2 0.5 1
Fig. 4. Erythemally weighted irradiances derived by the PMOD/WRC and the respective home
institute relative to the QASUME spectroradiometer for the whole measurement campaign in dependence on the solar zenith angle. The right side of each figure shows the corresponding residuals in bins of 0.015. The histograms are normalized to the largest bin in each figure.