HAL Id: hal-02937457
https://hal.archives-ouvertes.fr/hal-02937457
Submitted on 1 Apr 2021
HAL is a multi-disciplinary open access
archive for the deposit and dissemination of
sci-entific research documents, whether they are
pub-lished or not. The documents may come from
teaching and research institutions in France or
abroad, or from public or private research centers.
L’archive ouverte pluridisciplinaire HAL, est
destinée au dépôt et à la diffusion de documents
scientifiques de niveau recherche, publiés ou non,
émanant des établissements d’enseignement et de
recherche français ou étrangers, des laboratoires
publics ou privés.
A historical, geographical and ecological perspective on
the 2018 European summer drought
Wouter Peters, Ana Bastos, Philippe Ciais, Alex Vermeulen
To cite this version:
Wouter Peters, Ana Bastos, Philippe Ciais, Alex Vermeulen. A historical, geographical and ecological
perspective on the 2018 European summer drought. Philosophical Transactions of the Royal Society
B: Biological Sciences, Royal Society, The, 2020, 375 (1810), pp.20190505. �10.1098/rstb.2019.0505�.
�hal-02937457�
royalsocietypublishing.org/journal/rstb
Introduction
Cite this article: Peters W, Bastos A, Ciais P,
Vermeulen A. 2020 A historical, geographical
and ecological perspective on the 2018
European summer drought. Phil. Trans. R. Soc.
B 375: 20190505.
http://dx.doi.org/10.1098/rstb.2019.0505
Accepted: 3 August 2020
One contribution of 16 to a theme issue
‘Impacts of the 2018 severe drought and
heatwave in Europe: from site to continental
scale
’.
Subject Areas:
environmental science, physiology
Keywords:
drought, Europe, atmosphere, carbon dioxide,
soil moisture, photosynthesis
Author for correspondence:
Wouter Peters
e-mail: [email protected]
A historical, geographical and ecological
perspective on the 2018 European
summer drought
Wouter Peters
1,2, Ana Bastos
3, Philippe Ciais
4and Alex Vermeulen
51Department of Meteorology and Air Quality, Wageningen University, Wageningen, The Netherlands 2Centre for Isotope Research Groningen, Groningen University, Groningen, The Netherlands 3Max Planck Institute for Biogeochemistry, Jena, Germany
4Laboratoire des Sciences du Climat et de l’Environnement, Gif-sur-Yvette, France 5Integrated Carbon Observing System (ICOS ERIC), Carbon Portal, Lund, Sweden
WP, 0000-0001-8166-2070; AB, 0000-0002-7368-7806; PC, 0000-0001-8560-4943; AV, 0000-0002-8158-8787
1. Introduction
Understanding the impact of large-scale severe droughts on water losses and carbon balances in terrestrial ecosystems, and ecosystem services such as food and fibre production, is a key research challenge. Every large-scale drought is a ‘natural experiment’ allowing the scientific community to gain insights on plant water stress, disturbances, carbon and water budgets, ecosystem and socio-economical resistance and resilience. The drought of 2018 in Europe was notable for its severity, and presented unique meteorological conditions as an exception-ally warm—but not exceptionexception-ally dry—spring rapidly transitioned into an extreme summer drought. The epicentre of this drought was over Northern and Central Europe, including the UK and Scandinavia, where crops and forests rarely experience such hot summers and high water deficits. This distinctive fingerprint of 2018, being one of only few recorded heatwaves and droughts over presumably temperature-limited Northern European ecosystems, makes this event unique to gain insights on the response of ecosystems and crops to the expected rapid warming due to climate change.
The effects of the 2018 summer drought event received widespread media attention. Temperature records were broken in the UK, Belgium, Germany, Lux-embourg and The Netherlands, and the media reported on water shortages and irrigation restrictions, crop failures and yield reductions, and fire outbreaks stretching even into the Scandinavian forests. A burning question on whether this extreme drought was related with anthropogenic climate change returned frequently in the media, with recent analyses suggesting indeed an important role for the slow climate warming that caused record Northern Hemisphere average temperatures in 2016, 2017 and 2018, only to be broken again in many countries in the summer of 2019 [1–4]. In daily life, the general public recognized the extremes in long periods without rainfall, causing crops and grasslands to wilt early in a massive‘browndown’ of the landscape. This gen-eral observation was later confirmed by a published analysis of MODIS Normalized Vegetation Index [5], showing a record surface area of Europe fall-ing in the lowest quantile of greenness of the past two decades.
It is important to establish that, although the 2018 event broke many records and had unique features, its development and progression through the season were driven by known large-scale mechanisms [6], resulting from a combi-nation of a rare atmospheric synoptic situation and known land–atmosphere interactions [7–9], and modulated by long-term warming trends [10]. The 2018 drought also had similar impacts on ecosystems to those recorded during earlier droughts in 2003 [11] and 2010 [12]. Many ecosystem exchange measurements and atmospheric carbon dioxide mole fractions analysed in this special issue were established in the early 2000s, and have been part of pan-European monitoring networks [13–15]. Providing long time-series is an
© 2020 The Author(s) Published by the Royal Society. All rights reserved.
important strength of such networks as it allows us to place anomalous years like 2018 in a climate perspective, contrasting it with nearly two decades of variability and previous extremes. Moreover, the high level of intercalibration between observations allows meaningful spatial comparisons, drawing contrasts between different types of vegetation in different climate zones and under different management regimes.
Important outstanding questions concern the relative role of the stomatal and the non-stomatal response of vegetation, refer-ring to their readiness to close stomata when the atmospheric vapour pressure deficit increases, and their response to reductions in accessible moisture in the soil near their roots. Stomatal responses have been documented widely under var-ious laboratory and field conditions (see e.g. [16,17] and references therein), and their inclusion in numerical models is often derived from similar principles (e.g. [18,19]). Non-stomatal responses however are much less widely observed and require actual extreme droughts to be separable from the stomatal response [20]. Their treatment in numerical models is therefore much less unified, more strongly empirical, and much less vali-dated against observations, causing large model-to-model differences when simulating severe droughts [21–24].
Following the 2018 summer drought event, a ‘drought task force’ was formed by a group of 75+ researchers, mostly active within the European Integrated Carbon Obser-vation System (ICOS). From studying impacts at their own ecosystem or atmospheric sites, but also from dendrological observations, crop yields, and remote sensing, they realized the potential of a synthesis of this drought across spatio-temporal scales, science domains, and disciplines. From that perspective, opportunities arose to:
(1) create an unprecedentedly detailed dataset on severe drought impacts in mid-to-high latitude ecosystems, integrating multiple coordinated surface observation networks with remote sensing data;
(2) test our current knowledge on the interactions of carbon, water and energy between the (vegetated) surface and atmosphere during severe droughts, as represented in the current generation of Earth System Models, specifi-cally in an area where previous impacts and thus evidence has been scarce;
(3) develop new parameterizations of drought impacts, specifically through soil moisture deficits, and indepen-dently validate them from multiple cross-disciplinary observational datasets.
The individual papers in this issue have capitalized on these opportunities, and together provide an update of the observational data and library of numerical model experiments with another extreme drought year in the decades-long monitoring effort.
In this introduction to this special issue, we first provide further context to these papers by summarizing the 2018 drought from the larger geographical and multidecadal climate perspectives that were partly provided previously based on weather- and climate-modelling studies. In our combined efforts in this issue, however, we present the first recorded impacts of this drought across the different ecosys-tems that together make up the European terrestrial biosphere, and we summarize these findings in an‘ecological perspective’. Finally, we discuss the main open questions and opportunities for our community to address.
This has become especially relevant since at the moment of writing this introduction (July 2020), some regions are experien-cing the development of yet another severe drought event over the area hit hard in 2018, which across a wide area also experi-enced drought stress in 2019 (see https://spei.csic.es/map/ maps.html#months=1#month=4#year=2020). For example, for some regions in Germany, this is the third consecutive summer under drought. Rainfall deficits in The Netherlands in 2020 exceeded those of 2018 throughout the early summer season before returning to 2019 levels, which are still in the driest 10th percentile in many areas (figure 1). Signs of soil moisture depletion and vegetation stress are again detected (see https://edo.jrc.ec.europa.eu/edov2/php/index.php?id= 1138), further reinforcing the need for the research in this issue and the importance for the scientific community to be rapidly mobilized for analysing the impacts and response of ecosystems to such events when they happen.
2. Geographical perspective
(a) Atmospheric drought
The 2018 summer drought was driven by the large-scale synoptic weather pattern across the Northern Hemisphere. Kornhuberet al. [25,26] have described this specific pattern before as the establishment of a stationary (phase-locked) baroclinic wave. This pattern with seven distinct troughs and ridges (wavenumber 7) across the Northern Hemisphere gives rise to cold temperature and floods in Eastern Europe and Japan, and to excessive heat and droughts over Western Europe, the western USA, and the Caspian Sea. It was similarly present—but spatially slightly shifted—during major drought events in 2003, 2006, 2012 and 2015. The authors pointed out that wavenumber-7 events seem to have increased over the past three decades, possibly as a result of an increasing land–ocean temperature contrast due to climate warming.
In a study focused on the UK, McCarthyet al. [27] linked the 2018 drought to the large-scale circulation, noting the very strongly positive Summer North Atlantic Oscillation index (SNAO, a pressure difference between the Shetlands and Greenland, see [28]), indicative of a northward displace-ment of the westerly flows towards Europe, giving rise to warm and dry conditions. The specific conditions for the development of the positive SNAO are weakly linked to higher sea surface temperatures, which act against a back-ground of the increasing temperatures over the past decade. Using both model and observations, McCarthy et al. calculate that the 2018 summer temperatures have an approximate 12% chance of being matched or exceeded in our current climate, but a more than 50% chance in the much warmer climate of the mid-twenty-first century. In that sense, the 2018 summer drought can rightly be seen as ‘the new normal’ of UK summers 30 years from now, and fits the pattern of warmer summers with’ more frequent, per-sistent, and intense heatwaves’ in Europe mentioned in Barriopedroet al. [29, p. 220]. In the analysis of Leach et al. [2], the 2018 drought was estimated to have a 10-year return time under present-day climate, and had a factor of 10–100 higher chance of occurrence than in ‘natural climate’ without anthropogenic forcings.
In contrast to Northern and Central Europe, the same synoptic weather patterns caused Southern Europe to experi-ence a particularly wet spring, which was followed by
ro
yalsocietypublishing.org/journal/rs
tb
Phil.
Trans.
R.
Soc.
B
375
:
20190505
2summer heatwaves only in August across Portugal and Spain. Record temperatures for the twenty-first century were recorded in Lisbon, as part of a heat anomaly of more than 5°C covering the Iberian peninsula, leading to peak energy demand for air conditioning [1]. Interestingly, crop growth in Southern Europe profited from favourable spring conditions and most harvesting was done before the heatwaves struck, leaving Spain and Portugal with a considerable yield increase in 2018 [30].
(b) Agricultural drought
Compared with the previous droughts since 2000, summer 2018 registered the largest extent, 24–38 Mha, of extreme and severe agricultural drought, compared with 20–28 Mha in 2003 and 14–18 Mha in 2010 [24]. The 2018 event was centred around Germany, Poland, most of Scandinavia and the Baltic countries, and affected a larger extent of boreal forests and high latitude ecosystems. As in 2003 and 2010, the regions more strongly affected by drought also registered extremely high temperature anomalies in summer 2018, linked to strong land–atmosphere feedbacks [7,31], but 2003 and 2010 still surpassed 2018 in terms of area registering record temperature anomalies.
The extreme character of the agricultural drought in summer 2018 may be linked to both the rare synoptic con-ditions in summer described above and the occurrence of a strong spring heatwave and drought affecting most of Central Europe and Scandinavia, reinforcing soil-water–air tempera-ture feedbacks. Indeed, compared with other years in the 40-year-long record, 2018 registered the sharpest transition between average-to-wet conditions at continental scale in late winter, to extremely strong soil-water deficits in summer. The sharp enhancement in drought conditions over late spring 2018 is likely related to record high temperature anomalies over most of Eastern Europe and record values
in incoming radiation in Scandinavia. Warm and bright con-ditions in spring in these regions likely contributed to an earlier depletion of soil moisture and to amplify soil dryness during the unusual combination of synoptic conditions in summer.
3. Historical perspective
The year 2018 was globally the fourth warmest on record since 1880, with a mean warming of 0.79° compared with the 1880–1900 average. Temperatures across most of the world were warmer to much warmer than average. Record warm temperatures were measured across much of Europe and the Mediterranean Sea, and the Middle East, but also in the Southern Hemisphere and ocean regions. The year began with a La Niña episode present across the tropical Paci-fic Ocean that would have promoted cooler conditions in the tropics, but it transitioned to ENSO-neutral by April 2018.
Drought developed in spring 2018 in different regions of the Northern Hemisphere north of 30° N, in particular Cen-tral Europe and Scandinavia, northeast China and the southwestern USA. Record-breaking summer temperatures occurred in various regions, including Central and Northern Europe and, to a lesser extent, in the southwestern USA. Sev-eral regions in Siberia and Canada were also under moderate to strong drought. As a result, the summer 2018 wildfire season was particularly severe in many regions, including California, Scandinavia, the UK and Siberia. In the autumn, drought persisted and only slightly decreased in intensity over Europe, while it concurrently expanded and intensified in Siberia. Europe appears to be the region that experienced the longest and most severe drought in the Northern Hemi-sphere during 2018, associated with a unique combination 2018 2019 2020 mean 2018 2019 2020 mean 2018 2019 2020 mean 2018 2019 2020 mean 2018 2019 2020 mean 2018 2019 2020 mean
Cabauw Schiphol Rotterdam
300 200 100 0
50 100 150 days since 1 April
50 100 150 days since 1 April
50 100 150 days since 1 April
50 100 150 days since 1 April Volkel
Gilze-Rijen Deelen
50 100 150 days since 1 April
50 0 0 0 0 0 0 100 150 days since 1 April
ET–P (mm) 300 200 100 0 ET–P (mm) 300 200 100 0 ET–P (mm) 300 200 100 0 ET–P (mm) 300 200 100 0 ET–P (mm) 300 200 100 0 ET–P (mm)
Figure 1. Summer rainfall deficits ( potential Evaporation-minus-Precipitation, ET
–P) for 2018 (red), 2019 (blue) and 2020 (orange) relative to the 1906–2020
climatology (grey, with mean in black) for six locations in The Netherlands. Data courtesy of KNMI, The Netherlands, from
http://projects.knmi.nl/klimatologie/dag-gegevens/selectie.cgi (accessed 24 August 2020).
ro
yalsocietypublishing.org/journal/rs
tb
Phil.
Trans.
R.
Soc.
B
375
:
20190505
3of very hot spring and hot and dry summer days and rare synoptic conditions in summer, as discussed above.
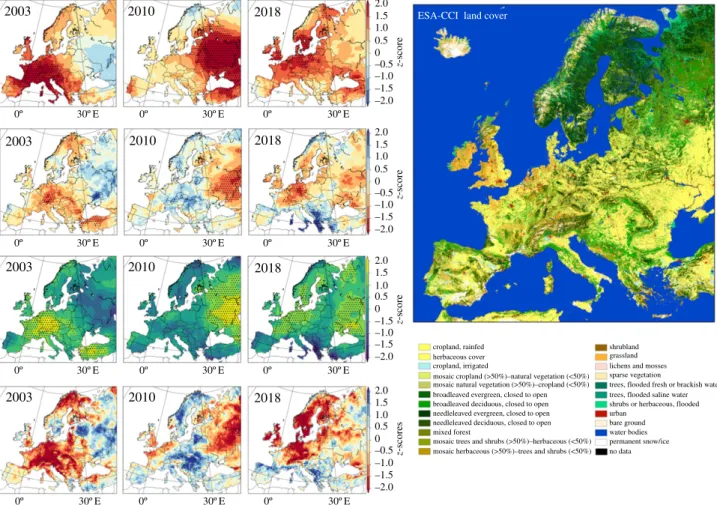
Summer rainfall was below average in all three events (figure 2), although only a small fraction of the area affected by severe agricultural drought (soil-moisture anomalies) experienced extremely low rainfall in 2003 and 2018. In 2003, preceding rainfall deficits have been shown to have played an important role in the summer drought [34]. All three events were associated with record high temperature anomalies (top row, figure 2) and extremely sunny conditions (third row, figure 2), especially 2003 and 2010, which have con-tributed to and were amplified by the surface drying [7]. In 2018, the summer temperature and radiation extremes were registered only in some sectors of the drought-stricken region. Bastos et al. [24] have shown that a record-breaking heatwave and extremely sunny conditions during the preced-ing sprpreced-ing contributed to the extreme summer drought in 2018. A near-real-time attribution study concluded that the extreme heat in Northern Europe was on average two times more likely owing to human-induced climate change [27]. Based on the ERA-40 and ERA-Interim datasets, Vogelet al. [35] calculated the fraction of the total populated area north of 30° N exposed to concurrent hot days, defined from 90th percentile exceedances over the reference period of 1958–1988. The daily area affected by extreme warm or hot conditions increased between May and July 2018, to reach an all-time peak of 37.5% in July 2018. Between May and July 2018, the area affected by hot days was two times larger than
in the reference period. Western Europe was particularly exposed to hot temperatures in both spring and summer.
Model simulations reproduce conditions similar to the 2018 European drought for only 4 years out of 875 years in historical runs and projections [36]. Future projections under the RCP8.5 scenario show that 2018-like temperature and rainfall conditions in Southern Europe, favourable to spring crop growth, will occur less frequently. By contrast, this high-end emission scenario climate projection shows that summer droughts as intense as 2018 could become a common occurrence in Central Europe as early as 2043. Another study shows an increase of up to 26% of the extent affected by severe drought in Europe as well as an increase in the duration of drought from several months to several years under different warming scenarios, if adaptation measures are not put in place [37].
4. Ecological perspective
The 2018 drought presented unique meteorological conditions and spatio-temporal characteristics, and affected distinct biomes that rarely experience hot summers and high water def-icits. The 2018 event is also unique in that it occurred at a time when remote sensing of the Earth’s surface and atmospheric composition had advanced, and in a region where a dense net-work of long-term atmospheric and ecosystem monitoring sites is available. This provides an exceptional opportunity to learn
2003 2010 2018 2.01.5 1.0 0.5 0 –0.5 –1.0 –1.5 –2.0 1.0 0.5 0 –0.5 –1.0 –1.5 –2.0 2.0 1.5 1.0 0.5 0 –1.5 –1.0 –1.5 –2.0 2.0 1.5 1.0 0.5 0 –0.5 –1.0 –1.5 –2.0 0º 30º E 0º 30º E 0º 30º E z-scores z-score z-score z-score cropland, rainfed
ESA-CCI land cover
herbaceous cover cropland, irrigated
mosaic cropland (>50%)–natural vegetation (<50%) mosaic natural vegetation (>50%)–cropland (<50%) broadleaved evergreen, closed to open broadleaved deciduous, closed to open needleleaved evergreen, closed to open needleleaved deciduous, closed to open mixed forest
mosaic trees and shrubs (>50%)–herbaceous (<50%) mosaic herbaceous (>50%)–trees and shrubs (<50%)
shrubland grassland lichens and mosses sparse vegetation
trees, flooded fresh or brackish water trees, flooded saline water shrubs or herbaceous, flooded urban bare ground water bodies permanent snow/ice no data 0º 30º E 0º 30º E 0º 30º E 0º 30º E 0º 30º E 0º 30º E 0º 30º E 0º 30º E 0º 30º E 2.0 1.5 2003 2010 2018 2003 2003 2010 2010 2018 2018
Figure 2. Three recent European extreme summers placed in a 40-year perspective of temperature (top row), rainfall (second row), incoming radiation (third row)
and soil-moisture (bottom row) anomaly. z-scores refer to the standardized anomalies for the reference period 1979
–2018. The stippling indicates pixels where
registered anomalies were in the top 5% (temperature and radiation) or lowest 5% (rainfall). The European land-cover map from ESA-CCI Land Cover [32] for the
year 2018 is shown in the right panel. Figure adapted from Bastos et al. [33].
ro
yalsocietypublishing.org/journal/rs
tb
Phil.
Trans.
R.
Soc.
B
375
:
20190505
4about (i) the ecosystems’ response to warming and drying, (ii) the dominant processes and mechanisms driving such responses, and (iii) the ability of land-surface models to correctly simulate these responses. In this special issue, we provide a syn-thesis of studies ranging fromin situ to continental scales, from in situ monitoring to large-scale remote sensing and to atmospheric and surface modelling to address these questions.
Based on dense atmospheric CO2mole fraction
measure-ments in Europe, Ramonet et al. [38] show that CO2
concentrations were above the previous years’ values during July and August over most of Europe, especially in Central Europe and Scandinavia, but they also point to lower CO2
mole fractions during spring (May and June). These measure-ments have large surface flux sensitivity footprints [39] and suggest an increased spring CO2sink, followed by a reduction
of this sink in summer. Indeed, atmospheric transport model inversions support below-average net CO2uptake in Central
Europe during summer 2018 [40–42]. Strong negative impacts on ecosystem productivity were observed in Germany and southern Sweden, supported by remote sensing datasets [42] and vegetation models [33]. Beillouinet al. [30] report multiple simultaneous crop yield deficits in Central and Eastern Europe and southern Scandinavia but above normal harvests in Southern Europe. However, ecosystem productivity in some regions affected by drought, especially parts of Scandinavia and Eastern Europe, appears to have been close to or even above average, as observed by eddy-flux towers, simulated by process-based vegetation models, and deduced from atmos-pheric CO2 measurements and transport modelling in the
so-called atmospheric inversion models [33,40,43,44]. In Southern Europe, net CO2uptake was generally above average,
even though extreme summer temperatures were registered, as wetter than average conditions prevailed in summer 2018 [45]. The asymmetry in the responses of ecosystems to the extreme summer drought and heatwave is the most striking feature of the analyses presented in this issue, but this can be seen as the result of the variety and broad scope of the approaches. Such asymmetries can point at important differences in the way ecosystems respond to heat and drought, and provide therefore an excellent learning opportunity.
The studies in this special issue provide some clues about the causes for these asymmetries: (i) distinct ecosystem- or species-dependent responses, (ii) differences in water-limitation states, (iii) geographical differences in drought characteristics, and (iv) the legacy effects from the previous spring heatwave and drought.
In situ measurements, remote sensing and data-driven and process models support a dominant role of gross pri-mary productivity (GPP) decrease, rather than a terrestrial ecosystem respiration (TER) increase, to most of the negative CO2 uptake anomalies seen by inversions
[33,42], although variability between sites is found [44,46,47]. As in previous extreme summers, the pro-ductivity of crops and grasslands was more strongly affected by the summer drought in 2018 than forests exposed to the effects of both high soil moisture deficits and high water vapour pressure deficits [33,47–49], even though some forests also registered stomatal closure and reduced GPP, especially those at lower altitudes [48] and more exposed to drought [44]. Wetlands in Scandinavia were also negatively affected by the drought [50], but floodplains in the Czech Republic registered higher than average productivity [43]. The geographical distribution
of the negative versus positive impacts on ecosystems’ GPP and net ecosystem productivity (NEP) can therefore be partly explained by the dominance of croplands in the southern sector of the drought region (Germany, The Nether-lands and Belgium, Poland, southern Sweden), compared with the forest-dominated regions in the higher latitudes. Over wetlands, CH4fluxes are a relevant component of the
carbon balance. Rinneet al. [50] show that even though NEP was reduced in most mire sites in Scandinavia, CH4emissions
were also reduced, resulting in reduction of the combined CO2
and CH4radiative forcing during the summer drought.
Nevertheless, different responses to the summer drought are found for similar ecosystem types and even for the same species. In situ-based studies [44,47–49] report reductions of 40–60% in evapotranspiration and/or stomatal conductance for drought-affected eddy-covariance sites in response to high vapour pressure deficit, explaining GPP reductions and increased water-use efficiency. But Lindrothet al. [44] show that forest eco-systems in Scandinavia were generally able to cope well with the strong drought by accessing deeper water layers, and therefore maintain close to average evaporation rates in spite of drought. Similarly, El-Madany et al. [45] find little response of Mediterranean oak trees to the summer drought, while Gharunet al. [48] find montane grasslands in Switzerland to have responded with extra carbon uptake. On the other hand, in those sites more strongly affected by soil-moisture deficits, Fuet al. [47] reported a doubling of the sensitivity of GPP to soil-water content, indicating a shift to water-limitation con-ditions compared with the‘normal’ year 2016. Results from data-driven and process-based models also support a shift to water-limited conditions in Central Europe and southern Scan-dinavia, and a persistence of energy-limitation in higher latitudes [33].
But also the seasonal evolution of climate anomalies in 2018 and the response of ecosystems to spring warming and increased radiation conditions appear to further contribute to differences in the impacts of the summer drought. Kowalska et al. [43] indicate that increases in GPP in response to spring warming were much larger than the decrease in summer for floodplain forests in the Czech Republic, resulting in a net sink for 2018. Atmospheric inversions, data-driven and pro-cess-based models indicate a small reduction in annual CO2
uptake, largely due to the offsetting impact of spring [33,42]. However, a question that remains is to what extent increased spring GPP (and consequent ET increase) amplified the summer drought. Summarizing their own and previous find-ings, Graf et al. [49] indicate that differences in water availability and stomatal conductance development led to increased evapotranspiration losses in all ecosystem types during the early stages of the drought year, which led to soil-water depletion and consecutive evapotranspiration reductions in some, most notably cropland and grasslands, the latter showing the strongest overall reduction in NEP. Pro-cess model simulations indicate that different trajectories in water-use from spring to summer contributed to the rapid soil-water depletion in the southern sector of the drought, amplifying the negative impacts of summer [24].
(a) Process understanding
Given the varying responses observed across gradients of lati-tude, altitude and species, it is clear that the underlying processes that control the response to environmental drivers
ro
yalsocietypublishing.org/journal/rs
tb
Phil.
Trans.
R.
Soc.
B
375
:
20190505
5are numerous, and simultaneous, with a subtle balance deter-mining the drought impact. Interestingly, nearly all analyses presented identify that drought stress from soil moisture limit-ation is an important factor, on top of the effects of heat, light and vapour pressure deficit, to explain observations. Gourlez de la Motteet al. [46] suggest a threshold of relative extractable water (REW) of 0.4 for these effects to play an important role across 10 temperate forest sites, very similar to the indepen-dently estimated 0.45 REW threshold for floodplain forests found by Kowalskaet al. [43]. Our model studies that include representations of the biosphere [33,42] confirm the need for soil moisture stress to simulate impacts on photosynthesis cor-rectly, but threshold levels, although a sensitive model parameter, were not compared across models and plant functional types.
A complication when trying to better define the role of soil moisture is that its effects come on top of the better-understood impact of high atmospheric vapour pressure deficits, causing stomatal closure and decreases in latent energy and GPP, as reported widely also for the summer 2018 event in [44–49]. Soil moisture stress exacerbated this atmospheric-driven impact, implemented as a reduction of the maximum carboxylation rate (Vcmax) in Gourlez de la Motteet al. [46], as reductions in Vcmax, stomatal conduc-tance and mesophyll conducconduc-tance by Smithet al. [42], and through various other mechanisms, sometimes including full plant hydraulics from roots to leaves, in the Dynamic Global Vegetation Models used in Bastoset al. [33]. Among extensive efforts and discussions in the scientific field (see for example [17,51,52] and references therein), this implemen-tation can be tested well against the available observations presented in this issue.
Many of the analyses presented discuss GPP changes or impacts on NEP, but very few conclusions were drawn on the role of TER. This is partly because no papers present direct measurements of TER, instead inferring its variations from net ecosystem exchange (NEE) or CO2observations.
Röden-becket al. [40] find a larger role for temperature-correlated NEE anomalies than for those correlated with the SPEI06, and suggest an important contribution of TER in creating the Central European reduced net carbon uptake. Bastos et al. [33], Smithet al. [42], El-Madany et al. [45] and Koebsch et al. [53] report covariations of TER reductions with GPP reductions, as also observed during many previous droughts across the world. Atmospheric CO2observations suggest the
balance of these reductions to have led to reduced net carbon uptake in many ecosystems (though see [38,40–42], for some turning net sinks of carbon into sources).
This same change to a net CO2source was also observed
in mire ecosystems in Finland by Rinneet al. [50], where the northerly extent of the 2018 drought resulted in additional impacts. Across six sites a lowered water table during the drought reduced the flux of CH4 to the atmosphere,
enough to offset the reduced carbon uptake in radiative for-cing on the atmosphere on shorter time-scales (but not on a 100-year horizon). On two rewetted fens in northern Germany, only small impacts of lowered water tables on CH4 fluxes were recorded [53] and surprisingly, increased
respiratory carbon losses from the fen were compensated by rapid growth of new plants, and increased assimilation. According to the authors, such a mechanism possibly indi-cates ‘good prospects of rewetting measures to create ecosystems resilient to climate change’.
5. Theme-specific research questions, and
emerging priorities
Together with the heatwaves of summer 2003 (Western Europe), summer 2010 (Russia) and the dry summer of 2015 (Eastern and Central Europe), the 2018 summer drought ana-lysed in this special issue forms a rich ensemble of distinct severe droughts. The 2018 event had its epicentre over North-ern and Central Europe, including the UK and Scandinavia, where crops and forests rarely experience hot summers and high water deficits. This special issue presents an extremely rich dataset and analyses on the impacts of the 2018 heatwave across ecosystems, from eddy-covariance, atmospheric, remote sensing and numerical modelling derived data. From the com-bined papers, a number of important scientific questions are addressed:
(1) How do ecosystems with varying stomatal and non-stomatal responses to stress at the leaf-level and root-level differ? How are their coupled carbon and water cycles affected? Which time-scales are involved for grasslands, crops, and evergreen as well as needleleaf forests in the drought response and recovery? Is there a critical threshold of soil moisture stress at which impacts quickly intensify? (2) What is the relationship between atmospheric
circula-tion anomalies, rainfall and heat anomalies, and the development rate of vegetation? What is the role of soil moisture and leaf phenology in setting up a hysteresis in spring–summer carbon uptake by vegetation? (3) What is the integrated loss of carbon uptake by vegetation
across the European landscape? What is the main driver of this loss? Which regions or ecosystems showed resilience, and which were most vulnerable during the 2018 event? (4) How can long-term monitoring in pan-European networks
contribute to our understanding of ecosystem functioning? Is current knowledge consistent with observations across scales, methods and ecosystem types?
Moreover, from the combined research presented, as well as from the workshop meetings with more than 75 participants, and the dedicated sessions at major conferences of the European Geophysical Union (2019), as well as from the ICOS (2019 and 2020), we are able to distil a number of key areas for future progress. Many of these are discussed in the dedicated sections of the individual papers, and we sum-marize them here as overarching themes to address in our field of research:
(1) From the papers, a clear role is seen for soil moisture stress on vegetation, and its varying impact across regions/PFTs. One recommendation is to initiate pan-European research to obtain a better understanding and better forecast skill of soil moisture (with depth) as a main ecological controlling variable. This would include a meteorological component that includes shallow-surface remote sensing as is done through gigahertz radar (SMOS/SMAP), data assimilation capacity for these, but also direct observations like through ICOS. From the ecological perspective, focus should go to detailed case studies based on local eddy-covariance data, but also regional studies with hi-resolution satellite data of canopy functioning, including SIF from TropOMI and FLEX, and NIRv from MODIS and LandSat and Sentinel satellites. The description of soil moisture stress in
ro
yalsocietypublishing.org/journal/rs
tb
Phil.
Trans.
R.
Soc.
B
375
:
20190505
6biosphere models, based on biophysical and biochemical processes such as plant hydraulics, carbon allocation, and conductance to CO2 of the mesophyll should be
strengthened, supported by state-of-the-art laboratory plant experiments.
(2) It is clear from multiple lines of evidence that the ecological impacts present an accumulation of effects over longer time-scales, with consecutive winter and spring conditions priming the soil and vegetation for large summer impacts. This hysteresis confirms that time-scales of a few months are at play to reach a critical threshold of soil moisture. Seasonal weather forecasts are showing early promise to help predict impacts on NPP and fires [54], for now in regions where the El Niño Southern Oscillation has large control on circulation and rainfall. Similar relationships with the North Atlantic Oscillation have been described in numerous publications for Europe though, including for carbon uptake [55]. Since there is obviously tremen-dous value in longer lead times for predicting drought impacts (also see [56]), our community is tasked to answer the question: What is needed in coupled land-sur-face modelling to capture such impacts in seasonal forecasts of weather, vegetation state and carbon exchange?
(3) In the relationship between drought impacts, and their process understanding, it is clear that different networks of observations play synergetic roles. Satellite remote sen-sing is emerging as an exciting way to see (proxies of)
the top levels of the soils dry out, such as the browndown of vegetation, loss of optimal canopy structure, crop development rates and fires. Their imaging allows us to track the temporal progression of the drought impacts, and geographical extent of events. But the holy grail of better predictability, and hence mitigation, of drought impacts requires process understanding which in turn requires long-term monitoring and commitment for fund-ing and operatfund-ing the infrastructures. This includes all scales and all coupled systems affected by drought: soils, roots, trunks, leaves, canopies, fields, turbulent surface layers, planetary boundary layers, ecosystems, weather sys-tems and continents. Research should focus on integrating these data streams and user needs, taking full advantage of pan-European standardized infrastructures to advance beyond single-discipline papers.
We feel that the work presented here creates ample opportu-nity for further research on these themes, while building on the growing observational capacity and demonstrated ability to collaborate across disciplines.
Data accessibility.This article has no additional data.
Authors’ contributions. W.P. and A.B. wrote the paper with extensive contributions from P.P.C. and A.V.
Competing interests.We declare we have no competing interests.
Funding.We received no funding for this study.
Acknowledgements. We thank Bart van Stratum (Wageningen University) for providing the scripts to make figure 1.
References
1. Barriopedro D, Sousa PM, Trigo RM, García-Herrera R, Ramos AM. 2019 The exceptional Iberian heatwave of summer 2018. Bull. Am. Meteor. Soc. 101, S29–S34. (doi:10.1175/BAMS-D-19-0159.1) 2. Leach NJ, Li S, Sparrow S, van Oldenborgh GJ, Lott
FC, Weisheimer A, Allen MR. 2020 Anthropogenic influence on the 2018 summer warm spell in Europe: the impact of different spatio-temporal scales. Bull. Am. Meteorol. Soc. 101, S41–S46. (doi:10.1175/BAMS-D-19-0201.1)
3. Yiou P et al. 2020 Analyses of the Northern European summer heatwave of 2018. Bull. Am. Meteorol. Soc. 101, S35–S40. (doi:10.1175/BAMS-D-19-0170.1)
4. Krikken F, Lehner F, Haustein K, Drobyshev I, van Oldenborgh GJ. In press. Attribution of the role of climate change in the forest fires in Sweden 2018. Nat. Hazards Earth Syst. Sci. Discuss. 2019. (doi:10. 5194/nhess-2019-206)
5. Buras A, Rammig A, Zang CS. 2020 Quantifying impacts of the 2018 drought on European ecosystems in comparison to 2003. Biogeosciences 17, 1655–1672. (doi:10.5194/bg-17-1655-2020) 6. Quesada B, Vautard R, Yiou P, Hirschi M,
Seneviratne SI. 2012 Asymmetric European summer heat predictability from wet and dry southern winters and springs. Nat. Climate Change 2, 736–741. (doi:10.1038/nclimate1536)
7. Miralles DG, Teuling AJ, van Heerwaarden CC, de Arellano JV-G. 2014 Mega-heatwave temperatures
due to combined soil desiccation and atmospheric heat accumulation. Nat. Geosci. 7, 345–349. (doi:10. 1038/ngeo2141)
8. Luterbacher J, Liniger MA, Menzel A, Estrella N, Della-Marta PM, Pfister C, Rutishauser T, Xoplaki E. 2007 Exceptional European warmth of autumn 2006 and winter 2007: historical context, the underlying dynamics, and its phenological impacts. Geophys. Res. Lett. 34, L12704. (doi:10.1029/2007gl029951) 9. Mueller B, Seneviratne SI. 2012 Hot days induced by
precipitation deficits at the global scale. Proc. Natl Acad. Sci. USA 109, 12 398–12 403. (doi:10.1073/ pnas.1204330109)
10. Drouard M, Kornhuber K, Woollings T. 2019 Disentangling dynamic contributions to summer 2018 anomalous weather over Europe. Geophys. Res. Lett. 46, 12 537–12 546. (doi:10.1029/2019GL084601) 11. Ciais PP et al. 2005 Europe-wide reduction in
primary productivity caused by the heat and drought in 2003. Nature 437, 529–533. (doi:10. 1038/nature03972)
12. Flach M, Sippel S, Gans F, Bastos A, Brenning A, Reichstein M, Mahecha MD. 2018 Contrasting biosphere responses to hydrometeorological extremes: revisiting the 2010 western Russian heatwave. Biogeosciences 15, 6067–6085. (doi:10. 5194/bg-15-6067-2018)
13. Ramonet M et al. 2010 A recent build-up of atmospheric CO2over Europe. Part 1: Observed
signals and possible explanations. Tellus B Chem
Phys. Meteorol. 62, 1–13. (doi:10.1111/j.1600-0889. 2009.00442.x)
14. Drought 2018 Team, ICOS Ecosystem Thematic Centre. 2020‘Drought-2018 ecosystem eddy covariance flux product for 52 stations in FLUXNET-Archive format’. (doi:10.18160/YVR0-4898) 15. Drought. 2018 Team, ICOS Atmosphere Thematic
Centre. 2020 Drought-2018 atmospheric CO2
molefFraction product for 48 stations (96 sample heights). (doi:10.18160/ERE9-9D85)
16. Keenan T, Sabate S, Gracia C. 2010 Soil water stress and coupled photosynthesis–conductance models: bridging the gap between conflicting reports on the relative roles of stomatal, mesophyll conductance and biochemical limitations to photosynthesis. Agric. For. Meteorol. 150, 443–453. (doi:10.1016/j. agrformet.2010.01.008)
17. Zhou S-X, Prentice IC, Medlyn BE. 2019 Bridging drought experiment and modeling: representing the differential sensitivities of leaf gas exchange to drought. Front. Plant Sci. 9, 7063. (doi:10.3389/fpls. 2018.01965)
18. Medlyn BE et al. 2011 Reconciling the optimal and empirical approaches to modelling stomatal conductance. Glob. Change Biol. 17, 2134–2144. (doi:10.1111/j.1365-2486.2010.02375.x) 19. Egea G, Verhoef A, Vidale PL. 2011 Towards an
improved and more flexible representation of water stress in coupled photosynthesis in stomatal conductance models. Agric. For.
ro
yalsocietypublishing.org/journal/rs
tb
Phil.
Trans.
R.
Soc.
B
375
:
20190505
7Meteorol. 151, 1370–1384. (doi:10.1016/j. agrformet.2011.05.019)
20. Stocker BD, Zscheischler J, Keenan TF, Prentice IC, Peñuelas J, Seneviratne SI. 2018 Quantifying soil moisture impacts on light use efficiency across biomes. New Phytol. 218, 1430–1449. (doi:10.1111/nph.15123)
21. Vetter M et al. 2008 Analyzing the causes and spatial pattern of the European 2003 carbon flux anomaly using seven models. Biogeosciences 5, 561–583. (doi:10.5194/bg-5-561-2008) 22. Piao S et al. 2013 Evaluation of terrestrial carbon
cycle models for their response to Climate variability and to CO2trends. Glob. Change Biol. 19,
2117–2132. (doi:10.1111/gcb.12187)
23. Peters W et al. 2018 Increased water-use efficiency and reduced CO2uptake by plants during droughts
at a continental scale. Nat. Geosci. 11, 744–748. (doi:10.1038/s41561-018-0212-7)
24. Bastos A et al. 2020 Direct and seasonal legacy effects of the 2018 heat wave and drought on European ecosystem productivity. Sci. Adv. 6, eaba2724. (doi:10.1126/sciadv.aba2724) 25. Kornhuber K, Osprey S, Coumou D, Petri S,
Petoukhov V, Rahmstorf S, Gray L. 2019 Extreme weather events in early summer 2018 connected by a recurrent hemispheric wave-7 pattern. Environ. Res. Lett. 14, 054002. (doi:10.1088/1748-9326/ ab13bf )
26. Kornhuber K, Coumou D, Vogel E, Lesk C, Donges JF, Lehmann J, Horton RM. 2020 Amplified Rossby waves enhance risk of concurrent heatwaves in major breadbasket regions. Nat. Climate Change 10, 48–53. (doi:10.1038/s41558-019-0637-z) 27. McCarthy M et al. 2019 Drivers of the UK summer
heatwave of 2018. Weather 74, 390–396. (doi:10. 1002/wea.3628)
28. Kendon M, McCarthy M, Jevrejeva S, Matthews A, Legg T. 2019 State of the UK climate 2018. Int. J. Climatol. 39 (Suppl. 1), 1–55. (doi:10.1002/ joc.6213)
29. Barriopedro D, Fischer EM, Luterbacher J, Trigo RM, García-Herrera R. 2011 The hot summer of 2010: redrawing the temperature record map of Europe. Science 332, 220–224. (doi:10.1126/science. 1201224)
30. Beillouin D, Schauberger B, Bastos A, Ciais P, Makowski D. 2020 Impact of extreme weather conditions on European crop production in 2018. Phil. Trans. R. Soc. B 375, 20190510. (doi:10.1098/ rstb.2019.0510)
31. Combe M, de Arellano JV-G, Ouwersloot HG, Peters W. 2016 Plant water-stress parameterization determines the strength of land–atmosphere coupling. Agric. For. Meteorol. 217, 61–73. (doi:10. 1016/j.agrformet.2015.11.006)
32. ESA. 2017 Land Cover CCI product user guide version 2. Tech. rep. See maps.elie.ucl.ac.be/CCI/viewer/ download/ESACCI-LC-Ph2-PUGv2_2.0.pdf. 33. Bastos A et al. 2020 Impacts of extreme summers
on European ecosystems: a comparative analysis of 2003, 2010 and 2018. Phil. Trans. R. Soc. B 375, 20190507. (doi:10.1098/rstb.2019.0507) 34. Fischer EM, Seneviratne SI, Lüthi D, Schär C. 2007
Contribution of land-atmosphere coupling to recent European summer heat waves. Geophys. Res. Lett. 34, L06707. (doi:10.1029/2006GL029068) 35. Vogel MM, Zscheischler J, Wartenburger R, Dee D,
Seneviratne SI. 2019 Concurrent 2018 hot extremes across Northern Hemisphere due to human-induced climate change. Earth’s Future 7, 692–703. (doi:10. 1029/2019EF001189)
36. Toreti A et al. 2019 The exceptional 2018 European water seesaw calls for action on adaptation. Earth’s Future 7, 652–663. (doi:10.1029/2019EF001170) 37. Samaniego L et al. 2018 Anthropogenic warming
exacerbates European soil moisture droughts. Nat. Climate Change 8, 421–426. (doi:10.1038/s41558-018-0138-5)
38. Ramonet M et al. 2020 The fingerprint of the summer 2018 drought in Europe on ground-based atmospheric CO2measurements. Phil.
Trans. R. Soc. B 375, 20190513. (doi:10.1098/rstb. 2019.0513)
39. Henne S, Brunner D, Folini D, Solberg S, Klausen J, Buchmann B. 2010 Assessment of parameters describing representativeness of air quality in-situ measurement sites. Atmos. Chem. Phys. 10, 3561–3581. (doi:10.5194/acp-10-3561-2010) 40. Rödenbeck C, Zaehle S, Keeling R, Heimann M.
2020 The European carbon cycle response to heat and drought as seen from atmospheric CO2data for
1999–2018. Phil. Trans. R. Soc. B 375, 20190506. (doi:10.1098/rstb.2019.0506)
41. Thompson RL et al. 2020 Changes in net ecosystem exchange over Europe during the 2018 drought based on atmospheric observations. Phil. Trans. R. Soc. B 375, 20190512. (doi:10.1098/rstb.2019.0512) 42. Smith NE et al. 2020 Spring enhancement and
summer reduction in carbon uptake during the 2018 drought in northwestern Europe. Phil. Trans. R. Soc. B 375, 20190509. (doi:10.1098/rstb. 2019.0509)
43. Kowalska N,Šigut L, Stojanović M, Fischer M, Kyselova I, Pavelka M. 2020 Analysis of floodplain forest sensitivity to drought. Phil. Trans. R. Soc. B 375, 20190518. (doi:10.1098/rstb.2019.0518) 44. Lindroth A et al. 2020 Effects of drought and
meteorological forcing on carbon and water fluxes in Nordic forests during the dry summer of 2018. Phil. Trans. R. Soc. B 375, 20190516. (doi:10.1098/ rstb.209.0516)
45. El-Madany TS et al. 2020 Drought and heatwave impacts on semi-arid ecosystems’ carbon fluxes along a precipitation gradient. Phil. Trans. R. Soc. B 375, 20190519. (doi:10.1098/rstb.2019.0519) 46. Gourlez de la Motte L et al. 2020 Non-stomatal
processes reduce gross primary productivity in temperate forest ecosystems during severe edaphic drought. Phil. Trans. R. Soc. B 375, 20190527. (doi:10.1098/rstb.209.0527)
47. Fu Z et al. 2020 Sensitivity of gross primary productivity to climatic drivers during the summer drought of 2018 in Europe. Phil. Trans. R. Soc. B 375, 20190747. (doi:10.1098/rstb.209.0747) 48. Gharun M et al. 2020 Physiological response of
Swiss ecosystems to 2018 drought across plant types and elevation. Phil. Trans. R. Soc. B 375, 20190521. (doi:10.1098/rstb.209.0521)
49. Graf A et al. 2020 Altered energy partitioning across terrestrial ecosystems in the European drought year 2018. Phil. Trans. R. Soc. B 375, 20190524. (doi:10. 1098/rstb.209.0524)
50. Rinne J et al. 2020 Effect of the 2018 European drought on methane and carbon dioxide exchange of northern mire ecosystems. Phil. Trans. R. Soc. B 375, 20190517. (doi:10.1098/rstb.2019.0517) 51. Verhoef A, Egea G. 2014 Modeling plant
transpiration under limited soil water: comparison of different plant and soil hydraulic
parameterizations and preliminary implications for their use in land surface models. Agric. For. Meteorol. 191, 22–32. (doi:10.1016/j.agrformet. 2014.02.009)
52. Dewar R, Mauranen A, Mäkelä A, Hölttä T, Belinda M, Vesala T. 2018 New insights into the covariation of stomatal, mesophyll and hydraulic conductances from optimization models incorporating nonstomatal limitations to photosynthesis. New Phytol. 217, 571–585. (doi:10.1111/nph.14848) 53. Koebsch F, Gottschalk P, Beyer F, Wille C, Jurasinski
G, Sachs T. 2020 The impact of occasional drought periods on vegetation spread and greenhouse gas exchange in rewetted fens. Phil. Trans. R. Soc. B 375, 20190685. (doi:10.1098/rstb.2019.0685) 54. Bett PE, Williams KE, Burton C, Scaife AA, Wiltshire
AJ, Gilham R. 2020 Skillful seasonal prediction of key carbon cycle components: NPP and fire risk. Environ. Res. Commun. 2, 055002. (doi:10.1088/ 2515-7620/ab8b29)
55. Bastos A et al. 2016 European land CO2sink
influenced by NAO and East-Atlantic pattern coupling. Nat. Commun. 7, 10315. (doi:10.1038/ ncomms10315)
56. Sutanto SJ, van der Weert M, Wanders N, Blauhut V, Van Lanen HAJ. 2019 Moving from drought hazard to impact forecasts. Nat. Commun. 10, 4945. (doi:10.1038/s41467-019-12840-z)