HAL Id: hal-00316872
https://hal.archives-ouvertes.fr/hal-00316872
Submitted on 1 Jan 2001
HAL is a multi-disciplinary open access
archive for the deposit and dissemination of
sci-entific research documents, whether they are
pub-lished or not. The documents may come from
teaching and research institutions in France or
abroad, or from public or private research centers.
L’archive ouverte pluridisciplinaire HAL, est
destinée au dépôt et à la diffusion de documents
scientifiques de niveau recherche, publiés ou non,
émanant des établissements d’enseignement et de
recherche français ou étrangers, des laboratoires
publics ou privés.
L. Xu, A. V. Koustov, J. Thayer, M. A. Mccready
To cite this version:
L. Xu, A. V. Koustov, J. Thayer, M. A. Mccready. SuperDARN convection and Sondrestrom plasma
drift. Annales Geophysicae, European Geosciences Union, 2001, 19 (7), pp.749-759. �hal-00316872�
SuperDARN convection and Sondrestrom plasma drift
L. Xu1, A. V. Koustov1, J. Thayer2, and M. A. McCready2
1Institute of Space and Atmospheric Studies, University of Saskatchewan, Saskatoon, Canada 2SRI International, Menlo Park, California, USA
Received: 20 December 1999 – Revised: 6 June 2001 – Accepted: 12 June 2001
Abstract. Plasma convection measurements by the Goose
Bay and Stokkseyri SuperDARN radar pair and the Sondre-strom incoherent scatter radar are compared in three differ-ent ways, by looking at the line-of-sight (l-o-s) velocities, by comparing the SuperDARN vectors and corresponding Son-drestrom l-o-s velocities and by comparing the end products of the instruments, the convection maps. All three compar-isons show overall reasonable agreement of the convection measurements though the data spread is significant and for some points a strong disagreement is obvious. The convec-tion map comparison shows a tendency for the SuperDARN velocities to be often less than the Sondrestrom drifts for strong flows (velocities > 1000 m/s) and larger for weak flows (velocities < 500 m/s). On average, both effects do not exceed 35%. Data indicate that inconsistencies between the two data sets occur largely at times of fast temporal vari-ations of the plasma drift and for strongly irregular flow ac-cording to the SuperDARN convection maps. These facts indicate that the observed discrepancies are in many cases a result of the different spatial and temporal resolutions of the instruments.
Key words. Ionosphere (ionospheric irregularities; plasma
convection; polar ionosphere)
1 Introduction
Plasma convection in the high-latitude ionosphere is a key parameter describing energy transfer from the solar wind to the magnetosphere and the ionosphere. Convection patterns have been studied by several methods; over the last two deca-des the most popular were direct satellite measurements (e.g. Hairston and Heelis, 1990), incoherent scatter radar measure-ments (e.g. Foster, 1983; Senior et al., 1990) and coherent radar measurements (Greenwald et al., 1995; Ruohoniemi and Greenwald, 1996). There are certain advantages to each Correspondence to: A. V. Koustov
of the above methods. Satellite measurements give informa-tion on a global scale, though data are limited to one trajec-tory and typically to a convection component perpendicular to the satellite path. A monostatic incoherent scatter radar (ISR) provides continuous monitoring of convection either in a very localized region of the ionosphere, with time reso-lution on the order of a few minutes (fixed antenna positions) or over extended regions by continuous scanning of the an-tenna, with time resolution on the order of 4 or more min-utes. Super Dual Auroral Radar Network (SuperDARN) HF coherent radars, which gained popularity in the 1990s, have a reasonable time resolution of 2 min and significantly larger spatial coverage than incoherent scatter radars. However, the SuperDARN radars often suffer from the lack of echoes ei-ther due to the absence of ionospheric irregularities or due to strong HF radio wave absorption in the ionosphere.
Though each of the above methods, as conceived, provides plasma convection vectors, different spatial and temporal res-olutions of the systems and specifics of their operation modes can lead to different values for plasma convection. A thor-ough and systematic intercomparison between different sys-tems monitoring plasma convection has not been published yet, though the electric field data are widely distributed to the space science community.
In this paper, we compare plasma convection estimates as given by SuperDARN and the ISR at Sondrestrom, Green-land. The main objective of this study is an assessment of these systems’ plasma convection measurements by consid-ering three different approaches. The first is a straight line-of-sight (l-o-s) velocity comparison at about the same loca-tions and direcloca-tions. The second approach is a comparison of SuperDARN convection vectors with the l-o-s velocity mea-sured by the Sondrestrom ISR. These two approaches have also been employed in the past, as described in the next sec-tion. A new approach considered below is a comparison of 2-dimensional vectors inferred from SuperDARN convection maps and Sondrestrom convection profiles along the merid-ian.
2 Review of previous work
Both methods of plasma convection measurements, using coherent and incoherent radar observations, are well estab-lished (e.g. Greenwald et al., 1995 and Kelley et al., 1995). An incoherent scatter radar measures the l-o-s velocity with high accuracy provided that a sufficient amount of iono-spheric electrons are present to produce strong return sig-nals. For the Sondrestrom ISR, electron densities exceeding 1×104 cm−3 are necessary to provide adequate return sig-nals. The ISR-derived velocity corresponds to a bulk motion of the F region thermal plasma fluctuations and thus repre-sents the true plasma convection in the ionosphere. Depend-ing on the antenna sequence, the assumptions made when calculating the plasma convection vary. Overhead measure-ments employing discreet beam dwells near zenith assume spatial homogeneity over a small region and temporal stabil-ity over a few minutes.
For the Sondrestrom ISR data discussed here, the tech-nique relies on scanning the antenna to combine individual l-o-s measurements from identical latitudes but different lon-gitudes to yield a resolved velocity. This technique assumes longitudinal homogeneity (not exceeding a few hundred kilo-meters in the F region) as well as temporal stability (four minutes or less) and ignores the component of the velocity parallel to the magnetic field. Thus, even though direct mea-surements of this radar are of high accuracy, a number of adopted assumptions places certain limitations on this instru-ment.
Coherent HF radars also measure the l-o-s Doppler veloc-ity, but this velocity corresponds to the drift velocity of iono-spheric plasma irregularities. To estimate the convection, one has to assume that plasma irregularities in the F region move with the velocity close to the E×B drift of electrons and ions. In addition, to make a vector of plasma convection, one has to assume that the observed l-o-s velocity is a cosine component of the total plasma drift vector (thus also ignoring velocities parallel to the magnetic field).
It is expected that differences between coherent and in-coherent radar methods of velocity determination are small (Ruohoniemi et al., 1987). In the past, several attempts have been made to assess how compatible are the convection esti-mates from these two techniques.
Villain et al. (1985) and Ruohoniemi et al. (1987) were the first who compared the HF radar Doppler velocities along a specific radar beam with plasma convection measurements performed by ISRs along the HF beam, using the EISCAT and Sondrestrom radars, respectively. Both studies found reasonable agreement of the HF radar estimated convec-tion and convecconvec-tion measured independently. Later Baker et al. (1990) and Grant et al. (1995) found that HF-inferred convection velocity corresponds reasonably well to satellite plasma drift measurements and to plasma drifts derived from ionosonde drift observations.
There have been, however, some differences that were not the primary focus. For example, data presented by Ruo-honiemi et al. (1987) show that the Goose Bay l-o-s
veloci-Goose Bay Sondrestrom Stokkseyri -40 #1 #12 #24 #13 50 60 70 -80 -60 -20 Λ=70 0 Λ=80 0
Fig. 1. Viewing zones of the Goose Bay and Stokkseyri
Super-DARN HF radars, location of the Sondrestrom incoherent scatter radar (circle) and an ionospheric area (outlined by crosses) through which the Sondrestrom radar has been scanning for plasma drift measurements (at a height of 400 km). The direction of the Sondre-strom radar beam cycling was from the beam position correspond-ing to point #1 to beam position #12 and, after quick antenna reposi-tioning, from direction #13 to direction #24. Also shown are PACE lines of equal magnetic latitudes 3=70◦and 3=80◦. The dark band indicates one of the regions used for data averaging.
ties are sometimes larger than plasma drifts (according to the Sondrestrom ISR) for strong drifts of more than 600 m/s (see their Fig. 11). Data of Baker et al. (1990) show the opposite effect in some measurements; the Halley radar l-o-s veloc-ities are smaller than plasma drifts observed by the DMSP satellite (see their Fig. 3, latitudes around 69◦).
Recently, a more comprehensive comparison of HF l-o-s velocities and corresponding plasma drifts measured by EIS-CAT along the Finland CUTLASS HF radar beam #5 was reported by Davies et al. (1999). The authors concluded that there was an overall reasonable correspondence between measurements. However, inspection of individual points show significant data spread so that velocities differ by 2 or more at times. Also, these data show a general tendency for the HF l-o-s velocities to be smaller than the EISCAT measured drifts (the slope of the linear regression line is 0.7, Fig. 6).
3 Observations
In this study, data gathered by the Goose Bay-Stokkseyri Su-perDARN radar pair are compared with measurements by the Sondrestrom ISR located in Greenland (67◦N, 51◦W, mag-netic latitude 74.2◦). Two events, 10 March 1998 and 3 June 1998 are considered.
3.1 Experiment configuration
Figure 1 shows an experiment setup with the field of view of the Goose Bay-Stokkseyri radar pair and the area, outlined
Fig. 2. Average plasma drifts (panel (a) for the magnitude, panel
(b) for the azimuth) at magnetic latitudes of 74.75◦–75.25◦ ac-cording to the Sondrestrom ISR (solid small circles and line) and Stokkseyri-Goose Bay HF radars (15 min averages; open circles) on 10 March 1998. Azimuth was counted clockwise from the direc-tion of geographic north.
by crosses, where convection measurements have been car-ried out by the Sondrestrom ISR (circle). The ISR is located at a distance of ∼1600 km from Goose Bay, between beam positions #10 and #11 (the azimuth from Goose Bay is 15◦ east of north) and at ∼1400 km from Stokkseyri (the azimuth is 62◦west of north), between beam positions #6 and #7. The dark band on Fig. 1 indicates one of the regions (centered on 76◦invariant latitude) that will be used later for data averag-ing.
The SuperDARN radars (Greenwald et al., 1995) were op-erated in the standard mode with their beams being scanned through 16 azimuthal positions with common fields of view (see Fig. 1). The duration of one full scan was about 2 min. Scatter from all possible ranges (180 km – 3000 km) with a 45 km gate was recorded. Recorded l-o-s velocities of indi-vidual radars were then merged at the radar beam crossings to obtain convection maps.
A detailed description of the Sondrestrom ISR can be found in Kelly et al. (1995) and references therein. For the two sets of Sondrestrom measurements analyzed for this study, the antenna operated in a mode designed to give high-temporal resolution measurements of the plasma convection versus latitude. The resolution of the transmitted pulses used for both these data sets was 48 km. The antenna mode and velocity resolving technique are described here, followed by a summary of its limitations.
The antenna performed alternating composite scans at a variable rate that gives constant ground tracking. These com-posite scans move the antenna in both azimuth and elevation such that it defines a plane parallel to the PACE magnetic meridian but offset to the magnetic east or west by 25◦ de-grees of elevation at the zenith. (The elevation at the ends of
Fig. 3. The same as in Fig. 2 but for the 3 June 1998 event at
latitudes of 75.75◦–76.25◦.
the scans is 30◦, and is 65◦as the scan “passes” the latitude of the radar site, to the east or west.) The scans are centered on 333◦azimuth so they are perpendicular to the local L shell. The “west” scan begins in the northwest and scans through the west to the southwest (all in the magnetic frame). The antenna is then quickly driven from the end of that scan to the beginning of the “east” scan, which takes approximately 30 s. The antenna then scans from the northeast, through the east, and ends in the southeast, and the cycle repeats by re-turning to the beginning of the west scan. For the data from 10 March 1998, the scans took four minutes each. The data were integrated for 20 s, giving 12 records per scan. The scans from 3 June 1998 took 5 1/2 min each, and the data were integrated for 24 s, giving 14 records per scan. The crosses in Fig. 1 show the location of the middle of the radar beam for each integrated record at an altitude of 400 km for the antenna scans of 10 March 1998.
The resolved velocities are estimated by combining the l-o-s velocities from gates above 180 km altitude from the east and west scans. The range gates from the first record of the west scan are combined with those of the first record of the east scan. Each range gate has a unique magnetic latitude and a corresponding range gate from the opposite scan. After the west scan has been combined with the east scan to produce a full set of resolved velocities versus latitude, the data from the original east scan are then combined with the data from the next west scan, and so on. In summary, data have been combined from two different regions to produce one vector, and that vector is assigned to the latitude of the two disparate l-o-s velocities. The spatial separation of the two original points increases with increasing range/altitude.
Using this technique to estimate the resolved velocity, the velocity parallel to B is assumed to be zero, and longitudi-nal homogeneity and temporal stability are assumed as well. Obviously, if there are longitudinal differences in the flow (for instance, due to a shear reversal that is not parallel to
the L shell) or temporal changes from one scan to the next (as would happen with a substorm onset), then the validity of this technique is compromised.
In this paper we also compare directly measured l-o-s ve-locities as observed by the two systems for some beam posi-tions. The geometry and details of this comparison are given in Sect. 3.3.
3.2 Overview of the events
Figures 2 and 3 give a general idea of the ionospheric con-vection magnitude and direction for the two days. Here the Sondrestrom ISR data for latitudes around 75◦and 76◦ re-spectively are presented by solid small circles while HF radar data (15 min averages) at about the same latitudes are shown by open circles.
The 10 March 1998 data (Fig. 2) span more than 6 hours. The magnitude of plasma flow varied between 100 m/s and 1500 m/s and the flow direction changed from eastward at the beginning of observations (1000–1300 UT) to westward in the middle (1330 –1500 UT) part and to preferentially north-eastward flow at the end of the event. Such large variations in the plasma flow provided an excellent opportunity for the SuperDARN/Sondrestrom comparison over a wide range of convection magnitude and direction.
Sondrestrom observations for the 3 June 1998 event (Fig. 3) also cover a long period (almost 8 hours), but Su-perDARN data are primarily available for the period 1000– 1330 UT. As one can see, the plasma flows are fairly slow, mostly less than 500 m/s. This might be the reason for the low echo occurrence in this event. Another factor contribut-ing to the low echo occurrence could be enhanced radio wave absorption; this event occurred during summer. Convection azimuth variations are also significant.
SuperDARN data for both events roughly show the same trends, though there are differences, both in magnitude and azimuth. In the next sections, the Sondrestrom and Super-DARN convection data are compared in more detail. 3.3 Range profiles for the line-of-sight velocity
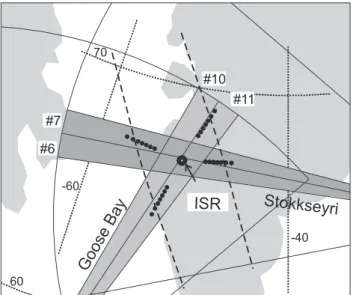
We start exploring the ISR and SuperDARN velocity data by directly comparing the l-o-s velocities in a fashion similar to Ruohoniemi et al. (1987). Figure 4 explains the approach. Here the orientation of the Stokkseyri beams #6 and #7 and the Goose Bay beams #10 and # 11 are shown, as well as the ionospheric areas where the ISR l-o-s velocity measure-ments have been carried out. Only those Sondrestrom beam positions have been considered that were well inside the HF radar beams, so that direct comparison of measured veloci-ties is justifiable.
For the comparison, all distances were counted from the HF radar locations, either from Stokkseyri or Goose Bay. One should mention that with HF data, there is always some uncertainty in the actual position of the scattering area (Ruo-honiemi et al., 1987; Andr´e et al., 1996). The altitude of mea-surements is one of the factors. We believe that SuperDARN
60 70 -60
Stokkseyri
Goose
Bay
-40ISR
#10 #11 #6 #7Fig. 4. A map showing the orientation of specific SuperDARN radar
beams and the ISR. The closed circles indicate the Sondrestrom ISR range gates used for l-o-s velocity measurements from four specific beam positions that fall within one of four SuperDARN beams. Po-sitions of the Stokkseyri beams #6 and #7 and the Goose Bay radar beams #10 and #11 are only indicated; for these beams the Sondre-strom measurements were well aligned and within the central parts of them. Large open circle indicates the position of the Sondrestrom ISR.
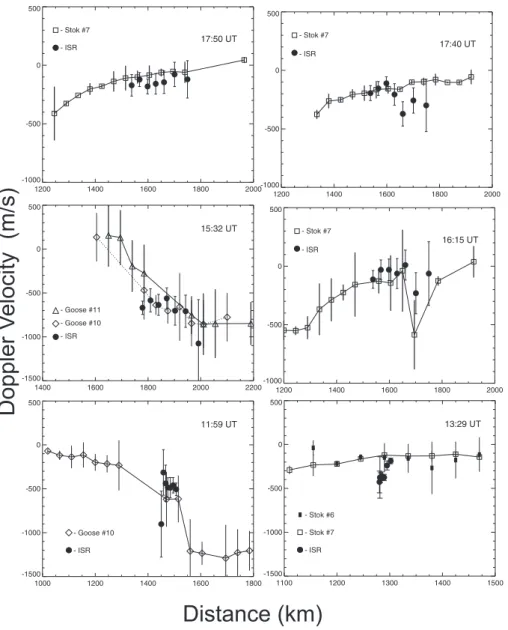
measurements considered in this study have been performed in the F region through direct propagation mode. Two sup-porting arguments are that the distances considered are well beyond over-the-horizon distances for the E region echoes, and elevation angle measurements for most of the periods in-dicate moderate angles of about 15◦–20◦, suggesting direct F region scatter. Scatter from the F region can come from a wide range of altitudes, so that an uncertainty in the echo lo-cation as large as 50–100 km is possible (Andr´e et al., 1996). In Fig. 5 we compare the profiles of HF and ISR l-o-s ve-locities (horizontal component) for six periods of observa-tions on 10 March 1998. Here closed solid circles repre-sent the ISR measurements, while squares, triangles and di-amonds show the HF radar velocities. For Sondrestrom, the polarity of the velocity was changed if the radar was look-ing toward the Stokkseyri radar. The left column of panels in Fig. 5 shows periods for which agreement between HF and ISR observations is reasonable. At 1750 UT, it is good in almost all points. Moreover, one can see that even if the position of Sondrestrom measurements has to be moved by 50–100 km along the ranges of the Stokkseyri radar, agree-ment is still reasonably good. The next frame, 1532 UT, shows a more complicated situation with a transition of con-vection from −600 m/s at near range 1800 km to −900 m/s at 2000 km. Sondrestrom data “reproduce” this variation quite well. The next frame, 1159 UT, shows reasonable agreement between the Goose Bay and Sondrestrom velocities for an event where there was a strong variation within the range of the Goose Bay echoes; the l-o-s velocity changed from −100
Distance (km)
Doppler
V
elocity
(m/s)
Fig. 5. Comparison of range profiles
for the HF l-o-s velocity (squares, trian-gles and diamonds) and incoherent scat-ter l-o-s velocity (solid circles) on 10 March 1998. For clarity, error bars are increased by four times. Indicated time corresponds to the moments of the Son-drestrom measurements; SuperDARN data are obtained within 1 min from the marked time.
m/s at 1000 km to −1200 m/s at 1600 km. Sondrestrom drifts are quite consistent with the Goose Bay measurements at dis-tances of 1500 km, except one point, located away from a general cluster. We should note that such “anomalous” points have been observed in both SuperDARN and Sondrestrom data and they might be one of the reasons for significant in-consistencies in the total vectors.
At 1740 UT, the judgment on consistency is more compli-cated. At distances of 1500–1600 km, the SuperDARN/Son-drestrom velocities agree perfectly, while at larger distances different trends are very obvious with velocity differences as large as 250 m/s. The next frame, 1615 UT, illustrates the situation where HF data show a very clear negative peak in the velocity at 1700 km. One might even think that this is an anomalous point. However, the Sondrestrom velocity fol-lows a similar range profile with a spike at 1700 km, though not as strong as seen in the SuperDARN data. One should mention that there are significantly stronger uncertainties in the SuperDARN velocity measurements for this frame, so
that this might be a reason for the observed differences with Sondrestrom measurements. The last frame, 1329 UT, shows that even for quite smoothly varying HF velocity range pro-files in two Stokkseyri radar beams, there is a significantly different Sondrestrom velocity. For this frame, the difference is 250 m/s. We should stress that this example is not unique; larger differences sometimes have been observed.
3.4 Projected Sondrestrom line-of-sight velocity and Su-perDARN convection
The previous section demonstrates that l-o-s velocities mea-sured by the SuperDARN and Sondrestrom radars agree well in most cases but definitely not in all. To extend the com-parison further we try a more complicated approach simi-lar to Ruohoniemi et al. (1987) and Davies et al. (1999). Namely, we consider every 2 min SuperDARN convection map as an ideal representation of the plasma drift. Within every 2 min interval we consider those Sondrestrom beams
Sondrestrom Equivalent Drift (m/s)
SuperDARN
Convection
Magnitude
(m/s)
Fig. 6. Comparison of the HF radar convection magnitude and the
ISR l-o-s velocities projected on the SuperDARN radar vectors.
(measurements of the l-o-s velocity) for which the radar cells are located within a 40 km circle of distance from any of the SuperDARN vectors. Typically, the time difference be-tween the Sondrestrom l-o-s velocity measurements and the SuperDARN convection vectors was on the order of 1 min. The Sondrestrom l-o-s velocity from a qualified cell is then projected onto the matched SuperDARN convection vector direction by considering the azimuth difference. The result of this comparison for the 10 March and 3 June events is pre-sented in Fig. 6.
Clearly, the majority of points lie around the bisector rep-resenting the line of ideal correspondence. One would ex-pect a reasonable agreement, bearing in mind a good corre-spondence of l-o-s velocities, as discussed in previous sec-tion. Certainly, there are some points in strong disagree-ment. Analysis shows that many of these points were ob-tained during periods of strong plasma flow changes, in time and in space. For example, we indicate in Fig. 6a a cluster of points that was obtained around 1515 UT on 10 March 1998 when observations were made near the convection reversal (see data presented in the next section). However, there is no such a single or direct explanation apparent in the Super-DARN data for all discrepancies.
3.5 2-D convection comparison, approach to averaging It is clear that the experiment configuration does not allow us to perform a point-by-point 2-D comparison, neither in time nor in space. To make such a comparison credible in terms of time, we averaged the SuperDARN data over 6 min inter-vals (three scans) corresponding to each individual Sondre-strom point by including only those SuperDARN measure-ments that were obtained during intervals as close as possible
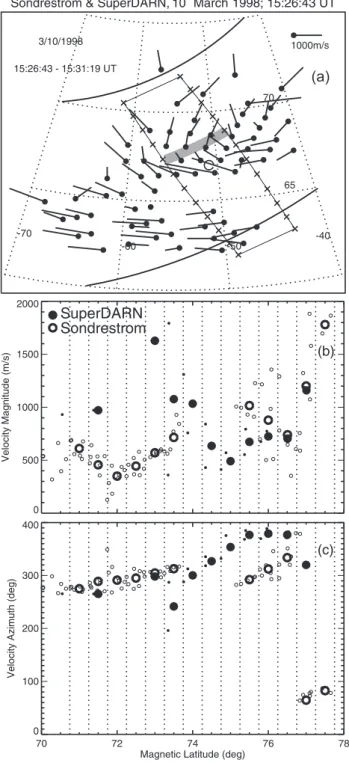
Fig. 7. SuperDARN and Sondrestrom data for 10 March 1998, 1252
UT. (a) A SuperDARN map of ionospheric plasma convection in the standard format. The area of the Sondrestrom ISR measure-ments is shown by crosses. L-shell aligned stripe represents one of the “boxes” for which the ISR and HF radar data were averaged and compared. (b) Meridional profiles of plasma flow magnitude. Small open circles and dots indicate the original ISR and Super-DARN data, large open circles and large solid circles indicate aver-aged values. (c) Meridional profiles of plasma flow azimuth. Sym-bol meaning is the same as for (b). Azimuth was counted clockwise from the direction of geographic north.
vection maps for 10 March 1998. For the first frame, Fig. 7a (12:52:43 UT), the flow is northeastward and fairly uniform, though the number of vectors within the Sondrestrom “box” of measurements is not high. The magnitudes of vectors are about the same in the eastern and western edges of the Son-drestrom box, though some differences are evident at lati-tudes around 77◦.
For the second frame, Fig. 8a (15:26:00 UT), a strong rota-tional flow is evident; the flow is westward at latitudes 70◦– 73◦and eastward at latitudes higher than 76◦. The convection reversal occurs between latitudes of 74◦and 76◦. Although the convection vectors are of different magnitudes at the east-ern and westeast-ern edges of the Sondrestrom box, at latitudes around 75◦, the differences are not significant.
To make a comparison of Sondrestrom (obtained over the box) and SuperDARN convection vectors plausible spatially, we binned both the SuperDARN and Sondrestrom velocities with 0.5◦bins of magnetic latitude. Such bins for one latitude of 76◦are shown in Figs. 7a and 8a (as well as in Fig. 1). This way, the “effective” latitudinal resolution of the two sets of measurements is comparable. For SuperDARN data, only those points have been considered for which separation from the Sondrestrom magnetic meridian was not more than 200 km, either magnetically westward or eastward (vector inside the “box” of Sondrestrom measurements). Since Son-drestrom data showed noticeable variability, only those bins have been considered for which there were at least two Son-drestrom measurements.
3.6 Meridional profiles of convection
Figures 7b, 7c and 8b, 8c show meridional profiles of the SuperDARN and Sondrestrom plasma drift magnitude and azimuth for the corresponding intervals (panels (a)). The Su-perDARN measurements are indicated by solid circles (small circles for individual vectors, large circles for averages over the bin values) while the Sondrestrom measurements are rep-resented by open circles (small circles for individual mea-surements, large circles for averages over the bin values). The azimuth was counted clockwise from geographic north.
In Figs. 7b, 7c, the magnitude of the convection as mea-sured by SuperDARN is about the same as that from Sondre-strom. There are noticeable differences at latitudes around 77◦as expected, since flow, according to SuperDARN mea-surements did not look L-shell homogeneous. The Super-DARN/Sondrestrom differences in azimuth are not large.
In Figs. 8b, 8c, the SuperDARN/Sondrestrom differences in the magnitude and azimuth of the convection are more sig-nificant, overall; SuperDARN points at latitudes equatorward of 73◦and around 77◦have magnitudes 20–40% smaller than the Sondrestrom drifts, though the azimuths agree reasonably well at lower latitudes and differ by 30◦–40◦ at higher lati-tudes.
(a)
Fig. 8. The same as in Fig. 7, but for 1526 UT on 10 March 1998.
3.7 Comparison of averaged velocities
Similar meridional profiles of the averaged convection from both SuperDARN and Sondrestrom measurements have been made for all intervals of reasonable data on 10 March and 3 June. Data are compared in Figs. 9a and 9b by the magnitude and azimuth, respectively. The solid bisectors in Figs. 9a and 9b represent the lines of ideal agreement between measure-ments. If one describes the data by a linear dependence, with the Sondrestrom magnitude as the independent variable, it
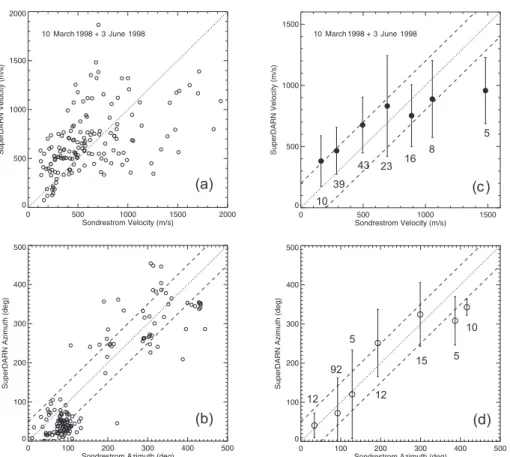
(a) (d) ( ) (b) c 10 12 92 5 12 15 5 10 5 8 16 23 43 39
Fig. 9. SuperDARN-measured plasma
convection versus Sondrestrom-observed plasma drift for (a) the magnitude and (b) for the azimuth for two events, 10 March 1998 and 3 June 1998. Panels (c) and (d) show the binned velocities and azimuths. Dashed line in panel (c) shows a 200 m/s deviation of the velocity from the line of ideal agreement indicated by the dotted line.
can be found that the equation VSD=0.42VI SR+370 is the
best fit to the data points. In terms of the slope, the value of 0.42 is much less than those reported by Davies et al. (1999) and Ruohoniemi et al. (1987).
If one concentrates on data differences, one can see in Fig. 9a two features of the convection magnitude: overall larger SuperDARN velocities at Sondrestrom drifts of less than 500 m/s, and somewhat smaller SuperDARN veloci-ties at Sondrestrom drifts of larger than 1000 m/s. Points of comparative “overestimation” and “underestimation” of more than 35% constitute about 33% of all measurements.
For the convection azimuths, Fig. 9b, differences are typ-ically less than 50◦. The 50◦deviation in azimuth from the line of ideal agreement is shown by the dashed lines. About 75% of the points have a difference of less than 50◦. Notice
that significant inconsistencies occur for the SuperDARN (Sondrestrom) azimuths around ±60◦, from the direction to North. As subsequent analysis showed, many of these points of poor agreement in azimuth occurred for observations near the convection reversal region.
To reveal general trends in the data presented in Figs. 9a, 9b we applied another averaging. The SuperDARN veloc-ity magnitudes were averaged with Sondrestrom bins of 400 m/s and sliding steps of 200 m/s. The SuperDARN velocity azimuths were averaged with Sondrestrom bins of 70◦with 70◦sliding steps. The results are presented in Figs. 9c, 9d, respectively. The numbers at the bottoms of Figs. 9c and 9d indicate the total number of points involved in each
spe-cific bin. We included in this diagram only those boxes of measurements for which there were 5 or more points to com-pare. For the convection magnitude, one can see that the effect of comparative velocity “overestimation” and “under-estimation” can be as large as 30–40%. The dashed lines in Fig. 9c indicate a SuperDARN/Sondrestrom velocity differ-ence of 200 m/s. For the convection azimuth, differdiffer-ences are mostly within ±50◦(shown by dashed lines in panel (d)).
A separate issue concerns a relationship of cases with poor correspondence in magnitudes to cases of poor correspon-dence in azimuths. The overall conclusion from the data is that there is no dominating combination; one can have a poor agreement both in azimuth and magnitude as frequently as a poor agreement only in azimuth.
4 Discussion
The idea of this study was to see whether the plasma convec-tion vectors measured by two radar techniques are the same if one uses similar temporal and spatial “post-processing” res-olutions. The data presented in this study, to a large extent, confirm the previously reported conclusion that the convec-tion velocities inferred from HF Doppler data correspond, to a first approximation, to the plasma drifts measured by the ISRs. In addition to the approaches of Ruohoniemi et al. (1987) and Davies et al. (1999), we compared the mag-nitude and the direction of convection vectors or in other words, full vectors, not only the HF l-o-s velocities and the
Also important to note is that in this study, a much broader range of plasma drifts has been considered.
In addition to the major result of this study about general consistency in convection estimates by the SuperDARN HF radars and the Sondrestrom ISR, we simultaneously stress the fact that there are velocity differences which are some-times significant. At some points, the velocities can differ by a factor of 2, though on average, we would say that the differences are not more than 30–40%. Differences in ve-locity azimuth are typically less than 50◦. The inconsisten-cies between HF radar estimates of plasma convection and plasma drifts measured independently by ISRs have been previously observed (Villain et al., 1985; Ruohoniemi et al., 1987; Davies et al., 1999).
Several circumstances should be considered before any se-rious conclusions are drawn from the results of our compar-ison. It should be mentioned that this study considers data gathered during routine observations by the instruments, so that no special efforts have been made to optimize the joint observations or improve the quality of the data. This lim-ited, to some extent, the importance of our conclusions (a special mode designed for the comparison would give better data coverage and better time resolution. Better ionospheric conditions would also improve the comparison). However, the considered data provided an excellent opportunity for a fair assessment of their consistency, and in this sense, this study contributes to the knowledge in the field.
4.1 Role of micro-structure in plasma flows
The microstructure (temporal and spatial) of ionospheric flows can be a significant factor affecting the correspondence of HF and ISR convection measurements. The considered events were in the noon sector where one would expect a sta-ble convection pattern (e.g. Foster et al., 1981). This was not the case. Figure 2 shows that strong variations of the plasma drift magnitude and direction occurred around 1400 UT and 1500 UT. SuperDARN maps show that for a period of 6 minutes, SuperDARN-measured convection often expe-rienced fluctuations on the order of 30% and more. One more feature is that many points in poor agreement, for example, the ones indicated by an arrow in Fig. 6, correspond to peri-ods of quick changes in the convection (1515 UT for the 10 March 1998 event).
Besides temporal variations, SuperDARN maps show sig-nificant spatial variations. This effect can seriously impact the Sondrestrom calculations since those require an assump-tion of homogeneous plasma flow along L-shells over 300– 500 km. Data presented in Figs. 7a and 8a illustrate the vi-olation of this assumption for some points of the measure-ments. Unfortunately, SuperDARN coverage across the Son-drestrom box was typically not sufficient to say whether the flow was indeed homogeneous longitudinally (data presented in Figs. 7 and 8 are exceptions).
are compared, significant differences between two estimates are inevitable. One can suggest that the existence of localized plasma structures with enhanced/decreased convection flows might give an apparent difference in velocity estimates. As we demonstrated in Sect. 3.3, the data spikes in Sondrestrom data are not always accompanied by spikes in SuperDARN data and vice versa. One of the reasons for that is the sig-nificantly different physical spatial resolution of the instru-ments. The post-integration of SuperDARN data cannot fix this problem. In this sense, one can even say that the com-parison itself may not be so credible in many instances (at least, the results of the comparison are inconclusive in terms of data quality). However, from the user’s view point, this issue is not so important. Ultimately, users of the convection data are not aware of experiment details and rely entirely on the end products, convection maps (SuperDARN) or merid-ional profiles of the convection (Sondrestrom).
4.2 Impact of field-aligned motions on ISR velocity esti-mates
As mentioned in Sect. 3, the Sondrestrom procedure for de-riving convection estimates assumes that there is no plasma flow along the magnetic field lines. The HF radars impose a similar assumption but make their measurements at low el-evation angles and, in addition, refraction bends the radar waves so that the effect is relatively small. For the Sondre-strom ISR measurements, this assumption can lead to errors when observations are made at high elevation angles near the magnetic field line (elevation angle ∼80◦, azimuth angle
∼141◦).
Consider a worst case scenario for the antenna mode used in this study with the ISR radar beam approaching the mag-netic field line to within an angle of 15◦. Also, for sim-plicity, assume the measured l-o-s vector lies in the plane that contains the total ion velocity. In this plane, the ve-locity in the E×B direction may be expressed as VE×B =
VLOS/cos(elevation angle)–Vk·tan(elevation angle), where
VLOS is the measured l-o-s velocity and Vk is the
field-aligned velocity. Often field-field-aligned flows are less than a hundred meter per second, but can still have an increasing influence on the derived E×B drift velocity at high elevation angles. If we assume zero field-aligned flow and an observed l-o-s velocity of 500 m/sec, the E×B drift velocity will be greater than 1900 m/sec. Including a field-aligned velocity of 100 m/sec results in about a ±20% change in the E×B drift velocity with the sign depending on the direction of the field-aligned flow. This example indicates that the convec-tion velocities at points high in elevaconvec-tion during the radar scan could be in error by a few tens of percent; however, this depends on the relative velocities of the horizontal and verti-cal ion motion.
4.3 Potential contribution of SuperDARN uncertainties As far as HF measurements are concerned, several effects might contribute to observed differences between Super-DARN and Sondrestrom velocities. First of all, the stan-dard SuperDARN merging software uses the so-called me-dian filtering (Ruohoniemi and Baker, 1998). Basically, the recorded l-o-s velocities are filtered to exclude measure-ments with strongly different velocities and to replace these measurements by the weighted number of velocity over the neighboring radar cells. We applied this kind of filtering to Goose Bay data for one of the beams and found that filtering can result in both an effective decrease of the reported veloc-ity in a case of large original cell velocveloc-ity and an effective increase in the reported velocity in a case of low original cell velocity. The change in values can be as strong as 200 m/s. This change can certainly be enhanced when data from two SuperDARN beams are merged.
Another important factor is radio wave propagation effects for HF. We would like to state clearly that with the data avail-able, it is impossible to sort out for certain the overall im-portance of these effects, not to mention the imim-portance of specific propagation effects.
Milan et al. (1997) showed that far-distant SuperDARN echoes (ranges ∼2500 km) can be received from E region (not F region as assumed) through a special propagation mode called 1&1/2 hop mode. For this mode, radar rays, af-ter reaching the ionosphere, are reflected toward the Earth’s surface, then they are reflected one more time from the ground to finally reach the ionosphere, where they are scat-tered back by ionospheric irregularities. It is well known that velocities of electrojet irregularities (E region) can be “saturated” at a value of the ion-acoustic speed (∼400– 500 m/s) for large electric fields (e.g. Greenwald et al., 1995). This could be considered as a reason for the smaller HF-inferred convection velocities as compared to the ISR-measured plasma drifts.
We do not think that E region scatter was significant for our observations. First of all, elevation angle measurements typically show angles of 15◦–20◦ which is just what one
needs for direct F region scatter. Secondly, no evidence for ground scatter at ∼1000 km has been found for both radars to support the 1&1/2 hop propagation mode scenario. And finally, neither SuperDARN range velocity profiles (Fig. 5) nor the ISR projection drift/SuperDARN velocity diagrams (Fig. 6) show clear clustering of the data near 400 m/s.
Another potential source of observed velocity discrepan-cies is an uncertainty in the actual position of the HF radar scattering area in the azimuthal direction. Experiments show the possibility of significant lateral deviations of HF radio waves from expected direct propagation paths. For example, HF radio wave deviations from the direction “transmitter-receiver” can be as large as 50◦ in azimuth for a very in-homogeneous ionosphere (MacDougall et al., 1997). Such an effect, if it were significant for the SuperDARN radar measurements, would result in merging l-o-s velocities from completely different spots of the ionosphere. The effect of
lateral ray deviations might be enhanced since SuperDARN radar antenna patterns do not show extreme directionality as assumed in the data processing software.
Finally, one might think about plasma-physical explana-tions of the observed plasma convection inconsistencies. It is widely accepted that the phase velocity of F region irregu-larities with respect to the E×B flow is very small compared to the E×B velocity (e.g. Ruohoniemi et al., 1987). The question as to how small has not been discussed, to the au-thor’s knowledge. There might be some factors increasing the difference. One of the effects to be considered is plasma acceleration during the onset of a strong electric field.
5 Summary
In this paper, convection measurements by the Goose Bay and Stokkseyri HF coherent radars and Sondrestrom ISR are studied at three different levels. First, the l-o-s velocities at about the same locations and directions were compared. Then the SuperDARN velocity and the Sondrestrom l-o-s velocity projected onto the SuperDARN convection vector were compared. Finally, the 2-D velocity vectors, as inferred by the systems from the l-o-s velocities, were considered. We demonstrate that the l-o-s velocities for these instruments usually show similar trends and often agree reasonably well, though there are anomalous points of strong disagreement. Similarly for the majority of points, the Sondrestrom l-o-s velocities projected onto the SuperDARN convection vec-tors are in agreement with the SuperDARN observed con-vection vectors though some differences are also obvious, sometimes even in the direction of the flow. A fair degree of agreement was found when 2-D vectors were compared. In terms of the velocity magnitude, agreement is better in the range of 500–1000 m/s plasma velocities. There is a ten-dency for the SuperDARN velocities to be 10–30% smaller than the Sondrestrom velocities at large drifts of more than 1000 m/s and larger at small drifts of less than 500 m/s. The amount of large-velocity points is not appreciable, so the ef-fect of inconsistency requires further investigation. In terms of the flow direction, the SuperDARN and Sondrestrom vec-tors agree within ±50◦.
We noticed that strong SuperDARN/Sondrestrom dis-crepancies occurred in those areas of the ionosphere where plasma flow (according to SuperDARN measurements) exhibited a strong variation in time, in magnitude and di-rection. For such periods, it is expected that the assumption of flow homogeneity along L-shell contours, adopted in Sondrestrom measurements, was not satisfied and this led to errors in the convection measurements for some points. Joint data for more stable and spatially uniform ionospheric flows are required to prove that there are no other rea-sons for the inconsistencies between the SuperDARN and Sondrestrom convection measurements. Particularly, the origin of anomalous points of strong disagreement in the l-o-s measurements of both instruments needs to be explored.
Stokkseyri radar pair, data from which have been used in this study, are appreciated. A.V.K. acknowledges funding from an NSERC grant. Thayer and McCready were supported by NSF Coopera-tive Agreement ATM-9813556. The authors are thankful to R. A. Greenwald and J. M. Ruohoniemi for their criticism and suggestion to expand the project on l-o-s velocity comparisons. We also thank T. Ogawa for discussion of the F region density/electric field rela-tion.
Topical Editor M. Lester thanks J. M. Ruohoniemi, N. J. Fox and K. Schlegel for their help in evaluating this paper.
References
Andr´e, R., Hanuise, C., Villain, J. P., and Cerisier, J. C., HF radars: multifrequency study of refraction effects and localization of scattering, Radio Sci., 32, 153–168, 1996.
Baker, K. B., Greenwald, R. A., Ruohoniemi, J. M., Dudeney, J. R., Pinnock, M., Newell, P. T., Greenspan, M. E., and Meng, C.-I., Simultaneous HF-radar and DMSP observations of the cusp, Geophys. Res. Lett., 17, 1869–1872, 1990.
Davies, J. A., Lester, M., Milan, S. E., and Yeoman, T. K., A com-parison of velocity measurements from the CUTLASS Finland radar and the EISCAT UHF system, Ann. Geophysicae, 17, 892– 903, 1999.
Foster, J. C., An empirical electric field model derived from Chatanika radar data, J. Geophys. Res., 88, 981–987, 1983. Foster, J. C., Doupnik, J. R., and Stiles, G. S., Large scale patterns
of auroral ionospheric convection observed with the Chatanika radar, J. Geophys. Res., 86, 11357–11371, 1981.
Grant, I. F., MacDougall, J. W., Ruohoniemi, J. M., Bristow, W. A., Sofko, G. J., Koehler, J. A., Danskin, D., and Andr´e, D., Com-parison of plasma flow velocities determined by the ionosonde Doppler drift technique, SuperDARN radars, and patch motion, Radio Sci., 30, 1537–1549, 1995.
Hairston, M. R., and R. A. Heelis, Model of high-latitude iono-spheric convection pattern during southward interplanetary mag-netic field using DE2 data, J. Geophys. Res., 95, 2333–2343, 1990.
Kelly, J. D., Heinselman, C. J., Vickrey, J. F., and Vondrak, R. R., The Sondrestrom radar and accompanying ground-based instru-mentation, Space Sci. Rev., 71, 797–813, 1995.
MacDougall, J. W., Dumas, D. J., James, H. G., Jenkins, R. W., and Prikryl, P., High latitude ionospheric observations during winter darkness, using ionosonde, radar, and sampled-aperture HF array data, 1997 North American Radio Science Meeting, 13–18 July, 1997, Montreal, Canada, Program and Abstracts, p. 480, 1997. Milan, S. E., Yeoman, T. K., Lester, M., Thomas, E. C., and Jones,
T. B., Initial backscatter occurrence statistics from the CUT-LASS HF radars, Ann. Geophysicae, 15, 703–718, 1997. Ruohoniemi, J. M., and Baker, K. B., Large-scale imaging of
high-latitude convection with Super Dual Auroral Radar Network HF radar observations, J. Geophys. Res., 103, 20, 797–20, 811, 1998.
Ruohoniemi, J. M., and Greenwald, R. A., Statistical patterns of high-latitude convection obtained from Goose Bay HF radar ob-servations, J. Geophys. Res., 101, 21, 743–21, 763, 1996. Ruohoniemi, J. M., Greenwald, R. A., Baker, K. B., Villain, J.-P.,
and McCready, M. A., Drift motions of small-scale irregularities in the high-latitude F region: An experimental comparison with plasma drift motions, J. Geophys. Res., 92, 4553–4564, 1987. Senior, C., Fontaine, D., Caudal, G., Alcayd´e, D., and
Fonta-nari, J., Convection electric fields and electrostatic potential over 61◦ < 3 <72◦invariant latitude observed with the European incoherent scatter facility, 2, Statistical results, Ann. Geophysi-cae, 8, 257–272, 1990.
Villain, J.-P., Caudal, G., and Hanuise, C., A SAFARI-EISCAT comparison of F region small-scale irregularities and the ion drift, Ann. Geophysicae, 90, 8433–8443, 1985.