HAL Id: hal-00298465
https://hal.archives-ouvertes.fr/hal-00298465
Submitted on 27 Feb 2007HAL is a multi-disciplinary open access
archive for the deposit and dissemination of sci-entific research documents, whether they are pub-lished or not. The documents may come from teaching and research institutions in France or abroad, or from public or private research centers.
L’archive ouverte pluridisciplinaire HAL, est destinée au dépôt et à la diffusion de documents scientifiques de niveau recherche, publiés ou non, émanant des établissements d’enseignement et de recherche français ou étrangers, des laboratoires publics ou privés.
15N enrichment in the surface Particulate Organic
Nitrogen of the north-eastern Arabian Sea from the
middle to the waning phase of the winter monsoon:
possible causes
S. Kumar, R. Ramesh
To cite this version:
S. Kumar, R. Ramesh. 15N enrichment in the surface Particulate Organic Nitrogen of the north-eastern Arabian Sea from the middle to the waning phase of the winter monsoon: possible causes. Ocean Science Discussions, European Geosciences Union, 2007, 4 (1), pp.245-264. �hal-00298465�
OSD
4, 245–264, 2007
15
N enrichment in PON of the Arabian
Sea
S. Kumar and R. Ramesh
Title Page Abstract Introduction Conclusions References Tables Figures ◭ ◮ ◭ ◮ Back Close Full Screen / Esc
Printer-friendly Version Interactive Discussion
EGU
Ocean Sci. Discuss., 4, 245–264, 2007 www.ocean-sci-discuss.net/4/245/2007/ © Author(s) 2007. This work is licensed under a Creative Commons License.
Ocean Science Discussions
Papers published in Ocean Science Discussions are under open-access review for the journal Ocean Science
15
N enrichment in the surface Particulate
Organic Nitrogen of the north-eastern
Arabian Sea from the middle to the
waning phase of the winter monsoon:
possible causes
S. Kumar1,2and R. Ramesh1
1
Planetary and Geosciences Division, Physical Research Laboratory, Navrangpura, Ahmedabad- 380 009, India
2
Environmental Sciences Research Centre, St. Francis Xavier University, Antigonish, Nova Scotia B2G 2W5, Canada
Received: 6 February 2007 – Accepted: 19 February 2007 – Published: 27 February 2007 Correspondence to: S. Kumar ([email protected])
OSD
4, 245–264, 2007
15
N enrichment in PON of the Arabian
Sea
S. Kumar and R. Ramesh
Title Page Abstract Introduction Conclusions References Tables Figures ◭ ◮ ◭ ◮ Back Close Full Screen / Esc
Printer-friendly Version Interactive Discussion
EGU
Abstract
A temporal increase of ∼5‰ in the average nitrogen isotopic composition (δ15NPON)
of surface particulate organic nitrogen was observed in the open north-eastern Ara-bian Sea during January to late February-early March 2003, despite the presence of T. erithraeum (up to ∼11%), a diazotroph that fixes atmospheric N2, in the latter period.
5
Hydrographic conditions and residence time of nitrate in the water column suggested that this increase could be a combined effect of denitrification in the subsurface layer and inefficient utilization of nitrate entrained in the water column during January.
1 Introduction
Abundance of15N in marine organic and inorganic pools is known to vary significantly 10
over a range of spatial and temporal scales (e.g., Saino and Hattori, 1980; Altabet, 1996; Rau et al., 1998). The nitrogen isotopic composition, δ15N, of naturally occur-ring land derived particulate matter has been reported to have lower values (1.5–2.5‰; Miyake and Wada, 1967), while those of marine organisms have a strong dependence on the δ15N of the source and are reported to vary significantly (e.g., Saino and Hattori, 15
1980; Altabet, 1996; Wada and Hattori, 1991; Rau et al., 1998). The δ15N of phyto-plankton averages around 7‰ while zoophyto-plankton and fishes, which are at higher trophic levels in the food web, have values around 10‰ and 15‰ respectively (Wada and Hat-tori, 1976). Isotopic variations in different chemical species of nitrogen are caused by mass dependent fractionations associated with various biogeochemical transforma-20
tions such as N2 fixation, denitrification, nitrification and nitrate assimilation.
Denitri-fication leads to15N enrichment of the remaining (dissolved) nitrate while nitrification causes enrichment of15N in the (dissolved) ammonium pool (Mariotti et al., 1984). Iso-topic fractionation up to 20‰ has been found due to denitrification (Miyake and Wada, 1971; Cline and Kaplan, 1975; Liu and Kaplan, 1989), nitrification (Miyake and Wada, 25
OSD
4, 245–264, 2007
15
N enrichment in PON of the Arabian
Sea
S. Kumar and R. Ramesh
Title Page Abstract Introduction Conclusions References Tables Figures ◭ ◮ ◭ ◮ Back Close Full Screen / Esc
Printer-friendly Version Interactive Discussion
EGU
is known to lower the δ15N values of particulate organic nitrogen (PON), atmospheric nitrogen being the isotopic reference, is zero ‰; the areas with lower δ15N may thus be attributable to N2fixation. However, lower δ15N could also be caused by the pref-erential removal of15N enriched matter by sinking material, leading to a depletion of
15
N in the remaining suspended matter (Altabet, 1988).15N measurements on marine 5
organic matter can provide information on the mechanisms and rates of these trans-formations and largely reflect the isotopically selective processing of nitrogen by biota (Rau et al., 1998).
Isotopic fractionation during the formation of PON governs its isotopic signature and therefore δ15N of PON (δ15NPON) records the nitrogen availability in the euphotic zone
10
(Wada and Hattori, 1991). The isotopic signature inherited during the biological fixa-tion of nitrogen by particulate matter varies with the substrate concentrafixa-tion as well as with algal species, physiology and growth rate (e.g. Wada and Hattori, 1978; Wada, 1980; Montoya and McCarthy, 1995). Significant correlations found in the world ocean between δ15NPON and nitrate concentrations and variations in δ15NPON have been ex-15
plained by Rayleigh fractionation kinetics for a closed system (Altabet, 1996) implying that δ15NPONcan be an index of nutrient availability and utilization. Consequently, δ
15
N in sediments has been used to reconstruct paleonutrient conditions and biological pro-ductivity (Calvert et al., 1992; Francois et al., 1992; Altabet and Francois, 1994; Farrell et al., 1995).
20
Direct measurements of surface δ15NPONin the Indian Ocean are so far quite limited
(e.g., Kumar et al., 2004, 2005; Montoya and Voss, 2006). Here we present new data on the surface δ15NPONin the north-eastern Arabian Sea from the middle and the
waning phases of the northeast monsoon (NEM). We also investigate the effectiveness of nutrient utilization in the photic zone and whether the observed increase is a result 25
of surficial phenomena or it is related to denitrification in the subsurface layer, prevalent here during the sampling period.
OSD
4, 245–264, 2007
15
N enrichment in PON of the Arabian
Sea
S. Kumar and R. Ramesh
Title Page Abstract Introduction Conclusions References Tables Figures ◭ ◮ ◭ ◮ Back Close Full Screen / Esc
Printer-friendly Version Interactive Discussion
EGU
2 Material and methods
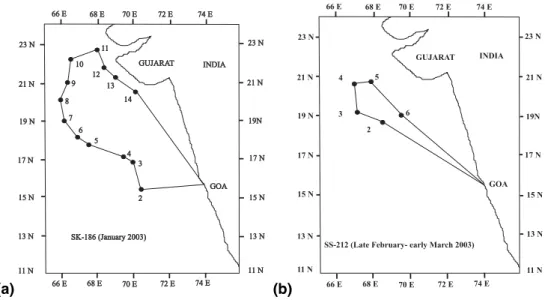
Surface water was collected using a clean plastic bucket during two cruises in the north-eastern Arabian Sea during the winter monsoon, 2003. The first cruise was onboard ORV Sagar Kanya (SK-186) from 4–17 January and the second cruise was onboard FORV Sagar Sampada (SS-212) during late February–early March (28 February–5 5
March). The sampling stations were not exactly the same during both cruises; however, they were mostly in the same region i.e., off Gujarat, India (Fig. 1a and b). Thirteen stations during January and five stations during late February-early March were sam-pled. The latter was a typical bloom period (e.g., Noctiluca miliaris) and significantly higher productivity was observed compared to January (Kumar et al., 20071). Biolog-10
ical measurements from these two cruises have been recently reported (Parab et al., 2006). Samples were filtered on precombusted (4 h @ 400◦C) 47 mm Whatman GF/F filters and subsequently dried and stored for further mass spectrometric analysis. The analysis was performed using a CarloErba elemental analyser interfaced via Conflo III to a Finnigan Delta Plus mass spectrometer. The variability in particulate organic nitro-15
gen between duplicate samples was less than 10% whereas it was less than 0.3‰ for δ15N. Procedures have been elaborated earlier by Kumar et al. (2004, 2005). Nitrate concentrations were measured using an Autoanalyzer (SKALAR) based on standard spectrophotometric technique.
3 Meteorological and hydrographic conditions
20
The present study was conducted during the middle and waning phases of the north-east monsoon. During this period the Arabian Sea witnesses a surface water tem-perature difference of almost 5–6◦C from the south to the north (north being cooler).
1
Kumar, S., Ramesh, R., Dwivedi, R. M., Raman, M., Sheshshayee, M. S., and DeSouza, W.: Effect of winter cooling on nitrogen uptake in the northeastern Arabian Sea, J. Geophys. Res., in review, 2007.
OSD
4, 245–264, 2007
15
N enrichment in PON of the Arabian
Sea
S. Kumar and R. Ramesh
Title Page Abstract Introduction Conclusions References Tables Figures ◭ ◮ ◭ ◮ Back Close Full Screen / Esc
Printer-friendly Version Interactive Discussion
EGU
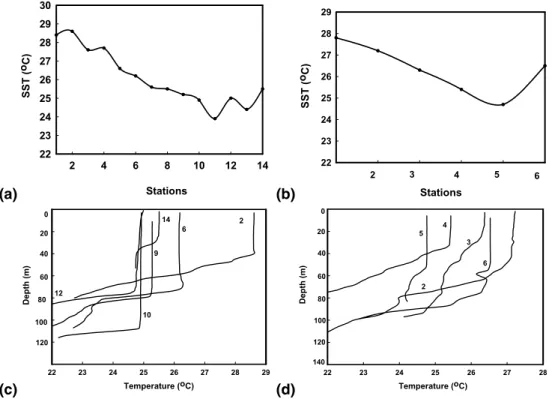
During January 2003 the sea surface temperature (SST) showed a general northward decrease, with a maximum SST of 28.6◦C at one of the southernmost stations (Stn. 2) and a minimum SST of 23.9◦C at one of the northernmost stations i.e., Stn. 11 (Fig. 2a). The SST pattern during late February–early March was almost the same as in January i.e., decreasing SST northwards (Fig. 2b).
5
The depth profile of temperature during January suggested a general northward in-crease in temperature-based mixed layer depth (henceforth MLD) with ∼40 m at south-ern station 2 to ∼107 m at one of northsouth-ern (Stn. 10) stations (Fig. 2c). The MLD pattsouth-ern during late February-early March was quite different from that of January. The MLD for the first two stations was not clearly defined and the depth profile showed a continuous 10
decrease in temperature with slight undulations (Fig. 2d). This might be an indication of the varying degree of mixing with depth between cooler water and relatively warmer surface water. The cooler water might have been supplied from deeper sources or due to horizontal advection from a nearby region. Interestingly, temperature profiles of stations 4–6 were marked by a relatively sharper decrease in temperature with depth, 15
indicating a shallow mixed layer (33 to 55 m) for these stations. Although SSTs at these locations were not drastically different from January, the MLDs were markedly shallower (it was near 80 m in the same region during January). Relatively shallow mixed layer at these locations persisted despite higher wind speed (8 ms−1) indicating the limited role played by wind in the deepening of MLD during this period. Therefore, 20
the shoaling of MLD from January to late February-early March indicates the temporal decrease in effectiveness of winter cooling in the region.
Winds during January were north/north-easterly with an average speed of around 4 ms−1. During late February-early March, the wind speed at the first station was around 2.74 ms−1, typically in the range observed during January. However, it was 25
OSD
4, 245–264, 2007
15
N enrichment in PON of the Arabian
Sea
S. Kumar and R. Ramesh
Title Page Abstract Introduction Conclusions References Tables Figures ◭ ◮ ◭ ◮ Back Close Full Screen / Esc
Printer-friendly Version Interactive Discussion
EGU
4 Results
4.1 January, 2003
Of the 13 sampling stations, 9 were located in the open ocean (Stn. 2 to Stn. 10) and 4 in the coastal region (Stn. 11 to Stn. 14). Overall, the PON content varied widely ranging from 0.16 µM N at station 8, which was an open ocean station to 2.10 µM N at 5
station 13, a coastal station. Overall, PON averaged around 1.04 (with a std. dev. of ±0.47) µM N. The PON at open ocean locations varied from 0.16 to 1.27 µM N averag-ing around 0.90 (std. dev.±0.41) µM N (Table 1), whereas at coastal stations variation was between 0.89 to 2.1 µM N with relatively higher average of 1.35 (std. dev.±0.52) µM N. Among the open ocean stations, there was a clear demarcation in PON concen-10
tration, where the first four stations (towards south) had PON more than 1µM N with an average of 1.23 µM N. The rest of the open ocean locations (towards north) had PON less than 1 µM N, averaging around 0.64 µM N.
The δ15NPONalso showed a wide variation in the region during this month with
min-imum of 1.7‰ at station 7, which was an open ocean location, to 7.5‰ at station 13, 15
a coastal location. Interestingly, PON at station 13 was also a maximum during the whole study period. No systematic spatial pattern was observed in δ15NPON. Overall,
the δ15NPON averaged around 4.7 (±1.7) ‰. The average δ15NPON for open ocean locations was around 4.4 (±1.5) ‰ and no clear demarcation was observed as in the case of PON content. The δ15NPON of coastal locations averaged around 5.3 (±2.2)
20
‰. Barring three locations during the study period (Stations 3, 7 and 12) the δ15NPON was ≥ 4‰ during January.
The community composition, based on averages of cell counts was dominated by diatoms ∼84% of total population (Parab et al., 2006).
OSD
4, 245–264, 2007
15
N enrichment in PON of the Arabian
Sea
S. Kumar and R. Ramesh
Title Page Abstract Introduction Conclusions References Tables Figures ◭ ◮ ◭ ◮ Back Close Full Screen / Esc
Printer-friendly Version Interactive Discussion
EGU
4.2 Late February–early March, 2003
During this period, five open ocean stations were sampled. The PON content varied from 1.0 to 2.25 µM N with an average value of 1.6 (std. dev. ±0.5) µM N. The δ15NPON
varied from 7 to 11‰ with an average of 9.4 (±1.7) ‰. The PON content and δ15NPON are listed in Table 1.
5
Community structure was ∼50% diatoms, with the rest domintaed by Noctiluca mil-iaris and some T. erythraeum (Parab et al., 2006).
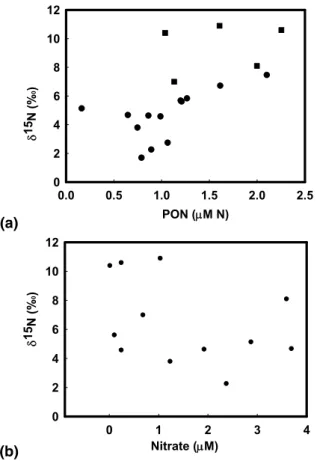
A plot of δ15NPON and PON content for whole data set revealed a positive
relation-ship between the two with r2 = 0.41(Fig. 3a). No significant (r2= 0.14) relationship was observed between the surface nitrate and δ15NPON (Fig. 3b). A strong negative 10
correlation is expected between the two, as in regions where the surface nitrate con-centration is very high. The observed poor relationship may be because of low nitrate concentrations and/or the limited number of measurements. Nevertheless, an overall increase in δ15NPON of the region during late February-early March is clearly borne
out by the data. A comparison of δ15NPON of open ocean locations of January to late 15
February-early March revealed an average increase of ∼5‰, which is highly signifi-cant (at 0.00012 level). A signifisignifi-cant increase of ∼0.7 µM N in PON content was also concurrently observed.
Montoya and Voss (2006) have also reported enriched δ15NPON(average ∼8.34‰) in upper 100 m of water column during May–June 1995. However, they encountered sur-20
face δ15NPONas low as ∼ 4‰ at 10 ◦
N latitude which they attributed to a Trichodesmium bloom. In the present study, although up to ∼11% of N2-fixer (T. erythraeum) was present at one station (Stn. 6) along with a predominantly diatom population, δ15NPON
OSD
4, 245–264, 2007
15
N enrichment in PON of the Arabian
Sea
S. Kumar and R. Ramesh
Title Page Abstract Introduction Conclusions References Tables Figures ◭ ◮ ◭ ◮ Back Close Full Screen / Esc
Printer-friendly Version Interactive Discussion
EGU
5 Discussion
Our observations in winter, combined with the enriched15NPON observed by Montoya
and Voss (2006) suggest that the enrichment that happens during late winter could persist till the intermonsoon. Montoya and Voss (2006) have argued that isotopic sig-nature of denitrification in the form of enriched15NNO3propagates upward to the
sur-5
face through vertical mixing and subsequent uptake by phytoplankton results in15N enriched PON. However, we did not see the signature of denitrification i.e., enriched
15
NPON, immediately after the entrainment of enriched nitrate in the surface layer; there
was a delay in the response of about one month, consistent with the residence time of nitrate in the water column. Therefore, the observed increase in δ15NPON during 10
the present study appears to be the combined effect of subsurface (denitrification) and surficial processes.
The observed enrichment from January to late February–early March may be due to: (a) the overall increase in the nitrogen isotopic composition of the source nutrient taken up by the phytoplankton, (b) change in the fractionation during uptake by the phy-15
toplankton, if the δ15N of the source nutrient was the same during both periods, and (c) a combination of both (a) and (b). Very high new production during late February-early March (Kumar et al., 20071) suggested nitrate to be the principal source of nutrient, which could be deeper nitrate (> euphotic depth) or nitrate already present in the water column which got entrained during January due to the deepening of the mixed layer 20
caused by winter cooling (Madhupratap et al., 1996). Shallow mixed layers at the last three stations during late February–early March preclude the possibility of nitrate sup-ply from deeper layers. However, the undulating and continuously sloping mixed layer at the first two stations suggest such a possibility: nitrate supply might be from deeper layers or due to advection from a nearby region where the effect of winter cooling had 25
not completely vanished. If the nutrient source during both the months was deeper nitrate, the dramatic increase in δ15N of nitrate was possible only when there was an intensification of denitrification in the intermediate waters leading to more enriched
ni-OSD
4, 245–264, 2007
15
N enrichment in PON of the Arabian
Sea
S. Kumar and R. Ramesh
Title Page Abstract Introduction Conclusions References Tables Figures ◭ ◮ ◭ ◮ Back Close Full Screen / Esc
Printer-friendly Version Interactive Discussion
EGU
trate. However, if the nitrate already entrained in the surface layer is assumed to be the only source, the continuous use of available nitrate might probably leave the remain-ing pool enriched enough to explain the observed variation. The followremain-ing subsections explore both the above possibilities.
5.1 Possible role of denitrification 5
Although most part of the open Arabian Sea is well oxygenated, an acute depletion of oxygen leading to denitrification occurs at intermediate depths (100–500 m) particularly in the eastern and the central Arabian Sea. The total area affected by denitrification has been estimated to be around 1.37×10⁶km2 (Naqvi, 1991). The variation in the denitrification intensity based on seasonal scale has also been observed (Naqvi et al., 10
1990).
Denitrification leads to the enrichment of15N in the remaining nitrate, which even-tually acts as a source for phytoplankton. But why was there so significant difference in δ15N of PON from January to late February–early March? Was that the signature of relative intensification of denitrification at intermediate depths, which eventually lead 15
to more enriched nitrate from January to late February–early March? Banse (1984) observed the relative suppression of denitrification during winter due to the supply of oxygen to the upper part of the oxygen minimum zone as a result of enhanced diffusion due to deepening of the mixed layer. The deepening of mixed layer up to 107 m was observed at the northern stations during January. This might have helped in reducing 20
the denitrification leading to lower δ15N values of nitrate during January, as reflected by δ15N of PON. This situation changed during late February–early March as the effect of winter cooling decreased. The shallow mixed layer at a few stations suggested that the environment during late February-early March was not so supportive of vertical mixing and hence the decrease in the aeration of deeper layers. This could have lead 25
to increase in the intensity of denitrification and consequent increase in δ15N of nitrate. Brandes et al. (1998) estimated the δ15N of nitrate in the Central Arabian Sea with highest value of 15‰ at 350 m during September and January. However, they observed
OSD
4, 245–264, 2007
15
N enrichment in PON of the Arabian
Sea
S. Kumar and R. Ramesh
Title Page Abstract Introduction Conclusions References Tables Figures ◭ ◮ ◭ ◮ Back Close Full Screen / Esc
Printer-friendly Version Interactive Discussion
EGU
a decrease in δ15N of nitrate (6‰) at 80 m due to the dilution by lighter isotopes added due to nitrogen fixation in the surface layer. Assuming that there was a similar level of dilution of nitrate isotopic composition at around 80 m and the same fractionation factor for both months during the uptake of nitrate by phytoplankton, an increase in δ15N of nitrate due to the intensification of denitrification from January to late February–early 5
March appears likely.
5.2 Varying degree of dilution of deeper nitrate
Assuming that there was no intensification of denitrification from January to late February–early March and the δ15N of dissolved nitrate produced in the denitrifica-tion layer remained same (say a steady state value of ∼15‰), with no change in the 10
15
N fractionation by phytoplankton during the uptake of nitrate, the observed difference of 5‰ in the δ15N of surface PON could be explained by the varying degrees of dilution of enriched nitrate due to nitrogen fixation in the surface layer. The dilution during Jan-uary should be more than late FebrJan-uary-early March. To estimate the level of dilution during both the months the highest value of δ15N of PON of respective months would 15
be considered as the δ15N of ambient nitrate available for uptake, assuming these val-ues to be a reflection of the δ15N of nitrate consumed without fractionation. These values during January and late February–early March were 7.5 and 11‰ respectively. The January value (7.5‰) is closer to the known δ15N of nitrate in World Ocean (∼ 5‰; Miyake and Wada, 1967). The dilution level required to obtain the 7 and 11‰ can 20
be obtained by simple isotopic mass balance:
15x + (1-x)*5 = 7.5 (January) and 15x +(1-x)*5 = 11 (March)
Where x is the proportion of deeper nitrate and (1–x) is fraction of required dilution by lighter nitrate. 5‰ and 15‰ are the assumed δ15N compositions of natural and deeper nitrate respectively. From this equation it is quite clear that ∼75% dilution would 25
OSD
4, 245–264, 2007
15
N enrichment in PON of the Arabian
Sea
S. Kumar and R. Ramesh
Title Page Abstract Introduction Conclusions References Tables Figures ◭ ◮ ◭ ◮ Back Close Full Screen / Esc
Printer-friendly Version Interactive Discussion
EGU
5.3 Change in the15N fractionation by phytoplankton
The third scenario might be varying 15N discrimination with the same denitrification intensity and level of dilution during both the months. We assume that the δ15N of nitrate in the denitrification layer was 15‰ which underwent similar dilution in the sur-face layer such that the isotopic composition changed to 11‰, the maximum observed 5
δ15NPON. This 11‰ nitrate would be acting as source during both the months. The
observed difference of 5‰ now can be explained by different degree of fractionation during uptake in January and late February-early March to reach the observed isotopic composition. This depends upon the pool of available dissolved nitrate to the phyto-plankton. The nitrate concentrations in surface water of the open Arabian Sea during 10
these two months suggested the abundant nitrate (average ∼1.8 µM) during January whereas its relative dearth (average ∼0.3 µM) during late February-early March except at one station where it was 3.5 µM. This high nitrate during January and lower dur-ing late February–early March indicated the flexibility for phytoplankton to fractionate during January, and not during March; consequently, reflecting lower and higher δ15N 15
values during January and late February-early March respectively 5.4 Utilization of nitrate present in the surface layer
One important possibility of the nutrient during late February–early March was the in-efficient utilization of the nitrate introduced in the water column during January. It is interesting to note that the euphotic zone integrated nitrate concentration in the water 20
column at most of the stations during January was more than 150 mmol m−2but the av-erage new production was only ∼2.3 mmol N m−2d−1. However, the integrated euphotic zone column nitrate during March was only around 80 mmol m−2but the average new production was as high as 13 mmol Nm−2d−1. Also, the residence time of nitrate en-trained during January was found to be more than 50 days (Kumar et al., 20071). These 25
observations indicate that the nutrients entrained in the water column due to convec-tive mixing during January did not get completely consumed and remained in the water
OSD
4, 245–264, 2007
15
N enrichment in PON of the Arabian
Sea
S. Kumar and R. Ramesh
Title Page Abstract Introduction Conclusions References Tables Figures ◭ ◮ ◭ ◮ Back Close Full Screen / Esc
Printer-friendly Version Interactive Discussion
EGU
column. Assuming the surface layer of the ocean as a closed system and nitrate with initial isotopic composition (δo) of 7‰ (close to maximum observed δ15NPON) as the source for phytoplankton during January, the isotopic composition of remaining nitrate (δ) would keep on changing with the consumption of the substrate pool (i e., fraction of substrate remaining, f) according to well known relationship:
5
δ=δo+ε * ln (f) where, ε = (α-1)*1000; α is the fractionation factor.
Assuming that the isotopic composition of nitrate during late February-early March was 11‰ and taking ε = –5‰ (typical value assumed for fractionation; Waser et al., 1998) the f from the above equation comes to be 0.4. It reveals that at the start of the uptake during late February-early March 60% of the nitrate introduced in the water 10
column during January had already been consumed. If we take ε = –9‰ as in some cases (e.g., Rau et al., 1998) only 40% of the nitrate was consumed and rest 60% was available for further consumption (Fig. 4).
6 Conclusions
During the north-east monsoon δ15N of surface PON in the northeastern Arabian Sea 15
increases from January to March by at least ∼5‰. A combination of two factors, viz., intensification of denitrification and consequent15N enrichment of the dissolved nitrate pool, and inefficient utilization of the entrained nitrate by plankton, despite the patchy occurrence of N2-fixers, appears responsible for this increase.
Acknowledgements. We thank M. Sudhakar and Department of Ocean Development for ship
20
time for this work, funded by ISRO-GBP Department of Space, Government of India. We thank participants and crews of the cruises ORV Sagar Kanya-186 and FORV Sagar Sampada-212 for their help, S. W. A. Naqvi for arranging nutrient analysis. We also thank R. M. Dwivedi, chief scientist and R. R. Navalgund, Director, Space Applications Centre for encouragement.
OSD
4, 245–264, 2007
15
N enrichment in PON of the Arabian
Sea
S. Kumar and R. Ramesh
Title Page Abstract Introduction Conclusions References Tables Figures ◭ ◮ ◭ ◮ Back Close Full Screen / Esc
Printer-friendly Version Interactive Discussion
EGU
References
Altabet, M. A.: Variations in nitrogen isotopic composition between sinking and suspended particles: Implications for nitrogen cycling and particle transformation in the open ocean, Deep-Sea Res., Part A, 35, 535–554, 1988.
Altabet, M. A. and Francois, R.: The use of nitrogen isotopic ratio for reconstruction of past
5
changes in the surface ocean nutrient utilization, Carbon Cycling in the Glacial Ocean: Constraints on the Ocean’s Role in Global Change, edited by: Zahn, R., Kaminski, M. A., Labeyrie, L., and Pederson, T. F., Springer-Verlag, New York, 281–306, 1994.
Altabet, M. A.: Nitrogen and carbon isotopic tracers of the source and transformation of parti-cles in the Deep-Sea, Particle Flux in the Ocean, edited by: Ittekkot, V., Schafer, P., Honjo,
10
S., and Depetris, P. J., John Wiley, New York, 155–184, 1996.
Banse, K.: Overview of the hydrography and associated biological phenomena in the Arabian Sea, off Pakistan, Marine geology and oceanography of Arabian Sea and coastal Pakistan, edited by: Haq, B. U. and Milliman, J. D., Van Nostrand Reinhold Co., New York, 271– 303,1984.
15
Brandes, J. A., Devol, A. H., Yoshinari, T., Jayakumar, T. A., and Naqvi, S. W. A.: Isotopic composition of nitrate in the central Arabian Sea and eastern tropical north Pacific: a tracer for mixing and nitrogen cycles, Limnol. Oceanogr., 43, 1680–1689, 1998.
Calvert S. E., Nielsen, B., and Fontugne, M. R.: Evidence from nitrogen isotope ratios for enhanced productivity during formation of eastern Mediterranean sapropels, Nature, 359,
20
223–225, 1992.
Cline, J. D. and Kaplan, I. R.: Isotopic fractionation of dissolved nitrate during denitrification in the eastern tropical North Pacific Ocean, Mar. Chem., 3, 271–299, 1975.
Farrell, J. W., Pederson, T. F., Calvert, S. E., and Nielsen, B.: Glacial-interglacial changes in nutrient utilization in equatorial Pacific Ocean, Nature, 377, 514–517, 1995.
25
Francois, R., Altabet, M. A., and Burkle, L. H.: Glacial to interglacial changes in surface
ni-trate utilization in the Indian Sector of the Southern Ocean as recorded by sediment δ15N,
Paleoceanography, 7, 589–606, 1992.
Kumar, S., Ramesh, R., Sardesai, S., Sheshshayee, M. S. and Patel, P. P.: Signature of terres-trial influence on nitrogen isotopic composition of suspended particulate matter in the Bay of
30
Bengal, Current Science, 88(5), 770–774, 2005.
OSD
4, 245–264, 2007
15
N enrichment in PON of the Arabian
Sea
S. Kumar and R. Ramesh
Title Page Abstract Introduction Conclusions References Tables Figures ◭ ◮ ◭ ◮ Back Close Full Screen / Esc
Printer-friendly Version Interactive Discussion
EGU
composition of nitrogen in suspended particulate matter in the Bay of Bengal, Biogeosci., 1, 63–70, 2004.
Liu, K. K. and Kaplan, I. R.: The eastern tropical Pacific as a source of15N-enriched nitrate in
seawater off southern California, Limnol. Oceanogr., 34, 820–830, 1989.
Madhupratap, M., Kumar, S., Bhattathiri, P. M. A., Dileep Kumar, M., Raghukumar, S., Nair,
5
K. K. C., and Ramaiah, N.: Mechanism of the biological response to winter cooling in the northeastern Arabian Sea, Nature, 384, 549–552, 1996.
Mariotti, A., Lancelot, C., and Billen, G.: Natural isotopic composition of nitrogen as a tracer of origin for suspended organic matter in the Scheldt estuary, Geochim. Cosmochim. Acta, 48, 549–555, 1984.
10
Miyake, Y. and Wada, E.: The abundance ratio of 15N/14N in marine environments, Rec.
Oceanogr. Works Jpn., 9, 37–53, 1967.
Miyake, Y. and Wada, E.: The isotope effect on the nitrogen in biochemical, oxidation-reduction reactions, Rec. Oceanogr. Works Jpn., 11, 1–6, 1971.
Montoya, J. P. and McCarthy, J. J.: Isotopic fractionation during nitrate uptake by phytoplankton
15
grown in continuous culture, J. Plankton Res., 17, 439–464, 1995.
Montoya, J. P. and Voss, M.: Nitrogen cycling in the suboxic waters: isotopic signatures of nitrogen transformation in the Arabian Sea Oxygen Minimum Zone, in: Past and Present Anoxia, edited by: Neretin, L. N., NATO Science Series, Springer, 64, 259–281, 2006. Naqvi, S. W. A., Noronha, R. J., Somasundar, K., and Sen Gupta, R.: Seasonal changes in the
20
denitrification regime of the Arabian Sea, Deep-Sea Res., 37, 593–611, 1990.
Naqvi, S. W. A: Geographical extent of denitrification in the Arabian Sea in relation to some physical processes, Oceanolog. Acta, 14, 281–290, 1991.
Parab, S. G., Matondkar, S. G. P., Gomes, H. R., and Goes, J. I.: Monsoon driven changes in phytoplankton populations in the eastern Arabian Sea as revealed by microscopy and HPLC
25
pigment analysis, Continental Shelf Res., 26, 2538–2558, 2006.
Rau, G.H., Low, C., Pennington, J.T., Buck, K.R., and Chavez, F.P.: Suspended particulate
nitrogen δ15N versus nitrate utilization: Observations in Montery Bay, CA, Deep-Sea Res. II,
45, 1603-1616, 1998.
Saino, T. and Hattori, A.: 15N natural abundance in oceanic suspended particulate matter,
30
Nature, 283, 752–754, 1980.
Wada, E., Miyazaki, T., and Hattori, A.: 15N abundance in nitrogenous compounds in the sea,
OSD
4, 245–264, 2007
15
N enrichment in PON of the Arabian
Sea
S. Kumar and R. Ramesh
Title Page Abstract Introduction Conclusions References Tables Figures ◭ ◮ ◭ ◮ Back Close Full Screen / Esc
Printer-friendly Version Interactive Discussion
EGU
Wada, E. and Hattori, A.: Natural abundance of15N in particulate organic matter in the North
Pacific Ocean, Geochim. Cosmochim. Acta, 40, 249–251, 1976.
Wada, E. and Hattori, A.: Nitrogen isotope effects in the assimilation of inorganic nitrogenous compounds by marine diatoms, Geomicrobiol. J., 1, 85–101, 1978.
Wada, E.: Nitrogen Isotope fractionation and its significance in biogeochemical processes
oc-5
curring in marine environments, In Isotope marine Chemistry, 375–398, 1980.
Wada, E. and Hattori, A.: Nitrogen in the sea: Forms, Abundances, and rate processes, CRC Press, Boca Raton, Fla, 208, 1991.
Waser, N. A., Yin, K., Yu, Z., Tada, K., Harrison, P. J., Turpin, D. A., and Calvert, S. E.: Nitrogen isotope fractionation during nitrate, ammonium and urea uptake by marine diatoms and
coc-10
colithophores under various conditions of N availability, Mar. Ecol. Prog. Ser., 169, 29–41, 1998.
OSD
4, 245–264, 2007
15
N enrichment in PON of the Arabian
Sea
S. Kumar and R. Ramesh
Title Page Abstract Introduction Conclusions References Tables Figures ◭ ◮ ◭ ◮ Back Close Full Screen / Esc
Printer-friendly Version Interactive Discussion
EGU
Table 1. Particulate organic nitrogen (PON) and nitrogen isotopic composition (δ15N) observed during present study.
Month Stations PON δ15N
(µM N) (‰) January 2 1.61 6.7 (SK-186) 3 1.06 2.7 4 0.99 4.6 5 1.27 5.8 6 0.75 3.8 7 0.79 1.7 8 0.16 5.1 9 0.65 4.7 10 0.86 4.6 11 1.2 5.7 12 0.89 2.3 13 2.1 7.5 14 1.21 5.6 Late February– 2 1.04 10.4 early March 3 2.25 10.6 (SS-212) 4 1.61 10.9 5 2 8.1 6 1.13 7
OSD
4, 245–264, 2007
15
N enrichment in PON of the Arabian
Sea
S. Kumar and R. Ramesh
Title Page Abstract Introduction Conclusions References Tables Figures ◭ ◮ ◭ ◮ Back Close Full Screen / Esc
Printer-friendly Version Interactive Discussion EGU (a) 23 N 23 N 21 N 21 N 19 N 19 N 17 N 17 N 15 N 15 N 13 N 13 N 11 N 11 N 23 N 23 N 21 N 21 N 19N 17 N 17 N 15 N 15 N 13 N 13 N 11 N 11 N 74 E 74 E 72 E 72 E 70 E 70 E 68 E 68 E 66 E 66 E 66 E 66 E 68 E68 E 70 E70 E 72 E72 E 74 E74 E GOA INDIA GUJARAT SK-186 (January 2003) SK-186 (January 2003) 2 3 14 13 12 11 10 9 8 7 6 5 4 (b) 6 5 4 3 2 23 N 21 N 19 N 17 N 15 N 13 N 11 N 23 N 21 N 19N 17 N 15 N 13 N 11 N 74 E 72 E 70 E 68 E 66 E 66 E 68 E 70 E 72 E 74 E GOA INDIA GUJARAT
SS-212 (Late February- early March 2003)
OSD
4, 245–264, 2007
15
N enrichment in PON of the Arabian
Sea
S. Kumar and R. Ramesh
Title Page Abstract Introduction Conclusions References Tables Figures ◭ ◮ ◭ ◮ Back Close Full Screen / Esc
Printer-friendly Version Interactive Discussion EGU (a) SST ( oC ) 2 4 6 8 10 12 14 22 23 24 25 26 27 28 29 30 Stations (b) 22 23 24 25 26 27 28 29 2 3 4 5 6 Stations SST ( oC ) (c) D e p th (m ) 22 23 24 25 26 27 28 29 2 6 14 12 10 9 Temperature (oC) 0 20 40 60 80 100 120 (d) 22 23 24 25 26 27 28 2 6 3 5 4 Temperature (oC) D e p th (m ) 0 20 40 60 80 100 120 140
Fig. 2. Hydrodynamic conditions during sampling (a) sea surface temperature-January (b)
sea surface temperature-late February–early March (c) temperature based mixed layer depth– January (d) temperature based mixed layer depth – late February–early March.
OSD
4, 245–264, 2007
15
N enrichment in PON of the Arabian
Sea
S. Kumar and R. Ramesh
Title Page Abstract Introduction Conclusions References Tables Figures ◭ ◮ ◭ ◮ Back Close Full Screen / Esc
Printer-friendly Version Interactive Discussion EGU (a) PON (μM N) δ1 5N (% 0 ) 0.0 0.5 1.0 1.5 2.0 2.5 0 2 4 6 8 10 12 δ μ (b) μ δ δ1 5N (% 0 ) Nitrate (μM) 0 1 2 3 4 0 2 4 6 8 10 12
OSD
4, 245–264, 2007
15
N enrichment in PON of the Arabian
Sea
S. Kumar and R. Ramesh
Title Page Abstract Introduction Conclusions References Tables Figures ◭ ◮ ◭ ◮ Back Close Full Screen / Esc
Printer-friendly Version Interactive Discussion
EGU
Fig. 4. Relationship between δ15N and fraction of remaining substrate (f) assuming different fractionation factors.