HAL Id: hal-00316869
https://hal.archives-ouvertes.fr/hal-00316869
Submitted on 1 Jan 2001
HAL is a multi-disciplinary open access
archive for the deposit and dissemination of
sci-entific research documents, whether they are
pub-lished or not. The documents may come from
teaching and research institutions in France or
abroad, or from public or private research centers.
L’archive ouverte pluridisciplinaire HAL, est
destinée au dépôt et à la diffusion de documents
scientifiques de niveau recherche, publiés ou non,
émanant des établissements d’enseignement et de
recherche français ou étrangers, des laboratoires
publics ou privés.
to a southward turning of the interplanetary magnetic
field
K. A. Mcwilliams, T. K. Yeoman, J. B. Sigwarth, L. A. Frank, M. Brittnacher
To cite this version:
K. A. Mcwilliams, T. K. Yeoman, J. B. Sigwarth, L. A. Frank, M. Brittnacher. The dayside ultraviolet
aurora and convection responses to a southward turning of the interplanetary magnetic field. Annales
Geophysicae, European Geosciences Union, 2001, 19 (7), pp.707-721. �hal-00316869�
Annales
Geophysicae
The dayside ultraviolet aurora and convection responses to a
southward turning of the interplanetary magnetic field
K. A. McWilliams1, T. K. Yeoman1, J. B. Sigwarth2, L. A. Frank2, and M. Brittnacher3
1Department of Physics and Astronomy, Leicester University, University Road, Leicester LE1 7RH, UK 2The University of Iowa, Department of Physics and Astronomy, Iowa City, Iowa 52242, USA
3University of Washington, Geophysics Program, Box 351650, Seattle, Washington 98195, USA
Received: 29 January 2001 – Revised: 14 May 2001 – Accepted: 16 May 2001
Abstract. We examine the large-scale ultraviolet aurora and
convection responses to a series of flux transfer events that immediately followed a sharp and isolated southward turn-ing of the IMF. Durturn-ing the interval of interest, SuperDARN was monitoring the plasma convection in the dayside north-ern ionosphere, while the VIS Earth Camera and the Far Ul-traviolet Imager (UVI) were monitoring the northern hemi-sphere’s ultraviolet aurora. Reconnection signatures were seen in the SuperDARN HF radar data in the postnoon sector following a sharp southward turning of the IMF. The pres-ence of flux transfer events is supported by measurements of a classic dispersed ion signature in the low-altitude cusp from the DMSP spacecraft. Subsequent to the onset of re-connection, the postnoon convection and ultraviolet aurora expanded in concert, reaching 18 MLT in half an hour. The auroral oval was found to move equatorward at the convec-tion speed in the 16–18 MLT sector, implying that it was related directly to an adiaroic magnetospheric boundary. In the present study, we have estimated the field-aligned current response to magnetic reconnection in terms of the vorticity of the ionospheric plasma convection velocity. The convec-tion velocities were obtained using two methods: (a) direct reconstruction of the full vector velocities from bistatic mea-surements of the convection by the SuperDARN HF radars in a relatively small region of the auroral zone, and (b) from global-scale spherical harmonic fits to the SuperDARN ve-locities deduced from the map potential model. Regions of high vorticity, which were predicted to be an estimate of a component of the total field-aligned current, agree extremely well with the images of the dayside UV aurora, indicating that, in this case, the plasma vorticity is an excellent esti-mator of the morphology of dayside field-aligned currents (FACs). The morphology of the aurora and ionospheric elec-tric field in the postnoon sector supports the existence of a dayside current wedge induced in response to dayside recon-nection.
Correspondence to: K. A. McWilliams
Key words. Magnetospheric physics (auroral phenomena;
magnetosphere-ionosphere interactions; solar wind magne-tosphere interactions
1 Introduction
Ground-based measurements are an essential component of the study of dayside magnetic reconnection occurring at the distant magnetopause. In situ measurements have shown that reconnection can be bursty in nature (Haerendel et al., 1978, Russell and Elphic, 1978, 1979; Lockwood and Wild, 1993; Kuo et al., 1995), and this is known to directly af-fect the ionosphere. The STARE radar measurements of Go-ertz et al. (1985) suggested that periodic anti-sunward flows in the ionosphere seen poleward of the convection reversal boundary may be indicative of bursts of dayside reconnec-tion. It has since been shown that the ionosphere does re-spond to these bursts of magnetic flux transfer. Elphic et al. (1990) presented in situ bipolar magnetic variations from the ISEE 2 spacecraft that were followed several minutes later by ionospheric convection enhancements observed by the EISCAT radar and by dayside auroral breakups observed by an all-sky camera. More recently, a unique conjunction of ground-based HF radar observations of a poleward mov-ing ionospheric flow burst and of magnetically conjugate in
situ measurements of a bipolar magnetic field signature at the
magnetopause were reported by Neudegg et al. (1999). High velocity poleward moving patches of HF radar backscatter observed by Pinnock et al. (1991, 1993) were linked to mag-netopause flux transfer events (FTEs) by low-altitude par-ticle data from DMSP satellites. Moen et al. (1995) ob-served antisunward propagating red-line auroral features in the postnoon sector, poleward of sunward flow measured by EISCAT, and related these to particle data obtained dur-ing a DMSP overpass. The combined ionospheric observa-tions by meridian scanning photometers and HF radars with low altitude particle measurements from the DMSP satel-lite of Yeoman et al. (1997) demonstrated that strong HF
radar echoes, poleward moving red-line auroral features, and dispersed ion precipitation features were collocated. Multi-instrument case studies employing all-sky cameras, merid-ian scanning photometers, and arrays of ground magnetome-ters have all presented possible evidence of the appending of regions of newly reconnected magnetic flux to the day-side polar cap, followed by ionospheric convection and au-rora which is excited in response to reconnection (Sandholt et al., 1999; Øieroset et al., 1996). McWilliams et al. (2000a) revealed that on a statistical basis the distribution of HF radar convection velocity fluctuations is extremely similar to both the distribution of the “inter-FTE interval” observed in the vicinity of reconnection (Lockwood and Wild, 1993; Kuo et al., 1995), and the distribution of the temporal separation be-tween poleward moving auroral forms (Fasel, 1995).
Milan et al. (2000) presented combined observations of the ionospheric convection velocities observed by the CUT-LASS Finland HF radar and of the dayside ultraviolet au-rora observed by the Far Ultraviolet Imager (UVI) following a southward turning of the IMF under disturbed conditions. The mainly antisunward convection velocities had a dawn-ward (westdawn-ward) component, as expected for the upstream positive IMF By component, while bands of UV aurora
ap-peared to bifurcate and move eastward. The difference be-tween the phase velocity of the UV auroral bands and the ionospheric convection velocity led Milan et al. (2000) to conclude that the magnetopause reconnection site was propa-gating azimuthally along the dusk flank of the magnetopause, peeling flux from the dayside magnetopause during large-scale FTEs.
In the present paper, we continue the study of an interval of data presented by McWilliams et al. (2000b), in what will henceforth be referred to as Paper 1. Paper 1 was a detailed examination of the phase velocity of a patch of antisunward-moving HF radar echoes and the first ever two-dimensional convection velocities within such a patch. The velocity com-parison revealed a prolonged interval during which it was concluded that the reconnection site propagated azimuthally along the magnetopause, peeling away flux in the manner de-scribed by Milan et al. (2000). Early multi-instrument stud-ies have also revealed qualitative evidence of an expansion of the footprint of the magnetospheric reconnection X-line, but the instruments employed did not allow for a demonstra-tion of the phase speed of such an expansion (Sandholt et al., 1999; Øieroset et al., 1996). In the present study, we will examine more closely the relationship between the auroral and convection responses to a series of FTEs. In particu-lar, we will relate the ionospheric convection measurements to the dayside auroral morphology, incorporating ultravio-let images, field-aligned current (FAC) estimates, and par-ticle precipitation data from low altitude orbiting satellites. Such combined electric field and auroral observations allow for a unified view of the particle and field characteristics of the dayside reconnection process to be assembled, includ-ing FACs, which directly link the ionosphere and magneto-sphere. The results from Paper 1 will be supplemented with particle precipitation data from the DMSP-F11 spacecraft,
and the localised postnoon sector analysis of convection, au-rora, and FACs will be extended to encompass a more global picture of the magnetospheric and ionospheric responses to reconnection.
2 Instrumentation
2.1 Imaging the ultraviolet aurora
Measurements of the far ultraviolet aurora have been ob-tained by the Visible Imaging System (VIS) Earth Camera (Frank et al., 1985) and by the Far Ultraviolet Imager (UVI) (Torr et al., 1995), both aboard the Polar spacecraft. The imagers are mounted on a despun platform allowing for un-interrupted views of the aurora.
UVI measures auroral emission in the Lyman-Birge-Hopfield bands, resulting from electron impact excitation of N2. The imager has two filters centred at 150 nm and 170 nm,
which isolate the LBHs and LBHl bands, respectively. The auroral features presented in this study are evident in both LBHs and LBHl, but are perhaps somewhat more apparent in the LBHs images. Therefore, the LBHs data is presented here. The integration time of the images is 36 seconds, and the field of view covers the duskside auroral oval during the interval of interest. The Polar spacecraft is at an altitude of approximately 5.4 RE, and the spatial resolution of UVI is
22 to 25 km in the ionosphere.
The VIS Earth Camera monitors the aurora with a rela-tively broad passband at far ultraviolet wavelengths (124– 149 nm), and is primarily sensitive to the atomic oxygen emission at 130.4 nm. The integration time of the camera is 32.5 s. At an altitude of 5.4 RE, the spatial resolution
of the Earth Camera in the atmosphere is approximately 50 km. At this altitude the camera is capable of imaging the en-tire northern auroral zone. Both the LBHs emission, seen by UVI, and the OI emission seen by VIS are due to electron impact excitation, and are therefore comparable. An exami-nation of the region of overlap in the prenoon sector showed that the large-scale auroral features are present in the images from both instruments, and this is evident, for example, in Fig. 5.
2.2 Measuring ionospheric plasma convection
The Super Dual Auroral Radar Network (SuperDARN) is an international collaborative network of HF radars that monitor ionospheric plasma convection in the northern and southern polar regions (Greenwald et al., 1995). The radars normally sound 16 beams sequentially to form a full 52◦azimuth scan. During the present interval of interest, a high-time resolution mode was employed with a beam dwell time of 3 s, and each of the SuperDARN radar pairs was synchronised to perform a full sixteen-beam scan every minute. Seventy-five range gates are measured along each beam and the range to the first gate is 180 km. The gate length is 45 km, which is comparable to the VIS Earth Camera pixel size during this
interval. The typical angular resolution is 3.2◦, or a
half-power beam width of about 85 km at the half-range mark of 1500 km. The analysis of the autocorrelation function of the echoes from the transmitted 7-pulse sequence yields backscattered spectra from which the backscattered power, the mean Doppler velocity (an estimate of the component of the ionospheric plasma drift velocity along the beam), and the spectral width can be determined. During the interval of interest in the present study, three of the SuperDARN radars were receiving backscattered signals from large portions of the dayside auroral zone.
The Co-operative UK Twin Located Auroral Sounding System (CUTLASS) (Milan et al., 1997) is the eastern-most pair of SuperDARN radars in the northern hemisphere. Backscatter measurements from both CUTLASS radars, lo-cated at Hankasalmi, Finland (62.3◦ N, 26.6◦ E) and at Þykkvibær, Iceland (63.8◦ N, 19.2◦ W), were made in the postnoon sector. It was the data from this radar pair that were examined in detail in Paper 1. The SuperDARN radar at Stokkseyri, Iceland (63.9◦ N, 20.0◦ W) was monitoring
plasma convection in the prenoon sector. Therefore, excel-lent coverage of the dayside auroral oval was achieved. HF radars are particularly sensitive to cusp region backscatter (Milan et al., 1998). The F-region irregularities produced by soft particle precipitation in the footprint of the cusp mani-fest themselves as discrete radar auroral forms near magnetic local noon.
3 Observations
3.1 Previous results from Paper 1
Paper 1 consisted of a detailed analysis of the first two-dimensional measurements ever made of the ionospheric convection velocity vectors within the footprint of the newly reconnected flux tubes. These were measured between 10:58 UT and 11:25 UT on 24 November 1998. A prolonged period of northward IMF had resulted in a very quiet magne-tosphere. The Bycomponent of the IMF was predominantly
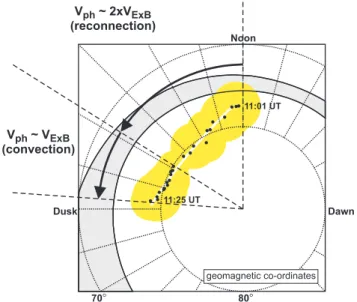
negative, with a small positive excursion at approximately 11:25 UT. Following a sharp southward turning of the IMF, a patch of high-power radar backscatter appeared in the fields of view of the HF radar pair very close to local noon. The feature then proceeded towards 18 MLT over the next half hour where it left the radar’s field of view. The trajectory of the feature is illustrated in Fig. 1. The full-vector convection measurements allowed for a comparison of the ionospheric plasma convection velocity VE×Band the phase velocity Vph
of the footprint of the newly reconnected flux tubes. This comparison revealed that the motion of the patch of backscat-ter was comprised of two main stages, which are marked in Fig. 1. Initially the phase speed of the patch was very fast and varied rapidly, with a mean speed of 1850 m s−1, approxi-mately twice the average convection speed of 870 m s−1. In the second stage, the patch speed stabilised and slowed to an average value of 870 m s−1, which was very close to the
Fig. 1. As described in Paper 1, following a sharp southward
turn-ing of the IMF, a patch of radar backscatter appeared near mag-netic local noon. The small black dots mark the central position of the feature, and the large yellow circles represent its approxi-mate extent as it propagated anti-sunward into the postnoon sector. The phase speed Vphof the feature appears to be comprised of two regimes: one of fast, highly variable motion, where the mean phase speed is approximately twice the convection speed VE×B, and a second regime of slower, more steady motion, where the average phase speed is very similar to the convection speed.
mean plasma convection speed of 840 m s−1. Three iono-spheric convection bursts were observed by the Þykkvibær radar following the southward IMF turning, one approxi-mately every 10 minutes. The second patch appeared before the phase velocity of the first patch slowed to the convection velocity. Estimates of the cross-polar cap potential difference and of the reconnection voltage were very consistent at about 60 kV.
3.2 Low altitude particle precipitation
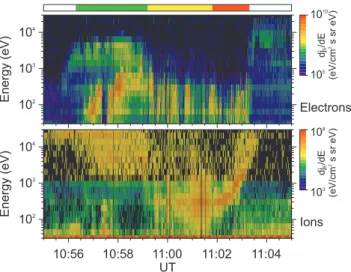
Particle precipitation data have been provided by the DMSP F11 satellite, which orbits at an altitude of approximately 830 km. The satellite traversed the dayside northern hemi-sphere between 10:56 UT and 11:04 UT, travelling from ap-proximately 18 to 11 MLT. The electron and ion spectra in Fig. 2 demonstrate that the satellite passed through three ma-jor particle regimes as it traversed the northern hemisphere auroral zone and polar cap. These are denoted by the colour-coded bar at the top of Fig. 2. The satellite first encoun-tered a region of high energy ions and high electron flux between approximately 10:56:30 UT and 10:59:30 UT, and this has been denoted by the green colour-code. The satel-lite then encountered lower energy ions and electrons. This part of the spectrum (approximately 10:59:30–11:02:00 UT) has been colour-coded yellow. At approximately 11:02 UT, a dispersed ion signature appears and it is accompanied by fluxes of low-energy electrons. This feature has been
colour-Fig. 2. The electron and ion spectra measured between 10:55 UT
and 11:05 UT on 24 November 1998 onboard the DMSP-F11 space-craft. The satellite passed through three major particle regimes as it traversed the northern hemisphere auroral zone and polar cap. The colour bar at the top denotes the three major particle regimes en-countered by the spacecraft.
coded red. These precipitation regions will be discussed in the context of the dayside ultraviolet aurora in Sect. 4.2. 3.3 The ultraviolet aurora: An overview
Both the VIS Earth Camera and UVI were monitoring the northern polar cap prior to and following the southward turn-ing of the IMF. The VIS Earth Camera was imagturn-ing the entire auroral zone, while UVI, whose field of field of view is ap-proximately one-quarter that of the VIS Earth Camera, was directed at two smaller regions, initially at the prenoon au-roral zone until the 11:12:52 UT scan, and thereafter, at the midnight sector.
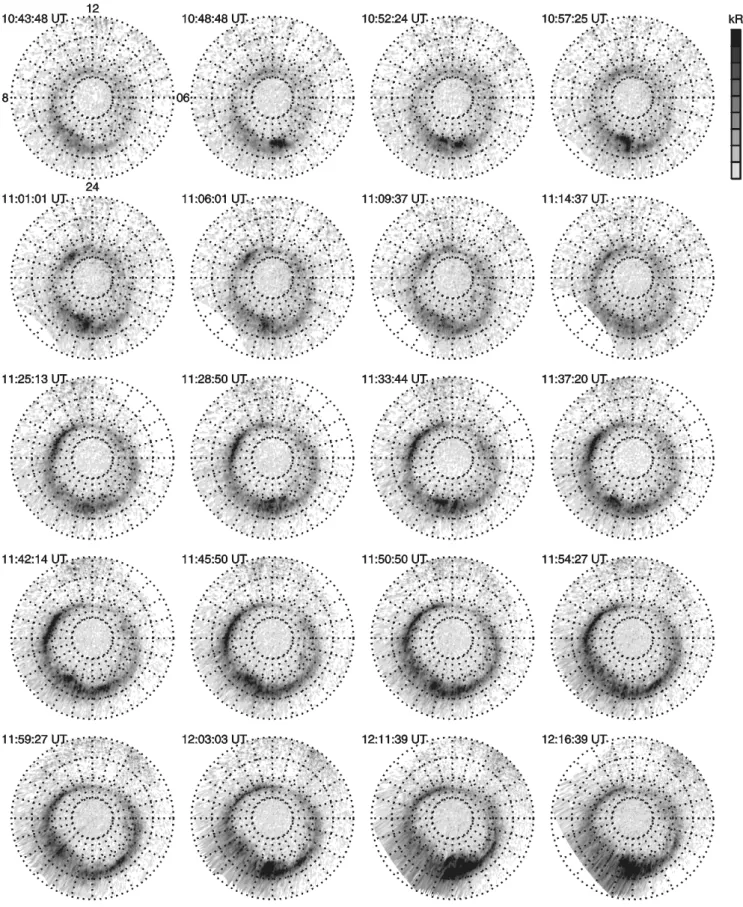
The development of the northern hemisphere ultraviolet aurora captured in the VIS Earth Camera images between 10:43:48 UT and 12:11:39 UT is summarised in Fig. 3. Magnetic local noon is towards the top of the maps, and each dashed circle marks 10◦in magnetic latitude. Prior to 11:00 UT there is very little aurora visible on the dayside and it has intensities less than 3 kR. The southward turning of the IMF was shown in Paper 1 to have affected the HF radar data between 10:58 UT and 10:59 UT, and it is therefore expected that the aurora will respond synchronously. Some time be-tween the 10:57:25 UT and the 11:01:01 UT scans, there is a brightening of the postnoon aurora centred at 14 MLT and the 75◦magnetic latitude, which agrees with the radar response. By 11:25:13 UT the postnoon aurora has developed into a bright discrete band extending from 13 MLT to 18 MLT. The bright aurora then extends further to form a nearly complete ring. A substorm that was detected by the CANOPUS mag-netometer at Dawson City at 12:00 UT, as described in Paper 1, is also seen in the VIS Earth Camera images in the mid-night sector from 12:03:03 UT onwards. At this time, the
auroral images are beginning to suffer significant distortion as the spacecraft approaches the horizon near 9 MLT. 3.4 Convection and auroral responses to reconnection In this section, the images of the ultraviolet auroral oval will be compared directly with ionospheric convection veloci-ties from SuperDARN. Discussion of the CUTLASS line-of-sight data is not included here since a detailed description and analysis was presented in Paper 1. The two-dimensional convection velocities have been determined using two meth-ods. First, where bistatic measurements of the convection have been made, i.e. in the postnoon sector by the two CUT-LASS radars, the two velocity components have been com-bined to produce full vector convection velocities. These merged vectors, which are illustrated in Fig. 5, are drawn with the foot of the vector at the location where the mea-surements were made and the arrow denoting the direction and the magnitude of the plasma flow. Second, equipotential contours have been determined by fitting a series of spher-ical harmonic functions to the convection velocity compo-nents measured by the SuperDARN radars and constraining the fits with statistical convection models based on upstream IMF conditions. This is known as the “map potential model” (Ruohoniemi and Baker, 1998). The electrostatic relations in the ionosphere:
E = −∇8; v = E × B
B2 (1)
mean that the equipotential contours are also velocity stream-lines.
Following the southward turning of the IMF, the extent of the measurements in the dayside auroral zone by the Super-DARN radars steadily increases. The coverage of the day-side auroral zone by the Þykkvibær (E), Hankasalmi (F ), and Stokkseyri (W ) SuperDARN radars is summarised in Fig. 4. The increased data coverage of the dayside auroral zone after the southward IMF turning, especially the post-noon sector, means that the map potential model is well con-strained there by measured values. The better the data cov-erage, the more indicative of the true ionospheric convection pattern the map potential contours are believed to be, as it is less influenced by the statistical models. The postnoon convection reversal boundary is well-defined following the southward IMF turning, while in the morning sector, it takes approximately 15 minutes for the radar coverage to extend far enough to determine accurately the prenoon convection reversal boundary away from noon. By 11:25 UT, in Fig. 4d, the three SuperDARN radars are monitoring the dayside au-roral zone between 7 MLT and 19 MLT, with the convec-tion reversal boundary well-defined between 7 MLT and 16 MLT. The comparison of the convection velocities measured by SuperDARN and the auroral images from the VIS Earth Camera and UVI reveals a unified picture of the field and par-ticle response to reconnection following the southward IMF turning.
Fig. 5a demonstrates the state of the ionosphere prior to the first indications of a response in the HF radar data to the
Fig. 3. The development of the northern hemisphere ultraviolet aurora captured in the VIS Earth Camera images between 10:43:48 UT and
12:11:39 UT. Each straight dashed line denotes one hour of local time with 12 MLT towards the top of the figure, and each dashed concentric circle marks 10◦in magnetic latitude.
Fig. 4. The map potential contours derived from the Doppler
veloc-ities measured in the dayside auroral zone by the Þykkvibær (E), Hankasalmi (F ), and Stokkseyri (W ) SuperDARN radars. Equipo-tential contours have been determined by fitting a series of spher-ical harmonic functions to the measured convection velocity com-ponents measured by the SuperDARN radars and constraining the fits with statistical convection models based on upstream IMF con-ditions. Following the southward turning of the IMF, the extent of the measurements in the dayside auroral zone by the SuperDARN radars steadily increases.
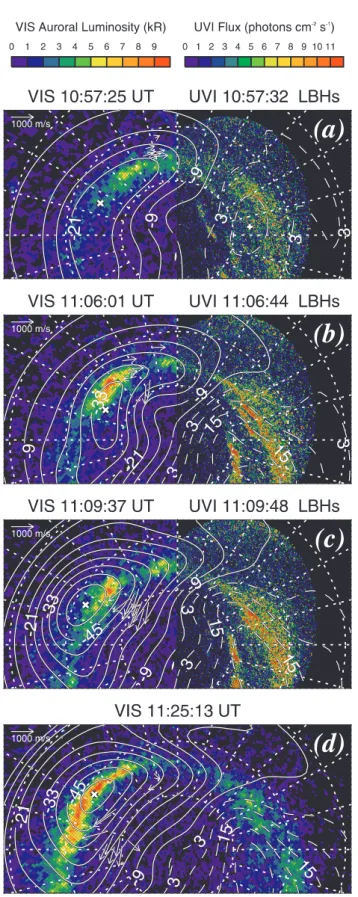
southward IMF turning, as discussed in Paper 1. The equipo-tential contours obtained from the sixth order fit of the map potential model and the merged velocity vectors from CUT-LASS have been superimposed onto the images of the far ultraviolet aurora from both the VIS Earth Camera and UVI. There is a faint band of aurora in the postnoon sector, which is co-located with the convection reversal boundary of the map potential contours. The map potential fitting technique gives a value of 34 kV for the cross-polar cap potential dif-ference.
Several minutes after the southward IMF turning, the con-vection and the aurora have evolved into the configuration presented in Fig. 5b. The cross-polar cap potential differ-ence has doubled to 75 kV. The postnoon convection reversal obtained by the map potential model agrees very well with the independently determined CUTLASS merged convection velocities. The strongest aurora in the postnoon sector is co-located with the convection reversal boundary and it peaks at the centre of the postnoon convection cell. The prenoon aurora has become more distinct with three main bands con-siting of a dark region flanked latitudinally by bands of bright aurora. While the prenoon convection cell is centred on the dark band between the two bright bands of aurora, one must exercise caution when comparing the two as the map poten-tial contours are largely determined by a statistical convec-tion pattern in this region.
By 11:09 UT (Fig. 5c) the cross-polar cap potential differ-ence from the map potential model is 70 kV. The postnoon convection reversal boundary is co-located with the large band of bright aurora seen by the VIS Earth Camera. The brightest postnoon aurora is measured between 15 and 16 MLT and reaches values of about 8 kR. In the prenoon sec-tor, the convection cell is centred on the dark region between the two bright bands of aurora as seen by UVI. While the prenoon radar coverage is not extensive, a convection rever-sal is directly measured between 10 and 11 MLT, which will constrain the noon portion of the prenoon convection cell. The direction of the merged CUTLASS velocity vectors in the postnoon sector agree quite well with the equipotential contours.
The postnoon aurora at 11:25 UT, seen in Fig. 5d has ex-panded in local time to a band stretching from 14 MLT to 18 MLT, and the measured luminosity exceeds 9 kR through-out its local time extent. The postnoon convection reversal boundary determined by the map potential model still lies very close to the band of luminous aurora in the postnoon sector, and the prenoon convection reversal boundary lies poleward of the luminous aurora in the prenoon sector. The fitted cross-polar cap potential difference is 96 kV at this time and the IMF Bycomponent was nearly zero.
4 Discussion
4.1 Results from Paper 1: Implications for magnetopause reconnection
The full-vector convection measurements presented in Pa-per 1 allowed for a comparison of the ionospheric plasma convection velocity and the phase velocity of the footprint of the newly reconnected flux tubes. This comparison re-vealed that the motion of the patch of backscatter was com-prised of two main stages. Initially the phase speed of the patch was very fast and varyed rapidly, with the patch mov-ing at approximately twice the convection speed. In the sec-ond stage, the patch speed stabilised and slowed to plasma convection speed. The initial difference between the
con-vection and phase speeds was interpreted as the result of an extended interval of reconnection at the magnetopause as the reconnection site moved azimuthally through 4 hours in local time, peeling off flux from the magnetopause until 11:14 UT. Once reconnection had ceased, the newly reconnected flux
Fig. 5. The dayside utraviolet aurora measured by the VIS Earth
Camera and UVI and the spherical harmonic expansion of the iono-spheric equipotential contours deduced from the map potential tech-nique (Ruohoniemi and Baker, 1998). (a) The ionospheric condi-tions prior to reconnection as seen in the 10:57:25 UT VIS scan of the postnoon aurora, the 10:57:32 UT UVI scan of the prenoon au-rora, and the map potential contours from the 10:57–10:58 UT Su-perDARN radar scans. (b) The ionospheric conditions just follow-ing the onset of reconnection as seen in the 11:06:01 UT VIS scan of the postnoon aurora, the 11:06:44 UT UVI scan of the prenoon aurora, and the map potential contours from the 11:06–11:07 UT SuperDARN radar scans. (c) The ionospheric conditions just at the onset of the second burst of reconnection as seen in the 11:09:37 UT VIS scan of the postnoon aurora, the 11:09:48 UT UVI scan of the prenoon aurora, and the map potential contours from the 11:09– 11:10 UT SuperDARN radar scans. (d) The ionospheric conditions as the remnants of the first reconnected flux region convect out of the CUTLASS fields of view as seen in the 11:25:13 UT VIS scan of the dayside aurora, and the map potential contours from the 11:25– 11:26 UT SuperDARN radar scans.
tubes slowed down and began to move anti-sunward at the convection speed. Three ionospheric convection bursts were observed following the southward IMF turning, one approxi-mately every 10 minutes. The second burst appeared several minutes before reconnection was believed to cease in the first burst, implying that reconnection was continually occurring, but at different places on the magnetopause. As one episode of flux transfer peeled flux from the magnetopause, another began closer to local noon, peeling off the newly exposed geomagnetic flux. All factors discussed in Paper 1 indicated that this was an interval of moderate pulsed reconnection, and that the effects on the magnetosphere and ionosphere were considerable.
4.2 Low-altitude cusp spectra
Further evidence of reconnection is seen in the low-altitude particle precipitation data provided here by the DMSP-F11 satellite. The satellite passed through three major particle regimes, as described in Sect. 3.2 with respect to Fig. 2, and these were denoted by the colour-coded bar at the top of Fig. 2. In Fig. 6, the corresponding colour-coded iono-spheric footprint of the satellite track has been overlaid onto two VIS Earth Camera images of the UV aurora taken (a) at 10:57:25 UT (prior to the first effects of reconnection seen in the ionosphere, as discussed in Paper 1), and (b) at 11:01:01 UT (2–3 minutes after the reconnection signature was seen in the HF radar data in Paper 1). The potential contours deduced from the map potential technique (Ruohoniemi and Baker, 1998) for the 10:57 UT and 11:01 UT radar scans have also been superimposed on the UV images in Fig. 6. The white crosses on the DMSP track denote the satellite footprint dur-ing the one minute SuperDARN radar scans at 10:57 UT and at 11:01 UT that were used to calculate the map potential contours.
Fig. 6. The ionospheric footprint of the DMSP-F11 satellite
tra-jectory between 10:55 UT and 11:05 UT on 24 November 1998 overlaid onto the VIS Earth Camera images of the ultraviolet aurora from (a) 10:57:25 UT and (b) 11:01:01 UT. The satellite footprint has been colour-coded to indicate the particle regimes traversed by the satellite, according to the electron and ion spectra in Fig. 2. The potential contours deduced from the map potential technique (Ruo-honiemi and Baker, 1998) for (a) the 10:57 UT and (b) the 11:01 UT radar scans have been superimposed over the VIS images. The white crosses on the DMSP track denote where the satellite foot-print was during the nearest HF radar scan that includes the auroral image.
(green colour-code), it was located in the diffuse postnoon auroral oval, as seen in the VIS Earth Camera image from 10:57:25 UT in Fig. 6a. The satellite then encountered lower energy ions and electrons, the duration of which was denoted by the yellow colour-code. At this juncture, the satellite foot-print slipped into the polar cap just poleward of the bright aurora in both panels of Fig. 6. At approximately 11:02 UT, the classic dispersed ion signature in the low-altitude cusp of the distant magnetopause reconnection (e.g. Lockwood and Davis, 1996) appears, and it is accompanied by fluxes of low-energy electrons, as is typical of the cusp. The increasing en-ergy in the dispersed ion signature is typical of a DMSP pass through the cusp from poleward to equatorward. The dis-persed ion feature was encountered as the satellite travelled along the dayside convection reversal boundary determined from the map potential model. The patch of anti-sunward moving radar backscatter that appeared after the southward IMF turning was located at the same magnetic latitude as the satellite cusp footprint, but slightly eastward. The extent of the radar patch is denoted in Fig. 6b as the small poly-gon centred at approximately 13:30 MLT and at 77◦ mag-netic latitude. This radar feature was observed near the
west-ern edge of the radar’s field of view, which does not extend into the region where the satellite encountered the dispersed ion signature. It would appear that the satellite is passing equatorward and eastward through an extended cusp region. The presence of only one dispersed ion signature agrees with the CUTLASS radar measurements of only one pulsed iono-spheric flow burst at this time, i.e. only one episode of re-connection is occurring at this time. In contrast, low-altitude crossings of multiple FTE footprints can exhibit stepped ion energy dispersion (Lockwood et al., 1993b).
A comparative study by Neudegg et al. (2001) of flux transfer events, and convection and DMSP spectra is of a similar nature to the present study, and it is consistent with previous predictions and observations of reconnection. In their work, Neudegg et al. (2001) presented magnetically conjugate measurements of flux transfer events at the mag-netopause, which were detected by Equator-S, and anti-sunward convection bursts in the dayside ionosphere, as mea-sured by the SuperDARN Hankasalmi radar. These data were supplemented by images of the dayside UV aurora from the VIS Earth Camera and particle spectrograms from a DMSP pass just equatorward of the footprint of the reconnection re-gion. The convection velocity in the throat had a dawnward component, as expected, since the upstream IMF By
com-ponent was positive during the interval. Bright UV aurora was observed in the equatorward portion of the flow chan-nel events, located where the flow rotated from mainly west-ward to more polewest-ward. This is consistent with the predicted response to reconnection (Cowley et al., 1991; Lockwood et al., 1993c; Lockwood, 1994) and with other observations of the ionospheric response to reconnection during positive IMF Byconditions (Milan et al., 2000). The Neudegg et al.
(2001) conjunction did not allow the observation of dispersed ions: the DMSP-F14 footprint skimmed along the equator-ward edge of the bright UV aurora where it detected struc-tured electron precipitation that dominated the ions. This, along with the bright aurora, is suggestive of a region of up-ward FAC.
4.3 UV aurora response to southward IMF turning The UV imagers and HF radars allow us to explore the de-velopment of the dayside ionospheric response to reconnec-tion. The four panels in Fig. 5 represent snapshots of four stages in the reconnection process, taken over half an hour, and they are in accordance with the predictions of Cowley et al. (1991), Lockwood et al. (1993c), and Lockwood (1994).
Fig. 5a reflects the state of the ionosphere prior to the southward IMF turning, and consequently prior to the start of reconnection at the dayside magnetopause. In Paper 1, it was shown that conditions in the magnetosphere were very quiet prior to reconnection, and this approaches the pre-reconnection steady-state condition discussed in the models. There is a faint band of aurora in the postnoon sector that is co-located with the convection reversal boundary of the map potential contours. As will be discussed in Sect. 4.5, down-ward vorticity is related to updown-ward FACs, and updown-ward FACs
are primarily produced by precipitating electrons, which also excite auroral emissions. While the map potential model fits very well to the data, there are relatively few data points in the prenoon sector, and we believe that the equipotential con-tours there are controlled to a large extent by the statistical convection pattern that constrains the map potential fit. There is, therefore, less confidence in the map potential contours in this sector, so one must exercise caution when interpretting the fitted polar cap potential difference of 34 kV.
The state of the ionosphere during its initial response to reconnection, several minutes after the southward IMF turn-ing, is presented in Fig. 5b. In the models, this would cor-respond to the initial appending of a region of newly opened flux to the dayside polar cap. The cross-polar cap potential difference has increased from the estimated pre-reconnection value to 75 kV, as expected, since magnetopause reconnec-tion results in the enhancement of ionospheric convecreconnec-tion (Lockwood, 1991). The estimated reconnection voltage of 57 kV determined directly from the CUTLASS measure-ments in the postnoon sector in Paper 1 agrees very well with this estimate of the cross-polar cap potential difference. The postnoon convection reversal obtained by the map potential model agrees very well with the independently determined CUTLASS merged convection velocities. The postnoon au-rora has increased in brightness, with the strongest auau-rora in the postnoon sector co-located with the convection rever-sal boundary and it peaks at the centre of the postnoon con-vection cell. The prenoon aurora has become more distinct with three main bands consisting of a dark band flanked lat-itudinally by bright aurora, and the prenoon convection cell is centred on the dark band. At this time the SuperDARN radars have achieved increased coverage of the dayside auro-ral zone, especially in the postnoon sector. The map potential model is, therefore, better constrained by measured values there, and less influenced by the statistical models.
The state of the ionosphere after an extended interval of reconnection is presented in Fig. 5c. According to the anal-ysis in Paper 1, at 11:09 UT reconnection is still believed to be occurring in the first reconnection burst and the initial ev-idence of the second flux transfer event appeared near mag-netic local noon in the Þykkvibær radar data. The postnoon convection reversal boundary in Fig. 5c is nearly co-located with the band of bright aurora seen by the VIS Earth Cam-era. In the prenoon sector, the convection cell is centred on the dark region between the two bright bands of aurora, as seen by UVI. The direction of the merged CUTLASS ve-locity vectors in the postnoon sector agrees quite well with the equipotential contours at high latitudes, but near 75◦the
merged vectors are nearly purely eastward while the equipo-tential contours have a slight southward component. Since the merged vectors are a more direct measure of the plasma convection velocity, this discrepancy suggests that the poten-tial fitting technique has placed the centre of the postnoon convection cell slightly too far eastward. A comparison of the equipotential contours in panels (a) and (c) reveals an eastward increase in the longitudinal extent over which flow is likely crossing the polar cap boundary, supporting the
the-sis of an expanding reconnection X-line migrating duskward along the magnetopause.
Fig. 5d represents the final stage of the models of Cow-ley et al. (1991), Lockwood et al. (1993c), and Lockwood (1994), during which reconnection has ceased and the newly opened flux is incorporated into the polar cap. The mod-els predict that for an isolated flux transfer event such a pro-cess would continue for about 15 minutes until the polar cap achieves a new equilibrium. The postnoon aurora at 11:25 UT in Fig. 5d extends over four hours of local time, between 14 and 18 MLT. The leading portion of newly opened flux is approximately co-located with the eastward merged vec-tors at 18 MLT between about 76◦ and 80◦ magnetic lati-tude. The aurora and the reconnected flux region are still expanding eastward together even after reconnection ceased at 11:14 UT, as shown in Paper 1. These measurements are consistent with the development of the polar cap boundary to a new equilibrium near 18 MLT, while magnetic reconnec-tion is continuing near noon. The postnoon convecreconnec-tion re-versal boundary determined by the map potential model still lies very close to the band of luminous aurora in the post-noon sector, and the prepost-noon convection reversal boundary lies poleward of the luminous aurora in the prenoon sector. 4.4 Motion of postnoon aurora
In Paper 1, it was shown that ionospheric plasma flowed poleward across the open-closed field line boundary in the noon sector. The equatorward motion of the boundary be-tween high and low spectral widths (a proxy for the foot-print of the reconnection X-line) and the poleward convec-tion velocities across that boundary confirmed that this was the footprint of a region of active reconnection and estimates of 57 kV for the reconnection voltage were obtained. This value is very consistent with the cross-polar cap potential dif-ference of 60–70 kV obtained from the map potential model, as discussed in Paper 1.
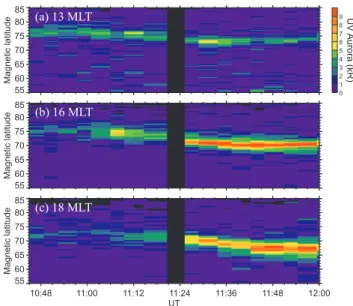
Between 16 MLT and 18 MLT, however, anti-sunward of the region of active reconnection according to the phase and convection velocity comparison, the equatorward motion of the aurora is more pronounced. The latitudinal variation of the UV auroral emissions measured by the VIS Earth Cam-era at (a) 13 MLT, (b) 16 MLT, and (c) 18 MLT between 10:45 UT and 12:00 UT are presented in Fig. 7. It is evi-dent from the three panels in Fig. 7 that the brightening of the aurora following the southward turning of the IMF is not instantaneous in all local time sectors. Instead, the au-rora becomes brighter at 16 MLT within three minutes of the brightening at 13 MLT, and the aurora at 18 MLT becomes brighter approximately 11 minutes after the brightening at 13 MLT. The bright aurora at 16 MLT and 18 MLT moves further equatorward than that measured at 13 MLT. At 13 MLT poleward plasma convection across the band of aurora was measured, and at 16 and 18 MLT, there was equator-ward flow at the same latitude as the band of bright aurora. The equatorward motion of the postnoon auroral oval dur-ing this interval can be compared directly with the
equator-Fig. 7. The latitudinal variation of the UV auroral emissions
mea-sured (a) 13 MLT, (b) 16 MLT, and (c) 18 MLT by the VIS Earth Camera between 10:45 UT and 12:00 UT.
ward plasma convection velocity derived from the map po-tential model. The poleward boundary of the postnoon aurora near 16 MLT moves approximately 4◦equatorward between 11:01:01 UT and 11:25:13 UT, amounting to a propagation velocity of 305 m s−1. Between 11:25 UT and 11:45 UT, the poleward boundary of the postnoon aurora near 18 MLT moves approximately 3.5◦ equatorward, giving a propaga-tion velocity of 315 m s−1. From the map potential contours
during this interval the equatorward velocity perpendicular to the auroral oval was estimated to be 300±50 m s−1. The postnoon auroral oval, therefore, moves equatorward at the plasma convection velocity. If the poleward edge of the au-roral oval acts as a proxy for the polar cap boundary, the polar cap is, therefore, expanding at the plasma convection velocity, with no flow across the boundary. This “adiaroic” boundary (Siscoe and Huang, 1985) is consistent with mod-els of reconnection-induced flows in the ionosphere in which the newly opened flux that was appended to the dayside po-lar cap is incorporated into a po-larger popo-lar cap (Cowley et al., 1991; Lockwood et al., 1993c; Lockwood, 1994).
4.5 Field-aligned currents
Sofko et al. (1995) demonstrated that SuperDARN measure-ments of ionospheric convection can be used to directly esti-mate FACs. The FAC density at ionospheric altitudes can be written explicitly as:
Jk=[6PB ·(∇×v)] + [(v ×B)·∇6P + (Bv)·∇6H] (2)
where v is the ionospheric plasma convection velocity, B is the geomagnetic field, and 6P and 6H are the
height-integrated Pedersen and Hall conductances, respectively. Ac-cording to the SuperDARN co-ordinate convention, a posi-tive FAC is radially out of the ionosphere, nearly anti-parallel
to the magnetic field in the northern hemisphere. The terms on the right-hand side of Eq. (2) can be grouped into two components: the ∇ · E component (the first term), and the ∇6 component (the last two terms). Bostrom (1974) re-ferred to these terms as the “magnetospheric” and the “iono-spheric” FACs, respectively. The ionospheric FAC term de-pends on the structure of the ionosphere through its varia-tion with the ionospheric conductance. The magnetospheric component depends on the vorticity of the plasma convec-tion velocity. SuperDARN convecconvec-tion measurements give a direct determination of B · (∇ × v), which is the magneto-spheric FAC per unit Pedersen conductance, Jmag/6P. The
SuperDARN coordinate convection, which we use, where the zdirection is radially out of the ionosphere, implies that an upward vorticity corresponds to a downward FAC and vice versa. This magnetospheric term is expected to dominate the ionospheric term in regions where there is little spatial vari-ation in the Pedersen and Hall conductance. The presence of large bright auroral arcs would indicate that there exists large gradients in the ionospheric conductance. In the case of a bright auroral arc centred on the postnoon convection reversal boundary, the magnetospheric term would maximise at the brightest part of the arc, while the ionospheric terms would oppose the magnetospheric term on the sides of the arc, reducing the overall FAC there. Knowledge of the iono-spheric conductance is, therefore, vital to the determination of the total FAC, but this is difficult to determine. Models are not accurate enough to represent minute-by-minute radar scans of the plasma convection, and conductivity estimates from the aurora itself are inaccurate because they can only be determined for specific spectral emission frequencies (corre-sponding to specific ionospheric altitude ranges), and, there-fore, one cannot integrate up through the ionosphere to obtain the total conductance (Germany et al., 1994).
4.5.1 Localised FACs derived from merged velocities To evaluate the plasma vorticity using SuperDARN radar data in the area formed by the intersection of two radar beams (a “merge cell”), one integrates the plasma velocity along the closed path formed by the four edges of the merge cell (Sofko, et al., 1995; McWilliams, 1997). The velocity along the boundary is determined by averaging the convection ve-locity in the merge cell with veve-locity components in the adja-cent merge cells surrounding it. Consequently, the vorticity is a smoothed value over an area of roughly 5 intersection cells, or about 3.6×10⁴km2. The SuperDARN HF radars, therefore, give an indication of large-scale magnetospheric FACs.
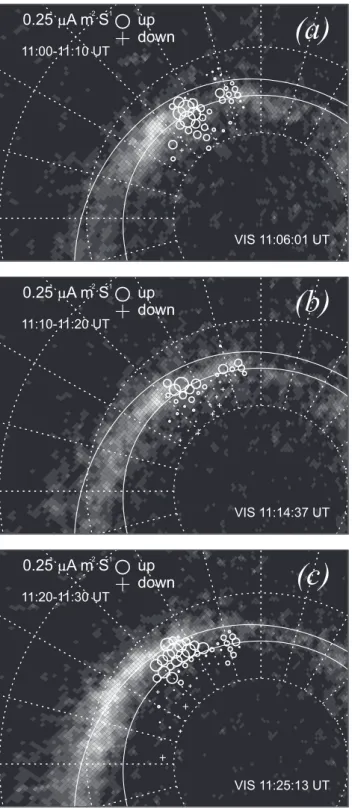
The ten minute plasma vorticity maps from 11:00–11:30 UT are presented in Fig. 8. Since each vorticity estimate re-quires data from several beam intersection regions, gaps in the data are very detrimental to the quality of the vorticity maps. The radar data has been averaged over 10 minutes in an attempt to fill in the gaps. The circles are the HF radar es-timates of the amount of upward FAC per unit Pedersen con-ductance (µA m−2 S−1), and the crosses are the HF radar
Fig. 8. The 10 minute plasma vorticity maps from 11:00–11:30 UT.
The circles represent the HF radar estimate of the amount of upward FAC per unit Pedersen conductance B ·(∇ × v) (µA m−2S−1), and the crosses represent the downward. The FAC estimates have been overlaid onto the VIS Earth Camera images that occur closest to the centre of the 10 minute averages. A quiet time statistical auroral oval has also been added. In all panels of Fig. 8 there is a band of upward FAC co-located with the intense ultraviolet aurora and this band has an average FAC density of approximately 0.2 µA m−2S. In panels (b) and (c) the upward FAC is flanked on the poleward edge by a band of downward FAC.
estimates of the downward. The FAC estimates have been overlaid onto the VIS Earth Camera images that occur clos-est to the centre of the 10 minute averages. A quiet time statistical auroral oval has also been added. In each panel of Fig. 8 there is a band of upward FAC co-located with the intense ultraviolet aurora and this band has an average FAC density of approximately 0.2 µA m−2 S−1. In panels (b) and (c), the upward FAC is flanked on the poleward edge by a downward FAC band. These FAC patterns are consistent with the statistical distribution obtained from magnetic field perturbations measured aboard the Triad satellite (Iijima and Potemra, 1976) and from the Viking satellite (Erlandson et al., 1988).
A gap is evident in both the UV aurora and the vorticity estimates measurements between 13 and 14 MLT in Fig. 8a. It persists in panel (b) and to a lesser extent in panel (c). The apparent drop out in the CUTLASS data in the vicinity of the gap is due to the nearly vorticity-free flow measured there. In the single-scan merged data (not shown), the CUTLASS radars measured an eastward electric field, directed from the dark region to the bright aurora in the vicinity of the gap. The gradient in the auroral brightness in the vicinity of the gap would suggest that the FAC estimate from the convec-tion vorticity is too simplistic, needing also to include the ionospheric conductance. The co-located upward FAC esti-mate and bright aurora in Fig. 8 indicate that the direction of the FAC estimate in these regions is likely to be correct. The eastern edge of the UV aurora gap appears to move east-ward with the region of newly reconnected flux from the first episode of flux transfer, with the centre of the newly opened flux region lying at the same local time as the eastern end of the gap. As seen in both Fig. 8 and Fig. 3, the gap in the au-rora is located between approximately 13 and 14 MLT in the 11:06:01 UT VIS image, and the eastern edge of the bright aurora has moved closer to 15 MLT by the 11:09:37 UT VIS image. After this time, it is difficult to determine the effect of the initial burst of reconnection on the aurora, since (as discussed in Paper 1) a second patch of anti-sunward moving radar backscatter, indicative of a second burst of reconnec-tion, appeared closer to noon at 11:10 UT in the Þykkvibær data. There is also evidence for a third FTE signature in the Þykkvibær data at 11:20 UT. The FACs induced by several bursts of reconnection are expected to combine to form a complex pattern of currents in the auroral zone and polar cap (Lockwood et al., 1993a). These observations suggest that the aurora and convection are responding to rapidly varying FACs near the reconnection region, with a downward FAC displaying its footprint in the auroral gap and an upward FAC with its footprint in the adjacent bright aurora to the east with possible current closure via the Pedersen current along the eastward electric field in the ionosphere. Further combined field and particle measurements of the type presented here are essential to confirm the existence of the dayside current wedge.
Russell et al. (1974) originally suggested that the appli-cation of a reconnection voltage to the magnetopause could modify the magnetopause current, thereby inducing a
cur-Fig. 9. The dayside current wedge. The westward current induced
in the merging region flows along the geomagnetic field lines down to the ionosphere then eastward in the ionosphere parallel to the electric field as the Pedersen current nears the equatorward bound-ary of the ionospheric cusp signature, and back out to the magneto-sphere along the geomagnetic field.
rent circuit in the dayside magnetosphere similar in form to the substorm current wedge. Further consideration of this concept was presented several years later by Glaßmeier and Heppner (1992) who postulated that reconnection would lead to a “magnetopause counter current” fed by the upward and downward FACs associated with the Alfvén pulses launched from the merging region to reduce magnetic stress along the newly opened field lines. Some evidence of the cur-rent circuit was presented by Glaßmeier (1992) in their study of equivalent ionospheric currents and FACs deduced from ground-based magnetometers. Glaßmeier (1992) discussed a “counter-current,” or “reconnection current,” generated in response to magnetic field deformation in the merging re-gion, and went on to propose that the FACs generated by the reconnection-induced Alfvén pulses are associated with ionospheric travelling convection twin-vortices. Glaßmeier (1992) proposed that the circuit including these FACs, which initially would have the same sense as the dayside Region 1 FACs, and the magnetospheric counter-current, would form a transitory current loop associated with travelling convection twin-vortices which he called the “dayside current wedge.”
The combined auroral and convection data presented in Fig. 8 offer evidence of the existence of the ionospheric portion of such a magnetospheric current circuit. The small-scale FAC structure inferred from the ultraviolet aurora and the direct measurement of an eastward electric field in the region of newly reconnected flux tubes are consistent with the dayside current wedge illustrated in Fig. 9. The induced current on the magnetopause, which is
effectively a diminution of the magnetopause current, can close by FACs at the ends of the reconnection X-line, which are directed towards the ionosphere on the western end and away from the ionosphere on the eastern end. The circuit is completed via an eastward ionospheric Pedersen current. The eastward motion of the auroral gap and the region of newly reconnected flux is in accordance with the eastward expansion of the reconnection X-line deduced in Paper 1.
4.5.2 Global FACs derived from the map potential model In Fig. 5, it was demonstrated that the convection reversal boundary, determined both from the map potential model and the bistatic measurements of the ionospheric convection, was colocated with a band of bright aurora in the postnoon sector and with a dark band between two bands of luminous aurora in the prenoon sector. The sense of ionospheric plasma vor-ticity in the postnoon sector is downward, implying an up-ward magnetospheric FAC according to Eq. (2). An upup-ward FAC is produced primarily by precipitating electrons, which can give rise to the aurora, as was seen by the VIS Earth Camera. The situation is reversed in the prenoon sector with an upward vorticity implying a downward FAC. In this case, the FAC is formed by upward moving electrons and down-ward moving ions, both of which are not energetic enough to excite ultraviolet aurora. The luminous bands of aurora poleward and equatorward of the convection reversal bound-ary are formed by precipitating electrons in upward FACs, which close through the ionosphere with the downward FAC at the convection reversal boundary.
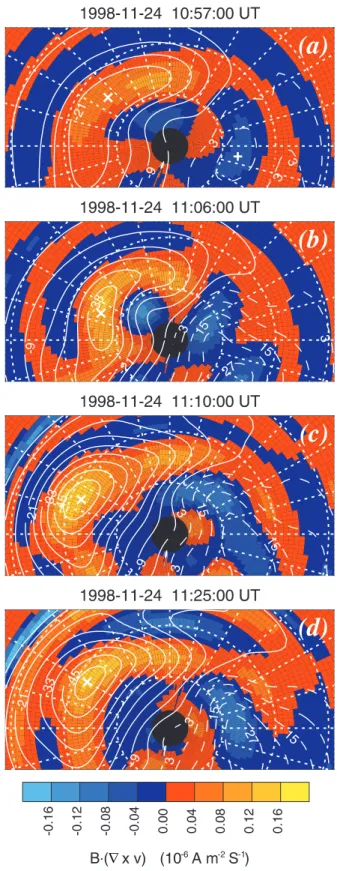
It is possible to take this large-scale, qualitative convec-tion and aurora comparison a step further by quantifying the vorticity of the map potential contours, which are velocity streamlines. In Fig. 10, the magnetospheric FAC per unit Pedersen conductance, B · (∇ × v), derived from the map potential equipotential contours are presented along with the potential contours from which they were derived for (a) 10:57 UT, (b) 11:06 UT, (c) 11:10 UT, and (d) 11:25 UT. These are the same times presented in the convection and aurora comparison in Fig. 5. The vorticity has been colour-coded such that negative vorticity (into the ionosphere) cor-responds to a positive FAC component (red), and a positive vorticity (out of the ionosphere) corresponds to a negative FAC component (blue). In the postnoon sector, the convec-tion reversal boundary gives rise to a large band of down-ward vorticity and, therefore, a large band of updown-ward FAC. The opposite case is true for the prenoon convection reversal boundary. The FAC estimates from the map potential model in Fig. 10 agree extremely well with the morphology of the UV aurora presented in Fig. 5, with bands of upward FAC co-located with bands of bright aurora, and bands of down-ward FAC co-located with dark regions in the auroral images. Due to the excellent agreement between the positions of the convection reversal boundary and the auroral emissions dur-ing this interval, at this time we take regions of high plasma
vorticity to be indicative of regions of strong FAC. While the agreement between the location of the FAC bands and auroral emissions is very good, it is important to note, for example, that the latitudinal extent of the upward FAC is much broader than that of the bright auroral emissions in the postnoon sec-tor. This apparent discrepancy underlines the importance of ionospheric conductance gradients in the determination of the FAC, as given in Eq. (2). The bands of aurora in Fig. 5 are very similar in form to the statistical distribution of FACs obtained from magnetic field perturbations measured aboard the Triad satellite (Iijima and Potemra, 1976). In the post-noon sector, a large-scale upward (bright) Region 1 FAC was flanked poleward and equatorward by the downward (dark) Region 0 and Region 1 FACs, respectively. In the prenoon sector, a large-scale downward (dark) Region 1 FAC was found to be flanked poleward and equatorward in the noon sector by upward (bright) Region 0 and Region 1 FACs, re-spectively. The FAC estimations from both the merge and map potential techniques agree very well with the FAC dis-tribution predicted in Paper 1 for an azimuthally expanding reconnection X-line, as presented in Fig. 10 of Paper 1.
5 Summary and conclusions
In this study, we examined the UV aurora and ionospheric convection responses to an interval of pulsed reconnection at the dayside magnetopause. It is a continuation of the de-tailed analysis of the postnoon ionospheric convection that was presented in Paper 1 (McWilliams et al., 2000b), which revealed that the first flux transfer event lasted for approx-imately 15 minutes, expanding 4 hours in local time into the postnoon sector from its initial reconnection site near magnetic local noon, peeling magnetic flux from the magne-topause as it expanded. After reconnection ceased, the patch of newly reconnected flux slowed to the convection speed. Further evidence of reconnection is provided by particle pre-cipitation data from the DMSP-F11 spacecraft. The satellite detected energy dispersed ions, the classic signature of the low-altitude cusp, in the vicinity of the radar signature of newly opened flux. The particle data confirmed the HF radar conclusion that there was only one burst of reconnection at that time, as the satellite encountered only one dispersed ion signature.
The combined aurora and convection observations of the dayside ionosphere provided snapshots of several stages in the reconnection process: (i) the quiet ionosphere prior to the southward IMF turning, (ii) the initial stage of tion, (iii) the latter stage of reconnection in the first reconnec-tion burst and the appearance of the second burst in the noon sector, and (iv) the end of the convection cycle of the first re-connection burst when the polar cap attempts to incorporate the newly reconnected flux and establish a new equilibrium. These data are consistent with predictions of the ionospheric response to reconnection. The ionospheric convection and the UV aurora expanded in concert following the onset of re-connection, taking between 15 and 30 minutes for the aurora
Fig. 10. The FAC estimate per unit Pedersen conductance
B · (∇ × v) (µA m−2S−1) obtained from the map potential con-tours for the scans starting at (a) 10:57 UT, (b) 11:06 UT, (c) 11:10 UT, and (d) 11:25 UT. The FAC direction is defined according to the SuperDARN coordinate convention, where z is radially out of the ionosphere. Negative vorticity (into the ionosphere) corresponds to a positive FAC component (red), and positive vorticity (out of the ionosphere) corresponds to a negative FAC component (blue).
and the convection to expand to 18 MLT. The ionospheric re-sponse to reconnection was, therefore, not instantaneous in this case.
The excellent agreement between the regions of high con-vection vorticity and the bands of aurora led to the quantifi-cation of the convection vorticity, which pertains directly to FACs. The global-scale FACs deduced from the vorticity of the map potential model agreed very well with the images of the UV aurora and with previous statistical studies of noon sector FACs. The smaller-scale, more localised FACs ob-tained from the merged vectors in the postnoon sector de-scribe the more rapidly varying FACs closer to the merging gap. The combined postnoon aurora and electric field ob-servations were consistent with the existence of a dayside current wedge that would form in response to the removal of flux during reconnection at the magnetopause. The west-ward current induced in the merging region flows down to the ionosphere via a FAC on the western end of the reconnection region, then eastward in the ionosphere as the Pedersen cur-rent nears the equatorward boundary of the ionospheric cusp signature, and back out to the magnetosphere via an upward FAC on the eastern end of the merging region. The east-ward motion of the auroral gap and the region of newly re-connected flux is in accordance with the eastward expansion of the reconnection X-line deduced in Paper 1.
Acknowledgement. CUTLASS is supported by the Particle Physics and Astronomy Research Council (PPARC grant no. PPA/R/R/ 1997/00256), UK, the Swedish Institute for Space Physics, Upp-sala, and the Finnish Meteorological Institute, Helsinki. The re-search at The University of Iowa was supported in part by NASA grants NAG5-3328 and NAG5-7712 and by NASA contract NAS5-30316. KAM gratefully acknowledges graduate research funding from the Association of Commonwealth Universities of the British Council. MB was supported by NASA grant NAG 5-3170. KAM would like to thank S. E. Milan for many helpful discussions. The authors are grateful to P. Newell for supplying the DMSP particle data. The authors would like to thank the principal investigators R. P. Lepping and K. Ogilvie for the use of key parameter data from the WIND MFI and SWE instruments, respectively. The authors would also like to thank J. Skura for his assistance with the DMSP data.
The Editor in Chief thanks P. E. Sandholt and M. Pinnock for their help in evaluating this paper.
References
Bostrom, R., Ionosphere-magnetosphere coupling, in: Magneto-spheric Physics, Ed. B. McCormac, D. Riedel, Dordrecht, pp. 45–59, 1974.
Cowley, S. W. H., Morelli, J. P. and Lockwood, M., Dependence of convective flows and particle precipitation in the high-latitude dayside ionosphere on the X and Y components of the interplan-etary magnetic field, J. Geophys. Res., 96, 5557–5564, 1991. Elphic, R. C., Lockwood, M., Cowley, S. W. H., and Sandholt, P. E.,
Flux transfer events at the magnetopause and in the ionosphere, Geophys. Res. Lett., 17, 2241–2244, 1990.
Erlandson, R. E., Zanetti, L. J., Potemra, T. A., and Bythrow, P. F., IMF Bydependence of region 1 Birkeland currents near noon, J. Geophys. Res., 93, 9804–9814, 1988.
Fasel, G. J.., Dayside poleward moving auroral forms: A statistical study, J. Geophys. Res., 100, 11891–11905, 1995.
Frank, L. A., Sigwarth, J. B., Craven, J. D., Cravens, J. P., Dolan, J. S., Dvorsky, M. R., Hardebeck, P. K., Harvey, J. D., and Muller, D. W., The Visible Imaging System (VIS) for the Polar Space-craft, Space Sc. Rev., 71, 297–328, 1995.
Germany, G. A., Torr, M. R., Torr, D. G., and Richards, P. G., Use of FUV auroral emissions as diagnostic indicators, J. Geophys. Res., 99, 383–388, 1994.
Glaßmeier, K.-H., Traveling magnetospheric convection twin-vortices: Observations and theory, Ann. Geophysicae, 10, 547– 565, 1992.
Glaßmeier, K.-H., and Heppner, C., Traveling magnetospheric con-vection twin vortices: Another case study, global characteristics, and a model, J. Geophys. Res., 97, 3977–3992, 1992.
Goertz, C. K., Nielsen, E., Korth, A., Glaßmeier, K.-H., Haldoupis, C., Hoeg, P., and Hayward, D., Observations of a possible ground signature of flux transfer events, J. Geophys. Res., 90, 4069– 4078, 1985.
Greenwald, R. A., Baker, K. B., Dudeney, J. R., Pinnock, M., Jones, T. B., Thomas, E. C., Villain, J.-P., Cerisier, J.-C. , Senior, C., Hanuise, C., Hunsucker, R. D., Sofko, G., Koehler, J., Nielsen, E., Pellinen, R., Walker, A. D. M., Sato, N., and Yamagishi, H., DARN/SuperDARN: A global view of the dynamics of high-latitude convection, Space Sci. Rev., 71, 761–796, 1995. Haerendel, G., Paschmann, G., Sckopke, N., Rosenbauer, H., and
Hedgecock, P. C., The frontside boundary layer of the magne-topause and the problem of reconnection, J. Geophys. Res., 83, 3195, 1978.
Iijima, T. and Potemra, T. A., Field-aligned currents in the dayside cusp observed by Triad, J. Geophys. Res., 81, 5971–5979, 1976. Kuo, H., Russell, C. T., and Lee, G., Statistical studies of flux
trans-fer events, J. Geophys. Res., 100, 3513–3519, 1995.
Lockwood, M., The excitation of ionospheric convection, J. Atmos. Terr. Phys., 53, 177–199, 1991.
Lockwood, M., Ionospheric signatures of pulsed magnetopause re-connection, in Physical Signatures of Magnetopause Boundary Layer Processes, NATO ASI Ser. C, vol 425, Eds. J. A. Holtet and A. Egeland, 229–243, Kluwer, Dordrecht, 1994.
Lockwood, M. and Davis, C. J., On the longitudinal extent of mag-netopause reconnection pulses, Annales Geophys., 14, 865–878, 1996.
Lockwood, M. and Wild, M.N., On the quasi-periodic nature of magnetopause flux transfer events, J. Geophys. Res., 98, 5935– 5940, 1993.
Lockwood, M., Carlson Jr., H. C., and Sandholt, P.E., Implications of the altitude of transient 630-nm dayside auroral emissions, J. Geophys. Res., 98, 15 571–15 587, 1993a.
Lockwood, M., Denig, W. F., Farmer, A. D., Davda, V. N., Cow-ley, S. W. H., and Lühr, H., Ionospheric signatures of pulsed re-connection at the Earth’s magnetopause, Nature, 361, 424–428, 1993b.
Lockwood, M., Moen, J., Cowley, S. W. H., Farmer, A. D., Løvhaug, U. P., Lühr, H., and Davda, V. N., Variability of day-side convection and motions of the cusp/cleft aurora, Geophys. Res. Lett., 20, 1011–1014, 1993c.
McWilliams, K. A., A SuperDARN Study of Dayside Field-Aligned Current Regions, M.Sc. Thesis, University of Saskatchewan, Canada, 1997.
McWilliams, K. A., Yeoman, T. K., and Provan, G., A statistical survey of dayside pulsed ionospheric flows as seen by the CUT-LASS Finland HF radar, Ann. Geophysicae, 18, 445–453, 2000a. McWilliams, K. A., Yeoman, T. K., and Cowley, S. W. H., Two-dimensional electric field measurements in the ionospheric foot-print of a flux transfer event, Ann. Geophysicae, 1584–1598, 2000b.
Milan, S. E., Yeoman, T. K., Lester, M., Thomas, E. C., and Jones, T. B., Initial backscatter occurrence statistics from the CUT-LASS HF radars, Ann. Geophysicae, 15, 703–718, 1997. Milan, S. E., Yeoman, T. K., and Lester, M., The dayside auroral
zone as a hard target for coherent HF radars, Geophys. Res. Lett., 25, 3717–3720, 1998.
Milan, S. E., Lester, M., Cowley, S. W. H., and Brittnacher, M., Convection and auroral response to a southward turning of the IMF: Polar UVI, CUTLASS and IMAGE signatures of transient magnetic flux transfer at the magnetopause, J. Geophys. Res., 105, 15 741–15 756, 2000.
Moen, J., Sandholt, P. E., Lockwood, M., Denig, W. F., Løvhaug, U. P., Lybekk, B., Egeland, A., Opsvik, D., and Friis-Christensen, E., Events of enhanced convection and related dayside auroral activity, J. Geophys. Res., 100, 23 917–23 934, 1995.
Neudegg, D. A., Yeoman, T. K., Cowley, S. W. H., Provan, G., Haerendel, G., Baumjohann, W., Auster, U., Fornacon, K.-H., Georgescu, E., and Owen, C. J., A flux transfer event observed at the magnetopause by the Equator-S spacecraft and in the iono-sphere by the CUTLASS HF radar, Ann. Geophysicae, 17, 707– 711, 1999.
Neudegg, D. A., Cowley, S. W. H., McWilliams, K. A., Lester, M., Yeoman, T. K., Sigwarth, J., Haerendel, G., Baumjohann, W., Auster, U., Fornacon, K.-H., and Georgescu, E., The UV aurora and ionospheric flows during flux transfer events, Ann. Geophys-icae, 19, 179–188, 2001.
Øieroset, M., Lühr, H., Moen, J., Moretto, T., and Sandholt, P. E., Dynamical auroral morphology in relation to ionospheric plasma convection and geomagnetic activity: Signatures of mag-netopause X line dynamics and flux transfer events, J. Geophys. Res, 101, 13 275–13 292, 1996.
Pinnock, M., Rodger, A. S., Dudeney, J. R., Greenwald, R. A.,
Baker, K. B., and Ruohoniemi, J. M., An ionospheric signature of possible enhanced field merging on the dayside magnetopause, J. Atmos. Terr. Phys., 53, 201–212, 1991.
Pinnock, M., Rodger, A. S., Dudeney, J. R., Baker, K. B., Green-wald, R. A., and Greenspan, M., Observations of an enhanced convection channel in the cusp ionosphere, J. Geophys. Res., 98, 3767–3776, 1993.
Ruohoniemi, J. M., Baker, K. B., Large-scale imaging of high-latitude convection with Super Dual Auroral Radar Network HF radar observations, J. Geophys. Res., 103, 20 797–20 811, 1998. Russell, C. T. and Elphic, R. C., Initial ISEE magnetometer results: magnetopause observations, Space Sci. Rev., 22, 681–715, 1978. Russell, C. T. and Elphic, R. C., ISEE observations of flux transfer events at the dayside magnetopause, Geophys. Res. Lett., 6, 33– 36, 1979.
Russell, C. T., Neugebauer, M., and Kivelson, M. G., OGO-5 ob-servations of the magnetopause, in Correlated Interplanetary and Magnetospheric Observations, D. Reidel, Dordrecht, pp. 139– 157, 1974.
Sandholt, P. E., Farrugia, C. J., and Lybekk, B., The dynamic cusp aurora on 30 November 1997: Response to southward turning of the IMF, Ann Geophys., 17, 1155–1165, 1999.
Siscoe, G. L. and Huang, T. S., Polar cap inflation and deflation, J. Geophys. Res., 90, 543–547, 1985.
Sofko, G. J., Greenwald, R., and Bristow, W., Direct determination of large-scale magnetospheric field-aligned currents with Super-DARN, Geophys. Res. Lett., 22, 2041–2044, 1995.
Torr, M. R., Torr, D. G., Zukic, M., Johnson, R. B., Ajello, J., Banks, P., Clark, K., Cole, K., Keffer, C., Parks, G., Tsurutani, B., and Spann, J., A far ultraviolet imager for the international solar-terrestrial physics mission, Space Sc. Rev., 71, 329–383, 1995.
Yasuhara, F., Kamide, Y., and Akasofu, S.-I., A modeling of the magnetospheric substorm, Planet. Space Sci., 23, 575–578, 1975.
Yeoman, T. K., Lester, M., Cowley, S. W. H., Milan, S. E., Moen, J., and Sandholt, P. E., Simultaneous observations of the cusp in optical, DMSP and HF radar data, Geophys. Res. Lett., 24, 2251–2254, 1997.