HAL Id: hal-00316854
https://hal.archives-ouvertes.fr/hal-00316854
Submitted on 1 Jan 2001
HAL is a multi-disciplinary open access
archive for the deposit and dissemination of
sci-entific research documents, whether they are
pub-lished or not. The documents may come from
teaching and research institutions in France or
abroad, or from public or private research centers.
L’archive ouverte pluridisciplinaire HAL, est
destinée au dépôt et à la diffusion de documents
scientifiques de niveau recherche, publiés ou non,
émanant des établissements d’enseignement et de
recherche français ou étrangers, des laboratoires
publics ou privés.
The MEDUSA electron and ion spectrometer and the
PIA ultraviolet photometers on Astrid-2
O. Norberg, J. D. Winningham, H. Lauche, W. Keith, W. Puccio, J. Olsen, K.
Lundin, J. Scherrer
To cite this version:
O. Norberg, J. D. Winningham, H. Lauche, W. Keith, W. Puccio, et al.. The MEDUSA electron and
ion spectrometer and the PIA ultraviolet photometers on Astrid-2. Annales Geophysicae, European
Geosciences Union, 2001, 19 (6), pp.593-600. �hal-00316854�
Geophysicae
The MEDUSA electron and ion spectrometer and the PIA
ultraviolet photometers on Astrid-2
O. Norberg1, J. D. Winningham2, H. Lauche3, W. Keith2, W. Puccio1, J. Olsen1, K. Lundin1, and J. Scherrer2
1Swedish Institute of Space Physics, Box 812, SE-981 28 Kiruna, Sweden
2Southwest Research Institute, P. O. Drawer 28510, San Antonio, Texas 78228-0510, USA 3Max-Plank-Institut fr Aeronomie, Postfach 20, D-37189 Katlenburg-Lindau, Germany
Received: 3 July 2000 – Revised: 16 March 2001 – Accepted: 23 March 2001
Abstract. The miniature electron and ion spectrometer MEDUSA on Astrid-2 consists of two “top-hat”-type spheri-cal electrostatic analyzers, sharing a common top-hat. Fast energy sweeps (16 electron sweeps and 8 ion sweeps per second) allow for very high temporal resolution measure-ments of a two-dimensional slice of the particle distribution function. The energy range covered, is in the case of elec-trons, 4 eV to 22 keV and, in the case of ions, 2 eV to 12 keV. MEDUSA is mounted with its aperture close to the spin plane of Astrid-2, which allows for good pitch-angle cov-erage when the local magnetic field is in the satellite spin plane. The PIA-1/2 spin-scanning ultraviolet photometers measure auroral emissions. Using the spacecraft spin and or-bital motion, it is possible to create two-dimensional images from the data. Spin-scanning photometers, such as PIA, are low-cost, low mass alternatives to auroral imagers, but place constraints on the satellite attitude. Data from MEDUSA are used to study processes in the auroral region, in particular, electrodynamics of aurora and “black aurora”. MEDUSA is also a technological development, paving the way for highly capable, miniaturized particle spectrometers.
Key words. Ionosphere (instruments and techniques) –
Magnetospheric physics (auroral phenomena; instruments and techniques)
1 Introduction
The Swedish microsatellite Astrid-2 was launched by a Rus-sian Kosmos-3M launch vehicle on 10 December 1998 into a 1000 km circular orbit with 83◦inclination (Marklund et al., 2001) The satellite and the major part of the instrumen-tation performed well until the end of the mission on 24 July 1999. Both the scientific objectives concerning auroral pro-cesses and the technological objectives involved in proving the usefulness of a microsatellite as an auroral research plat-form were fulfilled.
Correspondence to: O. Norberg (olle.norberg@irf.se)
The MEDUSA and PIA instruments discussed in this pa-per are part of the payload on Astrid-2, which also consists of the electric and magnetic field instrument EMMA, the Lang-muir probes LINDA, and the attitude star imager ASC. The Miniaturized Electrostatic DUal-top-hat Spherical Analyzer (MEDUSA) instrument was designed and built by the South-west Research Institute (SwRI) in San Antonio, Texas, in co-operation with the Swedish Institute of Space Physics (IRF). The Photometers for Imaging of the Aurora (PIA) were de-signed and built by the Max-Planck-Institut f¨ur Aeronomie, Lindau, Germany, in cooperation with IRF.
2 Scientific objectives
The dual objectives of the Astrid-2 mission are to study vari-ous physical processes associated with aurora, and to demon-strate several new technologies which are employed for the first time. Among the scientific topics addressed are the elec-trodynamics of aurora and black aurora, a follow-up on a dis-covery made by the Swedish Freja spacecraft (Marklund et al., 1997). Many other field-particle phenomena are also in-vestigated, such as the physics of transverse ion heating, and sources of the cross-polar potential drop. In addition, elec-tric and magnetic field mapping and structure studies will be conducted, along with investigations of electrostatic and electromagnetic fields and wave-particle interactions.
The technologies demonstrated will show that a low-bud-get, small-platform satellite system can carry a comprehen-sive set of scientific instruments for auroral research. The MEDUSA and PIA instruments are miniaturized instruments based on proven instrument designs. Thus, there is heritage in the solutions employed, as well as up-to-date implementa-tions of the sensor and electronics design.
3 MEDUSA instrument description
The instrument consists of a cylindrical sensor unit built by SwRI, and a box-shaped data processing unit (DPU) built by
594 O. Norberg et al.: The MEDUSA electron and ion spectrometer and the PIA ultraviolet photometers on Astrid-2
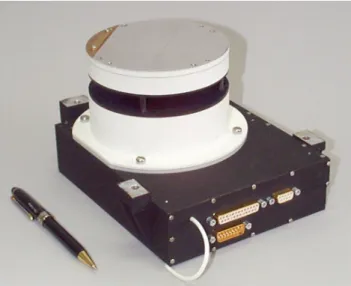
Fig. 1. The MEDUSA electron and ion spectrometer.
IRF. In addition, IRF supplied the amplifier boards and high-voltage boards for the sensor unit. The sensor is mounted on top of the DPU (see Fig. 1), which is attached to the top plat-form of Astrid-2 (see Fig. 2a,b). In order to achieve an almost unobstructed field-of-view for MEDUSA, each of the four mounting feet of the DPU has an individual stand-off height to the spacecraft platform. This allows for a 3◦tilt of the in-strument, such that the sectors looking across the diagonal of the top platform (sectors 0 and 15) are at the highest point. When the attitude of Astrid-2 is such that the local magnetic field vector is in the satellite spin plane (“cartwheel mode”), MEDUSA has a very good coverage of all pitch angles. Cov-erage of field-aligned particles is, however, reduced as the angle between the B-field and the spin plane increases. Due to the mounting on the anti-sunward side of the spacecraft (with the apertures at 90◦ angle to the sunward direction), MEDUSA is not particularly affected by solar UV-light. No particular UV-rejection method was implemented other than cupper blackening of the electrostatic deflection plates.
MEDUSA allows for simultaneous measurements of both electrons and ions (without mass resolution). Particles are measured with an angular resolution of 22.5◦in the aperture
plane (which is tilted 3◦ to the spacecraft spin plane),
us-ing 16 anodes or “sectors”. For electrons, 16 energy sweeps per second are performed, and for ions, 8 sweeps per sec-ond. Each energy sweep consists of 32 discrete energy steps with descending logarithmic level. Of the 32 steps, one step is used for resetting the deflection voltage to its maximum value.
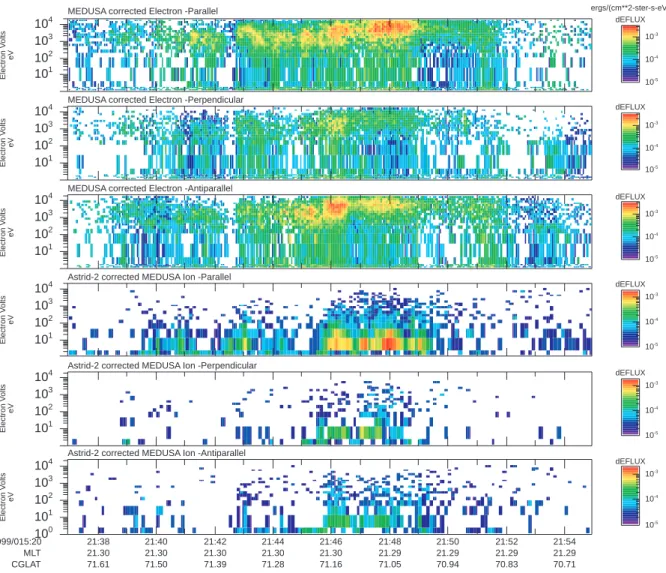
MEDUSA was switched on for the first time on 21 Decem-ber 1998. It was almost always continuously switched on between January 1999, until the end of the mission in July 1999. The instrument worked flawlessly during this time, and has produced a large data set to be analyzed. Figure 3 is an example plot of MEDUSA data, showing time-energy spectrograms of the most parallel, perpendicular, and most
MEDUSA aperture directions for each sector
to the Sun Satellite spin direction
The PIA photometers View direction for PIA-1
View direction for PIA-2
PIA-2 PIA-1
MEDUSA aperture plane
0 7 3 1 2 4 5 68 9 10 11 12 13 14 15 Solar arrays Antisunward facing platform MEDUSA Ion spectrometer Electron spectrometer Solar arrays
Fig. 2a. The view directions of the MEDUSA and PIA instruments.
Fig. 2b. MEDUSA mounted on the top, antisunward facing plat-form of Astrid-2. The aperture is covered by a remove-before-flight band with a nitrogen purge port. A square S-band patch antenna is mounted on top of MEDUSA. The stand for the S-band antenna, located in the opposite corner of the top platform, reflects light dur-ing some circumstances into electron sector 15. MEDUSA is tilted 3◦, with the highest point looking across the top platform diagonal. Also seen here is the magnetometer and ASC-boom in its stowed position, and the PIA-1/2 assembly on one of the sides of the satel-lite (right).
antiparallel sectors for electrons and ions. In this particular case the parallel, perpendicular, and antiparallel directions are measured at pitch angles 17◦, 90◦, and 163◦, respec-tively. The data has been corrected for variations in sector efficiency, and the color scales represent differential energy flux. The energy steps were logarithmically spaced for the majority of the mission. However, in the data taken during January 1999, the lowest energy steps were not logarithmic at low energies, i.e. the reason for the coarser low energy res-olution seen in Fig. 3. The ram effect (the spacecraft velocity
MEDUSA corrected Electron -Parallel
10-5
10-4
10-3
dEFLUX
MEDUSA corrected Electron -Perpendicular
10-5
10-4
10-3
dEFLUX
MEDUSA corrected Electron -Antiparallel
10-5
10-4
10-3
dEFLUX
Astrid-2 corrected MEDUSA Ion -Parallel
10-5
10-4
10-3
dEFLUX
Astrid-2 corrected MEDUSA Ion -Perpendicular
10-5
10-4
10-3
dEFLUX
Astrid-2 corrected MEDUSA Ion -Antiparallel
10-5 10-4 10-3 dEFLUX 101 102 103 104 Electron V olts eV 101 102 103 104 Electron V olts eV 101 102 103 104 Electron V olts eV 101 102 103 104 Electron V olts eV 101 102 103 104 Electron V olts eV 1999/015:20 MLT CGLAT 100 101 102 103 104 Electron V olts eV 21:38 21.30 71.61 21:40 21.30 71.50 21:42 21.30 71.39 21:44 21.30 71.28 21:46 21.30 71.16 21:48 21.29 71.05 21:50 21.29 70.94 21:52 21.29 70.83 21:54 21.29 70.71
Fig. 3. MEDUSA time-energy spectrogram. During this event the instrument was operated in the “select mode” in which only the most parallel, perpendicular, and most antiparallel sectors for electrons and ions are included. The data has been corrected for variations in sector efficiency, and the color scales represent differential energy flux. This interesting event shows a beam of upward accelerated electrons (third panel from the top), at 20:21:46 UT on 15 January 1999. The electron beam has been accelerated to an average energy of 5 keV.
of approx. 7 km/s relative to the cold plasma) is frequently seen in the Astrid-2 data, but this effect varies with the space-craft (and thus, MEDUSA) attitude in relation to the velocity vector.
The interesting event shown in Fig. 3 is a beam of upward accelerated electrons (third panel from the top) at 20:21:46 UT on 15 January 1999. The electron beam has been acceler-ated to an average energy of 5 keV; it is locacceler-ated at 21:30 MLT in the auroral region at 71◦corrected geomagnetic latitude. The beam is found adjacent to precipitating electrons (upper-most panel), indicative of a region where both downward and upward field-aligned currents are close to each other. Several studies focusing on data from the MEDUSA instrument have been made, such as a statistical survey of plasma domains (Narita, 2000), the cusp signature (Keith et al., 2001), large-scale ion density cavities (Høymork et al., 2001a), and ion clouds in the CPS-region (Høymork et al., 2001b).
3.1 The sensor unit
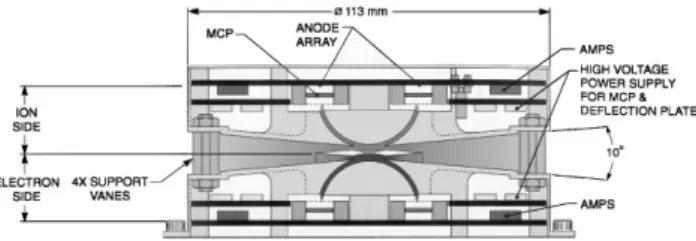
A cross sectional view of the MEDUSA sensor is shown in Fig. 4. The back-to-back geometry achieved by stack-ing the two top-hat electrostatic analyzers (sharstack-ing a com-mon top-hat) allows MEDUSA to analyze both ions and elec-trons with a single entrance aperture. The MEDUSA sen-sor has cylindrical symmetry about the vertical axis passing through its center. The sensor unit also contains, apart from the electrostatic analyzer, amplifier and high-voltage power supply boards. Further discussions on top-hat analyzers can be found in the literature (e.g. Carlson et al., 1983; Young, 1998).
Particles entering the sensor aperture are deflected by the electric field inside the two spherical top-hat analyzers. Only particles of the right polarity, with an energy per charge within the analyzers passband will pass through the electron and ion analyzers and create an impact on the front side of
596 O. Norberg et al.: The MEDUSA electron and ion spectrometer and the PIA ultraviolet photometers on Astrid-2
Fig. 4. Cross section through the MEDUSA sensor. The electron-and ion sides are identical apart from the high voltage polarities and the inclusion of high voltage capacitors between the anodes and amplifiers on the electron side.
a stack of microchannel plates (MCPs, two plates are used in each stack). For each incident particle, the MCPs produce electron showers on their backside (approx. 106electrons in each shower), which are detected on 16 discrete anodes that define the azimuthal acceptance angles.
Each anode is connected to the input charge sensitive am-plifiers. The amplifiers used are the Monolithic Octal Charge Amplifier and Discriminator (MOCAD) chips, each provid-ing 8 amplifier channels. Two MOCAD chips are mounted on each of the two anode boards of the sensor. On the elec-tron side, the anodes are connected to the amplifier inputs via high-voltage capacitors, since the electron anode needs to be at almost the same high-voltage as the backside of the MCP. From each of the two sides of the sensor, low voltage wires connect to the MEDUSA data processing unit. These wires carry 16 signals from the amplifier discriminators, power to the amplifier and high-voltage boards, and control signals to the high-voltage board.
MEDUSA was simulated in a 2.5-dimensional ray-tracing code at SwRI (Keith, 1999). The completed flight instrument was calibrated using the electron and ion source at the cali-bration facility at IRF in Kiruna (Keith, 1999). A variation in efficiency between the 16 sectors of both the electron and ion sides of MEDUSA was found, this variation is compensated for in plots, such as Fig. 3. The instrument characteristics are given in Table 1.
3.2 The electronics and data processing unit
The MEDUSA Data Processing Unit (DPU) serves as the electrical interface between the spacecraft systems and both the MEDUSA and PIA sensors. The DPU has a power inter-face between the spacecraft, with an unregulated input volt-age of +28 V that is transformed to regulated voltvolt-ages inside the DPU. The DPU communicates telemetry, commands, time data, and synchronization signals over a serial interface; the Astrid payload units take turns sending their data over this in-terface. Thus, all other instrument data as well as the space-craft housekeeping data can be read by the MEDUSA DPU. This is used for the pitch angle calculation in select mode; the Astrid-2 spacecraft magnetometer data is read once ev-ery 0.25 seconds by the MEDUSA DPU.
The DPU is built around a Texas Instruments TMS320C50
Fig. 5. The PIA photometers with PIA-3 at the top, and the PIA-1/2 assembly below.
Digital Signal Processor. It has a 2 Mbyte memory that is used as a data compression buffer and for data storage out-side ground station visibility. The flight software is stored both in EPROM (not programmable in flight) and in EEP-ROM (programmable in flight). It is, therefore, possible to reprogram the flight software as well as the lookup tables for the energy sweeps; this option was indeed used in flight. By default, the flight software boots from EEPROM, but by a command decoded by hardware, it is possible to force the CPU to boot from EPROM in case of a corrupt program in EEPROM. The correct function of the CPU is monitored by a watchdog which resets the CPU should it not perform its rou-tine tasks. A special task is also running in the software that computes a checksum of the running flight software code. During the 7 months of operation, the CPU rebooted only a few times.
The registers for both MEDUSA and PIA are implemented in Field Programmable Gate Arrays (FPGAs) from Actel. The registers are 8-bit wide (except for PIA-3, which is 16-bit wide), with a special feature. This means that when the most significant bit is set, the register switches its input from the amplifier discriminator to a fixed frequency. By doing so, and assuming that the amplifier counts would have continued to come in during the remainder of the sample time at the same rate they had before the last bit was set, it is possible to make the register perform data compression in hardware. If R0 de-notes the actual number of pulses counted and R dede-notes the corresponding register reading, the relation between R0 and
Ris as follows:
R0=R
if R < 128, i.e. the most significant bit is not set
R0=128Tcfc/(Tcfc−(R −128))
if R ≥ 128, i.e. the most significant bit is set
Tcis the sample time in seconds and fcis the frequency of the
fixed-rate pulse generator. In this application, Tc·fc =152.6
(1.953 ms · 78.12 kHz for electrons and 3.906 ms · 39.06 kHz for ions and PIA-1/2).
In other words, when there are at least 128 counts during a sample, the function of the register is changed to measure
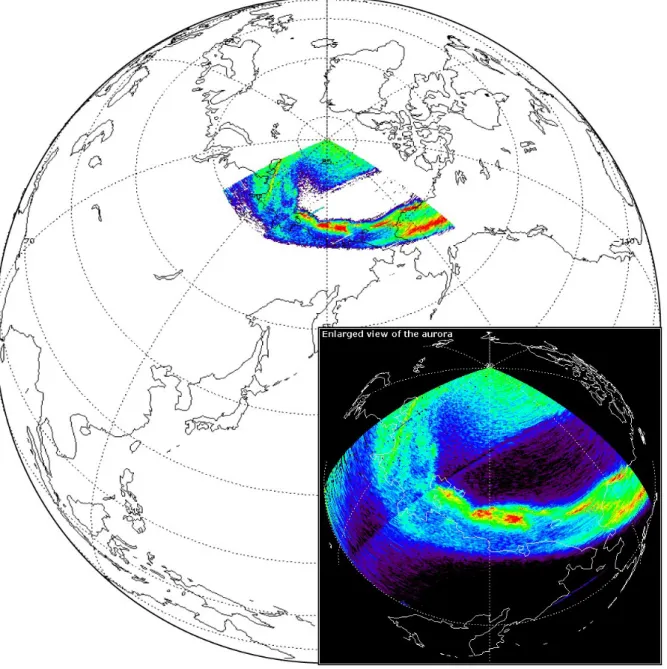
Fig. 6. Auroral emissions over eastern Siberia and Alaska. This image was made using data from PIA-2, channel A, during the time period 12:40–12:55 UT on 18 December 1998. Also shown is an enlarged version of the same event. The satellite moved from west to east. The change in background intensity, seen as a line across the image, is due to the satellite entering eclipse, where the background noise is considerably lower.
Table 1. MEDUSA instrument characteristics
Mass 1.5 kg (0.6 kg sensor and 0.9 kg DPU)
Power 2.9 W
Electron side Ion side
Energy range 4 eV – 22 keV 2 eV – 12 keV
Geometric factor incl. efficiency 1.9·10−4cm2sr 4.2·10−4cm2sr
Energy resolution, 1E/E 15% 25%
Number of sectors 16 16
Number of energy steps 31 + one sweep reset step 31 + one sweep reset step
598 O. Norberg et al.: The MEDUSA electron and ion spectrometer and the PIA ultraviolet photometers on Astrid-2
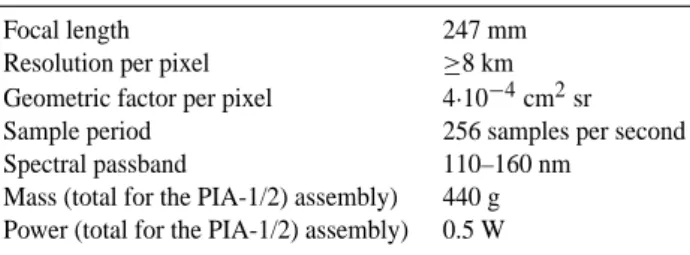
Table 2. PIA-1/2 instrument characteristics
Focal length 247 mm
Resolution per pixel ≥8 km Geometric factor per pixel 4·10−4cm2sr Sample period 256 samples per second
Spectral passband 110–160 nm
Mass (total for the PIA-1/2) assembly) 440 g Power (total for the PIA-1/2) assembly) 0.5 W
the time it took to obtain the first 128 counts. Using this technique, previously used, for example, on the ESRO-1A/B satellites in 1968 and 1969, the MEDUSA and PIA 8-bit reg-isters can register up to 763 counts instead of 255, before overflowing.
3.3 Operational modes
MEDUSA has two modes of operation: either data from all 16 sectors from both the electron and ion sides (“Nor-mal Mode”), or three pitch-angle-selected sectors (“Select Mode”) were included in the telemetry. The temporal res-olution of the instrument is always the same, sixteen 32-step sweeps per second for electrons, eight 32-step sweeps per second for ions, and 256 samples per second for PIA. The Select Mode uses the spacecraft attitude magnetometer data to calculate spin rate and spin phase relative to the local mag-netic field vector. Four times per second these parameters are updated and the sector most parallel, most antiparallel, and most perpendicular to the local magnetic field are selected. For both electrons and ions, these three sectors are then in-cluded in the telemetry. Thus, the output data rate in Select Mode from MEDUSA decreases to about 20% of the data rate required in Normal Mode. The Select Mode is used ex-tensively, since it allows for more than 5 times longer periods of data collection, while retaining much of the information of the distribution function. Normal Mode is primarily used within the auroral ovals.
All 32 MEDUSA sectors (16 electron and 16 ion sectors), as well as the 10 PIA channels can be individually masked out of the telemetry. This allows for the exclusion of data that is not required (such as the PIA-3 data when it produced no counts), thus saving valuable telemetry capacity.
4 PIA instrument description
The PIA (Photometers for Imaging of the Aurora) instru-ment consists of three photometers, 1, 2, and PIA-3. Both PIA-1/2 and PIA-3 are connected to the MEDUSA DPU, where a 3 kV common high-voltage power supply for the photometers, as well as their registers, are located. PIA-1 and PIA-2 are two identical, four-pixel photometers for the ultraviolet passband 110–160 nm. They are mounted in the satellite spin plane such that each photometer’s field-of-view encompasses a certain area of the Earth due to spacecraft
spin; the satellite motion provides the second component of motion to make it possible to reconstruct a two-dimensional picture of the covered area. It should be noted that such pic-tures are not instantaneous; they are sampled pixel-by-pixel, line-by-line as the satellite moves over the area of interest. The two photometers point in opposite directions, thus in-creasing the time spent looking down on the auroral emis-sions with a factor of two. The PIA-1/2 instrument charac-teristics are given in Table 2.
Each of the PIA-1/2 photometers consists of an evacu-ated stainless steel tube, a MgF2lens, a hydrogen getter, and
four stacked ceramic electron multipliers with KBr photo-cathodes. The four multipliers are mounted such that they have the same phase of satellite spin rotation, their field-of-view are, however, different in the plane perpendicular to the spin plane. PIA-1/2 is based on the design of the MIO-2 pho-tometer on Astrid-1 (Norberg et al., 1995). The phopho-tometers were calibrated before launch using a deuterium UV-lamp and a reference UV photodiode from Ball Aerospace that had been calibrated at the National Institute of Standards and Technology. PIA-1/2 was switched on for the first time on 18 December 1998, and produced a good image of the aurora over eastern Siberia and Alaska (see Fig. 6). However, the initial high gain of the photometers decreased rapidly after-wards. The photometers did not achieve the gain seen during the first orbit, even though the multiplier bias voltage even-tually was increased from the nominal value of 2.5 kV to 3.0 kV. The gain decreased with approximately two orders of magnitude.
The spacecraft spin (around a 7 seconds spin period) meant that PIA sampled approximately 1800 pixels per spin. Dur-ing optimal conditions, about 1/3 of the pixels are viewDur-ing emissions from the Earth, with the rest of the pixels looking out into space. Lyman alpha emissions from the Earth’s geo-corona, as well as UV-stars, can be seen in the despun data from non-Earth viewing pixels. Nodal plane drift meant that the local time of the orbit plane changed with approximately 3.5 hours per month. Noon-midnight (or midnight-noon) or-bits are the most favorable for spin-scanning photometers, since the spacecraft spin plane and the satellite velocity vec-tor are perpendicular. Such orbits occurred around Decem-ber 1998 – January 1999, April 1999, and during the end of the mission, July 1999. During dawn-dusk (or dusk-dawn) orbits, a spin-scanning photometer, such as PIA, scans a lim-ited area. Such orbits can, instead of good area coverage, provide high temporal resolution of discrete structures in the aurora.
The reduced gain after the initial operation of the pho-tometer on 18 December 1998 resulted in an inability to mea-sure auroral emissions. A probable reason for the gain reduc-tion is that one hydrogen getter per tube was not sufficient to keep a good vacuum (< 10−6mbar) inside the photome-ter tubes. The residual gas in the tubes slowly destroyed the photocathode surface when the photometers were operated at high voltage. After the gain reduction, the photometers were still sensitive to high intensity emissions. On the dayside we can see structures, which have been identified as clouds,
Lyman-alpha emissions from the geocorona are also suffi-ciently strong enough to be seen in the data.
PIA-3 is a photometer with a narrow passband around the Lyman-alpha wavelength at 121.6 nm; the passband is achie-ved using a MgF2lens and a filter provided by an enclosed
part of the photometer which is filled with oxygen gas (O2
absorption cell). Its design is similar to the MIO-1 photome-ter on Astrid-1 (Norberg et al., 1995), and the HDAC pho-tometer on Cassini (Lauche and Zarnowiecki, 1992). PIA-3 has a 16-bit register, sampled at 256 samples per second. It is mounted inside the spacecraft on the bottom, sunward fac-ing platform, such that it has a constant field-of-view towards the Sun via a small reflecting sphere. The objective with the PIA-3 photometer was to study absorption of Lyman-alpha radiation in the Earth’s atmosphere, using Sun occultation at sunrise and sunset, as seen from Astrid-2. However, PIA-3 failed to produce any counts during the lifetime of Astrid-2; the reason for this is still unknown.
5 Onboard data reduction
The telemetry allocation for MEDUSA and PIA data on As-trid-2 is 30208 bps. The electron part of MEDUSA produces 16 sectors of 8-bit data, 32 steps per sweep, 16 sweeps per second, for a total of 65536 bps. For the ion part, there are 8 sweeps per second, reducing its production rate to 32768 bps. PIA can produce a total of 10 8-bit channels, 256 times per second, for a total of 20480 bps. In addition, the DPU pro-duces a housekeeping data set of 19 16-bit values, four times per second, for a total of 1216 bps. In total, the raw bitrate production of MEDUSA and PIA is thus, 120000 bps, ex-ceeding the allocation by approximately a factor of four. To overcome this, a loss-less data compression algorithm was implemented. The compression scheme is based on Rice’s adaptive coding algorithm (Rice, 1993). Normally, for parti-cle data, this scheme results in compression in the order of 4 to 5. A 2 Mbyte buffer is used as a FIFO to compensate for varying compression efficiency, as well as to provide storage for data while outside ground station coverage. For test and calibration purposes, there is also a special Astrid-2 teleme-try format that allows MEDUSA and PIA to send all data uncompressed. In this case, no EMMA or LINDA data are included.
6 Ground data handling
Ground processing of the MEDUSA and PIA data takes place at IRF in Kiruna. Data received at the Solna Satellite Sta-tion is available over the internet within 15 minutes after a satellite pass. The availability of new data is broadcast as an e-mail triggers an automatic process on a Unix com-puter. The process first retrieves the data via FTP, extracts the MEDUSA/PIA data from the raw telemetry file, uncom-presses the data, and finally writes the files into an archive
ment Data File Set, or IDFS (Winningham et al.). This for-mat allows for storage of the data, together with instrument and calibration constants, enabling full documentation of the data set. Apart from MEDUSA and PIA data, the EMMA and LINDA data have also been processed into IDFS for-mat. A plot package called SDDAS (Winningham et al.) for the IDFS format has been developed by SwRI. In order to provide access to the Astrid-2 data set for the scientific com-munity, a web interface to SDDAS was developed at IRF; it is available at http://www.irf.se/rpg-bin/astrid/astrid.shtml.
7 Conclusions
MEDUSA has provided a very interesting data set which will be used in conjunction with the EMMA and LINDA in-struments on Astrid-2, as well as ground-based instrumen-tation, to study processes primarily in the auroral region. In particular, the high temporal resolution is very valuable, since it offers a possibility to study features in the particle distributions not previously studied at the 1000 km altitude. MEDUSA has also proved to be an instrument well suited for microsatellite missions due to its low mass and power re-quirements. A second MEDUSA instrument was launched on 21 November 2000 on the 6 kg Munin nanosatellite (Nor-berg, 1999). Apart from MEDUSA, the Munin payload con-sists of a spectrometer for ions and neutrals, and a CCD cam-era.
Spin-scanning UV-photometers, such as PIA, are a low mass, low power, and low cost alternative to UV-imagers for auroral missions requiring images of the aurora below the satellites. In particular, the cost for the system can be kept at a fraction of the cost for a UV-imager. For auroral con-stellation missions, it could, therefore, be conceivable that an UV-imager is accommodated on one spacecraft, and as a backup, spin-scanning photometers are placed on another (or several) spacecraft in the constellation. A drawback with spin-scanning photometers is that they place constraints on the orbit plane geometry in order to produce good images. The design of the photometer is crucial for safe operation. We have learned with PIA on Astrid-2 that it is vital to have an excellent vacuum inside the photometer tubes. In a future application, this could be achieved either with more hydro-gen getters per tube or the possibility of opening the tube to space (using a valve) to better evacuate it.
Acknowledgements. The Astrid-2 project is funded by the Swedish National Space Board and by corresponding agencies in the other participating countries. The Southwest Research Institute received funding from the Office of Naval Research (ONR contract N00014-98-1-0175) for their participation in this project.
Topical Editor G. Chanteur thanks M. Hirahara and A. Fedorov for their help in evaluating this paper.
600 O. Norberg et al.: The MEDUSA electron and ion spectrometer and the PIA ultraviolet photometers on Astrid-2
References
Carlson, C. W., Curtis, D. W., Pashmann, G., and Michael, W., An instrument for rapidly measuring plasma distribution functions with high resolution, Adv. Space Res., 2, 67, 1983.
Høymork, S. H., Lundin, R., Narita, Y., Norberg, O., and Winning-ham, D., Statistical study of large scale density cavities observed by Astrid-2, Ann. Geophysicae, submitted, 2001a.
Høymork, S. H., Yamauchi, M., Ebihara, Y., Narita, Y., Norberg, O., and Winningham, D., Dense ion clouds of 0.1–1 keV ions inside the CPS-region observed by Astrid-2, Ann. Geophysicae, 19, 621–631, 2001b (this issue).
Keith, W. R., Development of an Ion/Electron Plasma Spectrometer, Rice Univ., Texas, 1999.
Keith, W. R., Winningham, J. D., and Norberg, O., A new unique signature of the true cusp, Ann. Geophysicae, 19, 611–619, 2001 (this issue).
Lauche, H. and Zarnowiecki, T., The Lyman-α detector for Cassini mission, Proceedings from the 19th Annual European Meeting on Atmospheric Studies by Optical Methods, IRF Scientific Re-port 209, Swedish Institute of Space Physics, Kiruna, Sweden, 1992.
Marklund, G. T., Karlsson, T., and Clemmons, J., On low-altitude particle acceleration and intense electric fields and their relation-ship to black aurora, J. Geophys. Res., 102, 17509, 1997. Marklund, G. T., Blomberg, L. G., and Persson, S., Astrid-2, an
advanced microsatellite for auroral research, Ann. Geophysicae,
19, 589–592, 2001 (this issue).
Narita, Y., Plasma Domains Observed by Astrid-2, IRF Scientific Report 265, Swedish Institute of Space Physics, Kiruna, Sweden, 2000.
Norberg, O., Barabash, S., Sandahl, I., Lundin, R., Lauche, H., Koskinen, H., C:son Brandt, P., Roelof, E., Andersson, L., Ek-lund, U., Borg, H., Gimholt, J., Lundin, K., Ryn¨o, J., and Olsen, S., The Microsatellite Astrid, Proceedings of the 12th ESA Symp. on European Rocket and Balloon Programmes and Related Research, Lillehammer, Norway, 29 May – 1 June, 1995. Norberg, O., Puccio, W., Olsen, J., Barabash, S., Andersson, L., Winningham, J. D., Jonsson, U., and Eriksson, M., Munin: A Student Nanosatellite for Space Weather Information, Mi-crosatellites as Research Tools, Proceedings of the COSPAR Colloquium on Microsatellites as Research Tools, p. 352–364, Pergamon, 1999.
Rice, R. F., Yeh, P.-S., and Miller, W., Algorithms for High-Speed Universal Noiseless Coding, Proceedings of the AIAA Com-puting in Aerospace 9 Conference, San Diego, CA, Oct 19–21, 1993.
Winningham, J. D. et al., The Instrument Data File Set, web pages http://www.idfs.org/, The Southwest Data Display and Analysis System (SDDAS), web pages http://www.sddas.org/
Young, D. T., Space Plasma Instrumentation and the New Paradigm: Faster, Cheaper, Better, Measurement Techniques in Space Plas-mas: Particles, Geophysical Monograph 102, edited by R. F. Pfaff, J. E. Borovsky, and D. T. Young, AGU, p. 1–16, 1998.