HAL Id: hal-00298886
https://hal.archives-ouvertes.fr/hal-00298886
Submitted on 11 Sep 2007HAL is a multi-disciplinary open access
archive for the deposit and dissemination of sci-entific research documents, whether they are pub-lished or not. The documents may come from teaching and research institutions in France or abroad, or from public or private research centers.
L’archive ouverte pluridisciplinaire HAL, est destinée au dépôt et à la diffusion de documents scientifiques de niveau recherche, publiés ou non, émanant des établissements d’enseignement et de recherche français ou étrangers, des laboratoires publics ou privés.
What affects the nitrogen retention in Tatra Mountains
lakes’ catchments in Poland?
D. Rzycho?, A. Worsztynowicz
To cite this version:
D. Rzycho?, A. Worsztynowicz. What affects the nitrogen retention in Tatra Mountains lakes’ catch-ments in Poland?. Hydrology and Earth System Sciences Discussions, European Geosciences Union, 2007, 4 (5), pp.3113-3144. �hal-00298886�
HESSD
4, 3113–3144, 2007
What affects the nitrogen retention in Tatra Mountains... D. Rzycho ´n and A. Worsztynowicz Title Page Abstract Introduction Conclusions References Tables Figures ◭ ◮ ◭ ◮ Back Close Full Screen / Esc
Printer-friendly Version Interactive Discussion Hydrol. Earth Syst. Sci. Discuss., 4, 3113–3144, 2007
www.hydrol-earth-syst-sci-discuss.net/4/3113/2007/ © Author(s) 2007. This work is licensed
under a Creative Commons License.
Hydrology and Earth System Sciences Discussions
Papers published in Hydrology and Earth System Sciences Discussions are under open-access review for the journal Hydrology and Earth System Sciences
What affects the nitrogen retention in
Tatra Mountains lakes’ catchments in
Poland?
D. Rzycho ´n and A. Worsztynowicz
Institute for Ecology of Industrial Areas, 6 Kossutha str., 40-844 Katowice, Poland
Received: 2 November 2006 – Accepted: 7 March 2007 – Published: 11 September 2007 Correspondence to: D. Rzycho ´n ([email protected])
HESSD
4, 3113–3144, 2007
What affects the nitrogen retention in Tatra Mountains... D. Rzycho ´n and A. Worsztynowicz Title Page Abstract Introduction Conclusions References Tables Figures ◭ ◮ ◭ ◮ Back Close Full Screen / Esc
Printer-friendly Version Interactive Discussion
Abstract
The study of acidification and recovery of two lakes situated in the Polish Tatra Moun-tains, exposed to similar deposition of acidic substances but differing in altitude, catch-ment morphology, hydrology, and biodiversity is presented. Measurecatch-ments were per-formed in 1992–1996 and 2001–2005. Simultaneously, research on the atmospheric 5
deposition was carried out. The following physical and chemical parameters in lake water and precipitation were measured: pH, conductivity (K25), Ca2+, Mg2+, Na+, K+, NH+4, SO2−4 , NO−3, Cl− and alkalinity. Distinct changes in the chemical composition of precipitation were observed over 14 years (1992–2005). During this time the sulphate concentration decreased significantly, and the concentration of hydrogen ions in pre-10
cipitation decreased at an average rate of 2.23 meq/m3/yr. There was no significant change in nitrate, ammonium or total nitrogen deposition. The chemical composition of water of both lakes changed significantly and showed signs of chemical recovery with decreases in sulphate concentration and increases in acid neutralising capacity. The concentration of base cations declined. Despite the lack of clear trends in nitro-15
gen deposition, a statistically significant drop in concentration was observed in the two lakes. A significant increase of about 15% in the retention of nitrogen compounds in both catchments occurred. An improvement in nitrogen saturation status in both catch-ments was observed. This probably resulted mainly from decreasing acidification and global warming which prolongs the vegetative period, changes plant species composi-20
tion and increases the microbiological activity of soil.
1 Introduction
In the 1980’s the emissions of sulphur (S) and nitrogen (N) compounds in Europe began to decrease. S compounds decreased by 50–85% and N compounds by 0– 30%. The results from the international UNECE monitoring program ICP Waters show 25
widespread improvement in surface water quality in response to decreasing acidic de-3114
HESSD
4, 3113–3144, 2007
What affects the nitrogen retention in Tatra Mountains... D. Rzycho ´n and A. Worsztynowicz Title Page Abstract Introduction Conclusions References Tables Figures ◭ ◮ ◭ ◮ Back Close Full Screen / Esc
Printer-friendly Version Interactive Discussion position in the years 1990–2001. The most significant change was a decrease in
sul-phate (SO2−4 ) concentrations while nitrate (NO−3) concentrations were unchanged in most of regions examined (Skjelkv ˚ale et al., 2005). The extent of recovery from acid-ification in Europe and North America has varied over time, between regions and be-tween sites within regions, depending on the range of factors including the magnitude 5
of deposition change and catchment characteristics (Skjelkv ˚ale et al., 2005).
Relatively fast reversal of changes connected with acidification was documented by Gunn (1995) for waters of the heavily contaminated region of Sudbury, Ontario (Canada) and by Vesel´y et al. (1998) for lakes in the Bohemian Forest (Czech Repub-lic). Nevertheless, many rivers and lakes showed a rather slow increase in pH and acid 10
neutralising capacity (ANC), often because of simultaneous decrease in base cations and strong acid anions (Stoddard et al., 2000).
Variability in the ecosystems’ response to changing acid deposition makes the es-timation of potential recovery difficult. Values and trends of the key soil and water parameters, dependent on deposition of acidifying substances are a result of complex 15
processes occurring in the catchment. Among factors affecting the chemical changes in the catchment’s soil and water are changes in the N transformation cycle, e.g., an increase in N uptake by plants and soil micro-organisms (Vesel´y et al., 2002, 2003). Recently, global climatic changes have been taken into consideration as factors pos-sibly influencing the process of recovery (Dillon et al., 2003). Among factors causing 20
delays in the recovery of acidified surface waters are: (1) significant increase in the frequency of episodes of high deposition of sea salt (Evans and Monteith, 2002); (2) changes in surface water hydrology resulting on the one hand from more frequent dry weather periods and on the other hand increased frequency and intensity of precipita-tion; (3) increase of concentrations of dissolved organic carbon (DOC) in some regions 25
(Davies et al., 2005); and (4) disturbances in natural processes that increase ANC of surface waters, such as SO2−4 reduction, denitrification, ion exchange with bottom sediment and organic acid decomposition. Among phenomena favourable to surface water recovery are: (1) decreases in aluminium (Al) ion concentration because of a
HESSD
4, 3113–3144, 2007
What affects the nitrogen retention in Tatra Mountains... D. Rzycho ´n and A. Worsztynowicz Title Page Abstract Introduction Conclusions References Tables Figures ◭ ◮ ◭ ◮ Back Close Full Screen / Esc
Printer-friendly Version Interactive Discussion decrease in Al compound solubility as a result of temperature increase (Vesel´y et al.,
2003); (2) increased rate of base cation weathering, also connected with the tempera-ture increase; (3) higher than generally expected N retention in many catchments, and (4) episodes of alkaline deposition of particulate matter from the Sahara Desert, which is particularly important in high mountain areas in Europe (Rogora et al., 2003). 5
This paper presents results of a study of acidification in the two Tatra lakes carried out between 1992 and 2005. Within this time significant changes in the emission of S and N compounds to the atmosphere were observed. Reduction of sulphur oxide emissions from the territory of Poland in the period of 1980–2003 is estimated to be about 66%, nitrogen oxide emission reduction of about 34%, and ammonia about 41% 10
(EMEP, 2005). Subsequently, deposition of acidifying substances from the atmosphere decreased. These changes were accompanied by changes in temperature and precip-itation. Results of analysis of lake water provide a good material for the assessment of the impact of these changes on the Tatra lake catchments, with a special focus on changes in the N and S budgets and the N cycle.
15
2 Materials and methods
2.1 Site
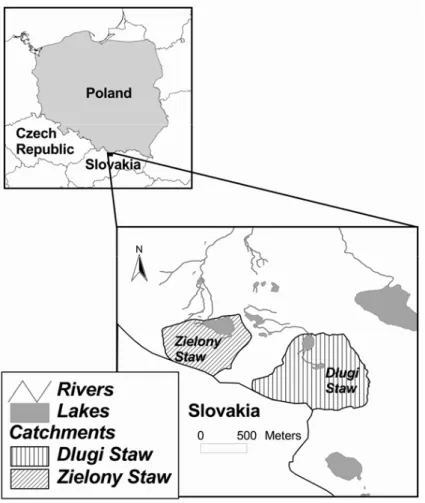
The Tatra Mountains are situated at the border between Poland and Slovakia (Fig. 1). It is a mountain ridge 53 km long and 18 km wide, with the highest summit of 2663 m a.s.l. in Slovakia, and 2499 m a.s.l. in Poland. Within the Karpaty formation, 20
the Tatra Mountains create the highest mountain massif, the characteristic feature of which is a young glacial terrain. Due to very high elevation, low air temperatures and high precipitation are typical of the Tatra Mountains. Another distinctive feature of the region is frequent, strong winds, which transport dusts and pollutants. The study area focussed on the part of the Polish Tatra Mountains with crystalline core where the ionic 25
strength of surface waters is very low, resulting in high sensitivity to acid deposition. 3116
HESSD
4, 3113–3144, 2007
What affects the nitrogen retention in Tatra Mountains... D. Rzycho ´n and A. Worsztynowicz Title Page Abstract Introduction Conclusions References Tables Figures ◭ ◮ ◭ ◮ Back Close Full Screen / Esc
Printer-friendly Version Interactive Discussion The selected lakes, Dlugi Staw and Zielony Staw, are located in the area of Hala
Gsieni-cowa. They differ in morphological and hydrological characteristics (Table 1) as well as in intensity of biological processes occurring in their catchments and water. Zielony Staw is a headwater lake while Dlugi Staw has a small pond upstream (Fig. 1).
The catchments of Dlugi Staw and Zielony Staw are characterised by steep slopes. 5
The major part of the catchment consists of rocks, moraine, stone rubble, talus with lichen the dominant plant. The following factors contribute to the podsolic character of the soil-forming process in the Tatra Mountains (Skiba, 1977): acid carbonate-free matrix (Tatra granitoid), acidophilic vegetation and intensive precipitation. The inten-sity of podsolic processes in the Tatra Mountains is characterized by zonality due to 10
climate and biological differences connected with altitude. In upper locations, like that of the two lakes, mechanical weathering processes and accumulation of organic sub-stances can be observed. Soils occurring in this region include various forms of podso-lic rankers and lithosols, the morphology of which reflects the impact of severe climate. Their thickness does not exceed 15 cm. Only very small parts of the catchments are 15
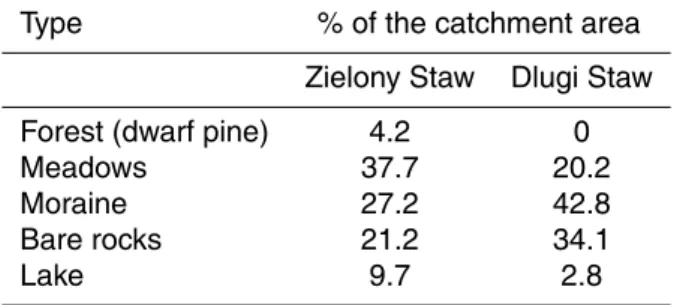
covered with plants. The land use distribution in the catchments was determined using TPN Atlas (Trafas, 1985), photographs and field observations (Table 2).
The study lakes are oligotrophic. Greater fauna biodiversity found in Zielony Staw is probably a result of its slightly higher trophic status (Kownacki et al., 2000). Fish (brook trout) artificially introduced into both lakes in the 1950’s have survived only in Zielony 20
Staw.
2.2 Monitoring Lake water chemistry
The chemical composition of water of both lakes was monitored in two time periods: 1992–1996 and 2001–2005. Samples of lake outflow were collected fortnightly. The 25
following physical and chemical parameters were measured: pH, conductivity (K25), Ca2+, Mg2+, Na+, K+, NH4+, SO2−4 , NO−3, Cl−, alkalinity. Analyses for the period
1992-HESSD
4, 3113–3144, 2007
What affects the nitrogen retention in Tatra Mountains... D. Rzycho ´n and A. Worsztynowicz Title Page Abstract Introduction Conclusions References Tables Figures ◭ ◮ ◭ ◮ Back Close Full Screen / Esc
Printer-friendly Version Interactive Discussion 1996 were performed at the Norwegian Institute for Water Research (NIVA) and for
2001-2005 at the Institute for Ecology of Industrial Areas (IETU). Acid neutralising ca-pacity (ANC) was defined as the equivalent sum of base cations (Ca2+ + Mg2++ Na+ + K+) minus the equivalent sum of strong acid anions (SO2−4 + NO−3 + Cl−).
Deposition data 5
Atmospheric deposition was monitored during the period 1992–2005 with a one-year break in 1998. Data for 1992–1997 came from IETU studies carried out at the Institute of Meteorology and Water Management station located on Hala Gasienicowa where weekly bulk precipitation was collected. Data for 1999–2005 were provided by the Na-tional Deposition Monitoring station initiated in 1999 at Kasprowy Wierch and consisted 10
of monthly bulk precipitation. The stations are located close to each other and to the study lakes. A comparison showed only negligible differences in results between the two stations. In mass balance calculations and statistical analysis deposition data from two time periods: 1992–1996 and 2001–2005 were used.
Climate data 15
Pertinent climate data (daily mean temperature and monthly precipitation) were ob-tained from the Institute of Meteorology and Water Management (IMGW).
Trend analysis
For the trend analysis the Seasonal Kendall Test (SKT), a version of a non-parametric Mann-Kendall test, modified to deal seasonality of the data, was used. The slopes 20
of individual trends were determined using the Sen slope estimator. This method is robust against outliers and missing data, and does not demand a normal distribution of the data (Helsel et al., 1992).
HESSD
4, 3113–3144, 2007
What affects the nitrogen retention in Tatra Mountains... D. Rzycho ´n and A. Worsztynowicz Title Page Abstract Introduction Conclusions References Tables Figures ◭ ◮ ◭ ◮ Back Close Full Screen / Esc
Printer-friendly Version Interactive Discussion
3 Results
Climate
In Poland the increase in temperature since the beginning of the twentieth century has been estimated to be 0.6–0.8◦C/100 years (IMGW, 2005). The decade of the 1990s was the hottest decade of the twentieth century. Trends of climate change in the Polish 5
Tatra Mountains indicate similar relationships as the rest of the country (Nied´zwied´z, 1996; Obre¸bska-Starklowa et al., 1996). Analysis of observed and reconstructed sum-mer temperature in the Tatra Mountains from 1550 to 2004 (Nied´zwied´z, 2005) indi-cates that the last cool period was observed in the years 1960–1990. Warm summer seasons have dominated in the Tatra Mountains since 1991. During the past 14 years 10
(1991–2004) only two summers stand out due to their small negative anomalies in tem-perature: 1993 (dt=–0.8◦C) and 1996 (dt=–0.3◦C). In 1992–2005 in the meteorological station located on Hala Gasienicowa, near the investigated area, the average annual temperature was 2.8◦C, whereas during the first research campaign (1992–1996) the average temperature was 2.7◦C and during the second one (2000–2005), 3.0◦C. 15
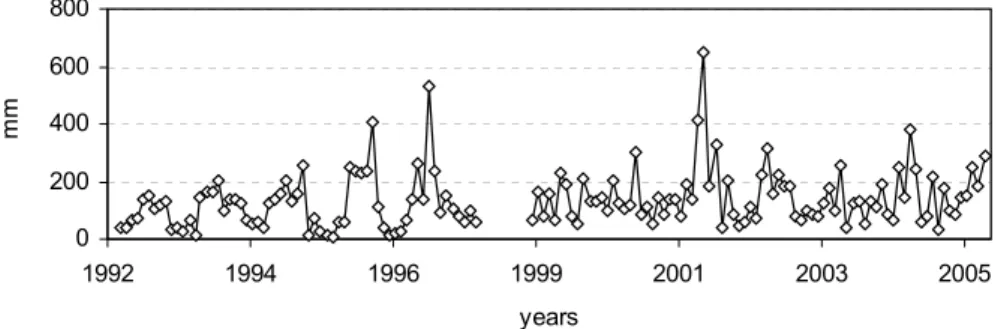
In recent years the precipitation pattern in Poland has changed; monthly means are maintained by 2–3 heavy rainfalls whereas in the remaining period symptoms of drought can be observed. The number of extreme events has also increased (IMGW, 2005). The study area shows great variability in the annual precipitation volumes. Total monthly precipitation in the study area in the years 1992–2005 is illustrated in Fig. 2. 20
In the first measurement period, which was characterised by low precipitation total in comparison to the long-term annual average, lower precipitation level was observed in winter and higher in summer (maximum in June in all measured years). These re-sults are consistent with long-term tendencies for the investigated area. Approximately 68.8% of the precipitation volume came from May to October and 31.2% from Novem-25
ber to April (Szafer et. al., 1962). The period of 2000–2005 showed significantly more variability in precipitation volume connected with seasons of the year.
HESSD
4, 3113–3144, 2007
What affects the nitrogen retention in Tatra Mountains... D. Rzycho ´n and A. Worsztynowicz Title Page Abstract Introduction Conclusions References Tables Figures ◭ ◮ ◭ ◮ Back Close Full Screen / Esc
Printer-friendly Version Interactive Discussion Deposition
The deposition of S and N compounds in the study area was similar to that in many other regions experiencing acidification of freshwaters. During the research period av-erage annual concentration of SO2−4 ranged from 34.2 meq/m3(2002) to 75.9 meq/m3 (1993); concentrations of NO−3 from 17.9 meq/m3 (2002) to 31.8 meq/m3 (1993) and 5
concentrations of NH+4 from 17.3 meq/m3(1997) to 37.4 meq/m3 (2003). At the same time the precipitation pH varied from 4.39 in 1996 to 5.16 in 2002.
Within the 14-year period distinct changes were observed in the chemical composi-tion of precipitacomposi-tion. The SO42−concentration decreased markedly. The concentration of hydrogen ions decreased with an average rate of 2.23 meq/m3/yr during the entire 10
period, with a slight increase in 1992–1996 and a slight decrease in 2001–2005. Less pronounced were changes in concentrations of nitrogen compounds (Table 3).
Changes in the seasonal precipitation pattern resulted in similar changes in deposi-tion pattern. In 2001–2005 rainfalls and snowfalls were distributed less regularly in win-ter and summer months than in previous years (Fig. 3). There was a distinct increase 15
in N/(N+S) ratio in the deposition and smaller increase in proportion of ammonium in total N deposition (Fig. 4).
Lake water chemistry
The annual weighted mean concentrations of major chemical compounds in outflow water from the lakes are presented on Fig. 5. Concentrations of base cations and 20
ANC were higher in discharge from Zielony Staw than from Dlugi Staw. The SO2−4 concentrations are similar, reflecting similar deposition of S, while NO−3 concentration is significantly higher in the runoff from Dlugi Staw. Since Zielony Staw is located about 112 m lower in altitude than Dlugi Staw, the spring melt season often starts earlier at Zielony Staw. Thus Dlugi Staw often shows higher NO−3 concentration, lower ANC and 25
pH earlier at spring in comparison to Zielony Staw (Fig. 5). 3120
HESSD
4, 3113–3144, 2007
What affects the nitrogen retention in Tatra Mountains... D. Rzycho ´n and A. Worsztynowicz Title Page Abstract Introduction Conclusions References Tables Figures ◭ ◮ ◭ ◮ Back Close Full Screen / Esc
Printer-friendly Version Interactive Discussion In addition to altitude differences, the Dlugi Staw catchment has less vegetation cover
and steeper slopes. This results in shorter contact time of water within the Dlugi Staw catchment. Shorter residence time of water within the catchment means less time for physio-chemical water-soil interactions and is reflected in by lower base cation con-centrations and lower ANC. Another factor is geological differences. Both catchments 5
contain granitoids covered by moraine, but soils of the Zielony Staw catchment have on average higher base saturation (Rzycho ´n, 1998), which is probably caused by some intrusions of limestone located at the catchment border (Trafas, 1985). From a bio-logical point of view, the shorter residence time of water within the catchment means less time or reduced possibility for nutrients such as N to be assimilated by plants and 10
micro-organisms. Sparse vegetation cover will further amplify this effect. These are likely major factors in the generally higher leakage of NO−3 by runoff from Dlugi Staw in comparison to Zielony Staw.
The chemical composition of surface waters can be depicted as a mixing of distinct types of water (melt-water, rainwater and groundwater) in various proportions. Their 15
proportions change depending on meteorological conditions and the course of bio-logical and chemical processes in the catchment and water regions. As illustrated in Figure 6 the seasonal variability of chemical parameters of surface waters is related to seasonal variability in meteorological conditions in the catchments each year. There-fore, seasonal periods can be distinguished when water of similar origin and chemical 20
composition flow from the catchment to the surface waters (Rzycho ´n, 1998).
A comparison of the chemical composition of waters in the investigated lakes in the two monitoring periods indicated that in the period of 2000–2005 the differences in concentrations of some chemical parameters between the lakes was reduced, and there was greater irregularity in seasonal changes than in 1992–1996 (Fig. 6).
25
Concentrations of base cations, SO2−4 and NO−3, ions that play key roles in the acidi-fication process decreased between 1992 and 2005 while ANC increased (Table 4). A more rapid decrease of base cations and SO2−4 was observed in the water of Zielony Staw, while a more rapid increase in ANC and decrease in NO−3 concentration was
HESSD
4, 3113–3144, 2007
What affects the nitrogen retention in Tatra Mountains... D. Rzycho ´n and A. Worsztynowicz Title Page Abstract Introduction Conclusions References Tables Figures ◭ ◮ ◭ ◮ Back Close Full Screen / Esc
Printer-friendly Version Interactive Discussion recorded in Dlugi Staw.
Hydrogen ion concentrations decreased in Dlugi Staw but increased in Zielony Staw. The rates of change are very low, however, indicating only slight changes in the acidi-fication of both lakes.
Mass balances of inputs and outputs for major ions were calculated for both catch-5
ments and measurement periods (Tables 5 and 6). Dry deposition was assumed to be 20% of wet deposition (Lydersen et al., 1997; Rzycho ´n, 1998). The runoff coefficient (runoff/precipitation) for both lakes was assumed to be 0.86 (Łajczak, 1988). The com-parison of the mass balances for the measurement period 2001–2005 with those from 1992–1996 showed an increase of approximately 15% in N retention in both catch-10
ments: in 2001–2005 about 70% and 44% of N was retained by the catchments of Zielony and Dlugi Staw, respectively, in comparison to 55% and 28% in 1992–1996.
The retention of S changed only slightly; it decreased by 4% in Zielony Staw and by 8% in Dlugi Staw (Tables 5 and 6). The results show higher retention of both S and N in Zielony Staw as compared to Dlugi Staw. Nitrate concentrations in both lake outflows 15
declined between 1994 and 2004.
Interpretation of these mass balance calculations in the study catchments requires caution due to the large variability in meteorological conditions. In order to reduce po-tential inaccuracy a mass balance made for two years of similar hydrological regime was taken for comparison, i.e. 1996 (precipitation total -1673 mm) and 2002 (precipi-20
tation total –1712 mm). The observed tendencies were similar to those obtained while comparing averages from two testing periods, i.e. decrease of sulphur retention and increase of nitrogen retention by both catchments (Table 6)
4 Discussion
Polish and European data (EMEP, 2005) indicate a reduction in S and N emissions be-25
tween 1992 and 2005. Monitoring of the deposition in Polish Tatra Mountains showed a distinct decrease in S deposition but no significant change in N deposition (Table 5).
HESSD
4, 3113–3144, 2007
What affects the nitrogen retention in Tatra Mountains... D. Rzycho ´n and A. Worsztynowicz Title Page Abstract Introduction Conclusions References Tables Figures ◭ ◮ ◭ ◮ Back Close Full Screen / Esc
Printer-friendly Version Interactive Discussion At the same time visible changes in the chemistry of lake outflows were observed.
Concentration of SO2−4 decreased (Fig. 6), following the drop of concentration in pre-cipitation. Sulphate mass balances show diminishing S retention in both catchments, which may be due to export of stored S compounds accumulated in soil when the deposition was higher. In some cases, release of stored S can result in a delay in 5
decrease of SO2−4 in surface water despite distinct reductions in S deposition, as was seen in Virginia, USA (Skjelkv ˚ale, 2005). The granite bedrock in the research area con-tains only small amounts of S in the form of very insoluble BaSO4(Oleksynowa, 1970) and, therefore, it is unlikely that warmer temperatures will cause significant increase in sulphate concentration in water due to increased weathering.
10
Base cations decreased in both lakes. Such a decrease is rather common in sites where the recovery caused by reduction of acid deposition takes place. Base cations leave the catchments accompanying anions of strong acids in quantities set by stoi-chiometry (Galloway et al., 1983). During the recovery the acid deposition decline can also cause reduction of base cations concentrations due to diminishing weathering 15
rates and/or increase of base cations uptake (Vesel`y et al., 2002). Diminishing base cations concentrations slows recovery of surface waters.
Even though concentrations of N compounds in precipitation did not decrease, NO−3 concentrations in both lakes distinctly declined. Taking into account data from litera-ture (Kop ´aˇcek et al., 2005) it can be expected that NH+4 deposited into both catchments 20
is mostly assimilated by plants and/or oxidised by micro-organisms producing nitrate. As a result, in-lake concentrations of ammonium are close to zero. Also, this rather strong demand for ammonium by plants and micro-organisms prevents increasing in sorption of ammonium in soil. The N mass balances showed large increases (aver-age 15%) in retention at both sites. It is not possible to determine if the increased N 25
retention occurred in the lakes themselves or in the catchments. Since physical reten-tion of nitrate by soil is unlikely, the most likely explanareten-tion of increased N retenreten-tion is increased N uptake by terrestrial vegetation and storage as organic N (i.e. immo-bilisation) and/or increased denitrification rates. Both the progress in recovery from
HESSD
4, 3113–3144, 2007
What affects the nitrogen retention in Tatra Mountains... D. Rzycho ´n and A. Worsztynowicz Title Page Abstract Introduction Conclusions References Tables Figures ◭ ◮ ◭ ◮ Back Close Full Screen / Esc
Printer-friendly Version Interactive Discussion acidification and increase in temperature should cause the denitrification rates to be
higher. However, denitrification was found to cause only a minor loss of deposited N in upland catchments (Curtis and Simpson, 2001). Thus, N retention is most likely due to immobilisation processes in soil.
Both reduced acidification and climate warming may be responsible for the increased 5
N retention. An increase of temperature and some changes in the precipitation pattern, along with a simultaneous decrease in acid deposition (mainly sulphur), took place in the study period, causing a reversal in the trends of acidification.
Additional factors favourable to the N uptake by plants are an increasing proportion of ammonium N in precipitation (Fig. 3) and hydrological changes (Fig. 2) resulting from 10
more variability in monthly precipitation in later years, which should reduce the share of surface flow in the runoff, and consequently increase water residence time in the catchment soil as well as increase chances for an effective uptake of N by vegetation.
In the case of Tatra Mountains there are insufficient data to confirm this hypothesis. Studies comparing plant distributions around the research area, based on the analysis 15
of photographs taken in 1965 and 1999, indicated a succession of forest complexes and overgrowing of clearances and high-mountain pastures. It was noted that within 34 years the area covered with a dwarf pine increased by 28%. The changes are closely connected with the discontinuance of sheep-grazing after the establishment of the Tatra National Park in 1954. The main conclusion from this study is that tree and scrub 20
communities in the Tatra Mountains are currently returning to their natural ecological states (We¸˙zyk and Guzik, 2004). It is difficult, however, to apply the conclusions of this work directly to the catchment of the investigated lakes. Due to their unfavourable location the whole Dlugi Staw catchment and the major part of Zielony Staw catchment could not have been subject to intense grazing.
25
The analysis of changes in the wood tissue of beech trees in Tatra Mountains in years 1931–1992 showed decreases in the annual ring width in 1960–1965 and 1970– 1980. The first period was likely due to very hard winters while the second might have been caused by air pollution, as has been seen in other species (Niedzielska et al.,
HESSD
4, 3113–3144, 2007
What affects the nitrogen retention in Tatra Mountains... D. Rzycho ´n and A. Worsztynowicz Title Page Abstract Introduction Conclusions References Tables Figures ◭ ◮ ◭ ◮ Back Close Full Screen / Esc
Printer-friendly Version Interactive Discussion 2002). At present, beech trees are growing well in the Tatra Mountains area. Thus,
acid deposition and cold temperatures could have reduced N retention. Changes in the seasonal and long-term patterns of surface water NO−
3 concentra-tions reflect the changes in N-cycling that occur in the catchment. The seasonal vari-ability of chemical parameters of surface waters corresponds to stages of terrestrial 5
N saturation (Aber et al., 1989, Stoddard, 1994). In Fig. 7 seasonal NO−
3 concentra-tions in both lakes in 1994 and 2004 are presented. Based on the criteria defined by Stoddard and Traaen (1995) (Table 7) the investigated lakes were assigned to specific N saturation classes. In 1994 the Dlugi Staw was close to the 3rd Stage and Zielony Staw was in the 2nd Stage of N saturation. This means that both catchments were 10
in chronic stages of N-saturation. In 2004, Dlugi Staw moved from Stage 3 to Stage 2. Zielony Staw also showed the decline in NO−
3 concentration and is now close to reaching Stage 1 of N saturation. These changes are not explained by changes in N deposition, which, as showed earlier, does not indicate a downward tendency.
Despite the fact that observed trends in the Tatra Mountains are quite rare, they are 15
not unique. The Lange Bramke stream in Germany showed clear change in stage of N saturation from stage 1 in 1970 to stage 3 in 1985 and back to stage 1 in 1999 (Wright et al., 2001). These changes are not explained by changes in N deposition. A comparison of concentrations of SO2−4 , NO−3, Cl−, Ca2+ and pH at 432 mountain streams localities in the Czech Republic sampled at a time of high (1984–1986) and 20
relatively low (1996–2000) acidic deposition showed a decrease of NO−3 of up to 60% in stream waters with pH≤6 while the decrease of N emissions in Central Europe was only about 35% (Vesel´y et al., 2002). The difference in NO−3 concentrations between the two periods was probably enhanced by (a) an increase of NO−3 leaching due to enhanced mineralization of forest floor resulting from forest damage and deforestation 25
in the mid-1980s (b) by higher uptake of N under less acidic stress in the late-1990s. Also in Austrian mountain lakes (Sammaruga-W ¨ograth et al., 1997) an increasing concentration of SO2−4 and a decreasing content of inorganic N over a period of 10 years were observed. The changes were inverse to the deposition changes recorded
HESSD
4, 3113–3144, 2007
What affects the nitrogen retention in Tatra Mountains... D. Rzycho ´n and A. Worsztynowicz Title Page Abstract Introduction Conclusions References Tables Figures ◭ ◮ ◭ ◮ Back Close Full Screen / Esc
Printer-friendly Version Interactive Discussion in this area and attributed to increased weathering rates and increased biological
ac-tivity resulting from climate warming. Sickman et al. (2001) suggests that if current trends towards warmer air temperatures continue, N-retention will increase in high el-evation catchments in the Sierra Nevada, USA. Rogora (2003) indicates the same for lakes in the Italian Alps. The observed response of the Tatra catchments is consistent 5
with these expectations. The recent research activities carried out in the Karkonosze Mountains lakes, where acid deposition is (and was in the past) much higher than in the case of the Tatras, indicate a very significant N retention, about 85% (Rzycho ´n, unpublished data). It can also be expected that the Karkonosze catchments should show further advancement of this process.
10
5 Conclusions
Acid deposition in Polish Tatra Mountains decreased significantly during the 14 years mainly due to a distinct decrease in sulphate deposition. Despite the lack of clear trends in nitrogen deposition, a significant drop in N concentrations was observed in the investigated lakes. Significant increases (about 15% in both catchments) in the 15
retention of nitrogen compounds also occurred. An improvement in nitrogen saturation status in both catchments was observed. This phenomenon probably resulted from small changes of many factors (mainly assimilation by plants and microbes) caused mostly by the decreasing acidification of the environment and warmer temperatures.
Acknowledgements. This work was financially supported by Polish Ministry of the Environment
20
and the National Fund for Environmental Protection and Water Management. We appreciate the assistance of M. and M. Kot from the Tatra Mountain National Park, who performed field work over many years. We thank Norwegian Institute for Water Research (NIVA) and Norwegian Institute for Air Research (NILU) for fruitful cooperation in 1992–1996. Last but not least we would like to thank 2 anonymous reviewers for many helpful comments and critiques,
25
which improved the manuscript.
HESSD
4, 3113–3144, 2007
What affects the nitrogen retention in Tatra Mountains... D. Rzycho ´n and A. Worsztynowicz Title Page Abstract Introduction Conclusions References Tables Figures ◭ ◮ ◭ ◮ Back Close Full Screen / Esc
Printer-friendly Version Interactive Discussion
Edited by: P. Dillon and R. F. Wright
References
Aber, J. D., Nadelhoffer, K. J., Steudler, P., and Melillo, J. M.: Nitrogen saturation in northern forest ecosystems, BioScience, 39, 378–386, 1989.
5
Curtis, C. and Simpson, G. (Eds): Summary of research under DETR contract “Acidification of freshwaters: the role of nitrogen and the prospects for recovery” EPG/1/3/117. Execu-tive Summary. Research Report no 79. Environmental Change research Centre, University College London, 49 pp, 2001.
Davies, J. J. L., Jenkins, A., Monteith, D. T., Evans, C. D., and Cooper, D. M.: Trends in surface
10
chemistry of acidified UK Freshwaters, 1988–2002, Environ. Pollut., 137, 27–39, 2005. Dillon, P. L., Skjelkv ˚ale, B. L., Somers, K. M., and Torseth, K.: Coherent responses of sulphate
concentration in Norwegian lakes; relationship with sulphur deposition and climate indices, Hydrol. Earth Syst. Sci., 7(4), 596–608, 2003.
EMEP:http://www.emep.int/index data.html, 2005.
15
Evans, C. D. and Monteith, D. T.: Natural and anthropogenic changes in the chemistry of six UK mountain lakes, Water, Air Soil Pollut., 2, 33–46, 2002.
Galloway, J. N., Norton, S. A., and Church, M. R.: Freshwater acidification from atmospheric deposition of sulphuric acid: A conceptual model, Environ. Sci. Technol., 17, 541–545, 1983. Gunn, J. M. (Ed.): Restoration and recovery of an industrial region. Springer. New York, 1985.
20
Helsel, D. R. and Hirsch, R. M.: Statistical Methods in Water Resources. Studies in Environ-mental Science 49. Elsevier Science Publishers, pp 522, 1992.
IMGW (Institute of Meteorology and Water Management): available at: http://www.imgw.pl, 2005.
Kop ´aˇcek, J., Stuchlik, E., and Wright, R. F.: Long-term trends and spatial variability in nitrate
25
leaching from alpine catchment-lake ecosystems in the Tatra Mountains (Slovakia-Poland), Environ. Pollut., 136, 89–101, 2005.
Kownacki, A., Galas, J., Dumnicka, E., and Mielewczyk, S.: Invertebrate communities in per-manent and temporary high mountain lakes (Tatra Mts), Annals Limnol., 36(3) 181–188, 2000.
HESSD
4, 3113–3144, 2007
What affects the nitrogen retention in Tatra Mountains... D. Rzycho ´n and A. Worsztynowicz Title Page Abstract Introduction Conclusions References Tables Figures ◭ ◮ ◭ ◮ Back Close Full Screen / Esc
Printer-friendly Version Interactive Discussion
Łajczak A.: Precipitation and runoff in the polish Tatra in the light of long-term measurements, (in Polish), Geographic Journal LIX, 2, 137-170, 1988.
Lydersen, E., Rzycho ´n, D., Worsztynowicz, A., Tørseth, K., Hanssen, J. E., Mill, W. A., Kot, M., Henriksen, A., and Wathne, B. M.: Critical loads of acidity to lakes in the Polish Tatra Mountains. Final report, Report 44/1997, NIVA, Oslo, 49 pp, 1997.
5
Niedzielska, B., Wilczy ˜nski, S., and Wasik, R.: The analysis of changes in the wood tissue of the beech (Fagus silvatica) in Tatra mountains in years 1931–1992. (in Polish) in: Przemiany œrodowiska przyrodniczego Tatr. PTPNoZ. Zakopane-Krakow, 209–212, 2002.
Nied´zwied´z, T.: Long-term variability of air temperature and precipitation in the Tatra Moun-tains. Proceedings of the 1st Polish Conference on The Tatra National Park Nature and Man.
10
Present state and perspectives of future Tatra investigation. Zakopane, 6–9 October 1995, 161–163, 1996.
Nied´zwied´z, T.: Summer temperature patterns over the Tatra Mountains (Central Europe) from 1550 to 2004. Presentation at The 5th Annual Meeting of the European Meteor Society. 12-16 September 2005, Utrecht, The Netherlands, available at: http://www.cosis.net.abstracts/ 15
EMS05/00422/EMS05-A-00422.pdf, 2005.
Norton, S. A. and Vesely, J.: Acidification and Acid Rain, Environ. Geochem., 9, 367–406, 2003.
Oleksynowa, K.: Geochemical characterization of the waters in the Tatra Mountains. (in Polish) Acta Hydrobiologica, vol.12. fasc.1, 100 pp, 1970.
20
Otre¸bska-Starklowa, B., Trepi ´nska, J., Nied´zwied´z, T., and Bednarz, Z.: Trends of climatic change in the Polish Tatra Mountains. (in Polish) Proceedings of the 1st Polish Conference on The Tatra National Park Nature and Man. Present state and perspectives of future Tatra investigation. Zakopane, 6–9 October 1995, 168–171, 1996.
Rogora, M., Mosello, R., and Arisci, S.: The effect of climatic warming on the hydrology of
25
alpine lakes, Water, Air Soil Pollut., 148, 347–361, 2003.
Rzycho ´n, D.: Impact of acid precipitation on acidification of the Tatra lakes, (in Polish) Wydawnictwo Uniwersytetu ´Sla¸skiego, Katowice, 132 pp, 1998.
Sickman, J. O., Leydecker, A., and Melack, J. M.: Nitrogen mass balances and abiotic controls on N retention and yield in high-elevation catchments of the Sierra Nevada, California, United
30
States, Water Resour. Res., 37(5), 1445–1461, 2001.
Skiba, S.: Studia nad glebami wytworzonymi w r ´o˙znych pie¸trach klimatyczno-ro´slinnych krys-talicznej cze¸´sci Tatr Polskich. (in Polish) Roczniki Gleboznawcze T. XXVIII, Nr 1, Warszawa
HESSD
4, 3113–3144, 2007
What affects the nitrogen retention in Tatra Mountains... D. Rzycho ´n and A. Worsztynowicz Title Page Abstract Introduction Conclusions References Tables Figures ◭ ◮ ◭ ◮ Back Close Full Screen / Esc
Printer-friendly Version Interactive Discussion
1977, 205-239, 1977.
Skjelkv ˚ale, B. L., Stoddard, J., Jeffries, D., Tørseth, K., Høg ˚asen, T., Bowman, J., Mannio, J., Monteith, D., Mosello, R., Rogora, M., Rzycho ´n, D., Vesel´y, J., Wieting, J., Wilander, A., and Worsztynowicz, A.: Regional scale evidence for improvements in surface water chemistry 1990–2001, Environ. Pollut., 137, 165–176, 2005.
5
Sommaruga-W ¨ograth, S., Koinig, K. A., Schmidt, R., Sommaruga, R., Tessadri, R., and Psen-ner, R.: Temperature effects on the acidity of remote alpine lakes, Nature, 387, 64–67, 1997. Stoddard, J. L.: Long-Term Changes in Watershed Retention of Nitrogen. Its Causes and
Aquatic Consequences. Advances in Chemistry Series No. 237. American Chemical Society. Washington, DC, 223–284, 1994.
10
Stoddard, J. L. and Traaen, T. S.: The stages of nitrogen saturation: Classification of catch-ments included in “ICP on waters”, in: Mapping and modeling of critical loads for nitrogen – a workshop report, edited by: Horning, M., Sutton, M. A., and Wilson, R. B., 69–76. Pro-ceedings of Grange-over-Sands Workshop, 24–26 Oct., 1994, Institute of Terrestrial Ecology, Edinburgh, UK, 1995.
15
Stoddard, J. L., Jeffries, D. S., L ¨ukewille, A., Forsius, M., Mannio, J., and Wilander, A.: Environ-mental chemistry – is acidification still an ecological threat?, Reply, Nature, 407, 857–858, 2000.
Szafer, W.: The Tatra National Park. (in Polish) Zakład Ochrony Przyrody PAN Krak ´ow, 675 pp, 1962.
20
Trafas, K.: Atlas of the Tatra National Park. Wojskowe Zakady Kartograficzne, Zakopane – Krak ´ow, 1985.
Vesel´y, J., Hruska, J., Norton, S. A., and Johnson, C. E.: Trends in the chemistry of acidified Bohemian lakes from 1984 to 1995. I. Major solutes, Water Air Soil Pollut., 108(1–2), 107– 127, 1998.
25
Vesel´y, J., Majer, V., and Norton, S. A.: Heterogeneous response of central European streams to decreased acidic atmospheric deposition, Environ. Pollut., 120(2), 275–281, 2002. Vesel´y, J., Majer, V., Kop ´aˇcek, J., and Norton, S. A.: Increasing temperature decreases
aluminium concentrations in Central European lakes recovering from acidification, Limnol. Oceanogr., 48(6), 2346–2354, 2003.
30
We¸˙zyk, P. and Guzik, M.: The use of “Photogrammetry-GIS” (P-GIS) for the analysis of changes in the Tatra Mountains natural Environment, in: A message from the Tatra, edited by: Widacki, W., Bytnerowicz, A., and Riebau, A., Geographical Information Systems and
HESSD
4, 3113–3144, 2007
What affects the nitrogen retention in Tatra Mountains... D. Rzycho ´n and A. Worsztynowicz Title Page Abstract Introduction Conclusions References Tables Figures ◭ ◮ ◭ ◮ Back Close Full Screen / Esc
Printer-friendly Version Interactive Discussion
Remote Sensing in Mountain Environmental Research, Institute of Geography and Spatial Management Jagiellonian University, USDA Forest Service, Krak ´ow, Poland. Riverside, Cal-ifornia, USA, 31-46, 2004.
Wright, R. F., Alewell, C., Cullen, J. M., Evans, C .D., Marchetto, A., Moldan, F., Prechtel, A., and Rogora, M.: Trends in nitrogen deposition and leaching in acid- sensitive stream in
5
Europe, Hydrol. Earth Syst. Sci., 5(3), 299–309, 2001.
HESSD
4, 3113–3144, 2007
What affects the nitrogen retention in Tatra Mountains... D. Rzycho ´n and A. Worsztynowicz Title Page Abstract Introduction Conclusions References Tables Figures ◭ ◮ ◭ ◮ Back Close Full Screen / Esc
Printer-friendly Version Interactive Discussion
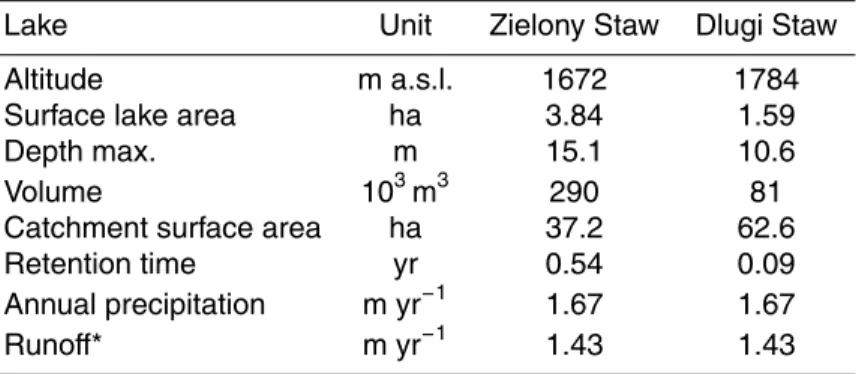
Table 1. Morphological and hydrological parameters of the studied Tatra lakes (Szafer et al., 1962; Rzycho ´n, 1998).
Lake Unit Zielony Staw Dlugi Staw
Altitude m a.s.l. 1672 1784
Surface lake area ha 3.84 1.59
Depth max. m 15.1 10.6
Volume 103m3 290 81
Catchment surface area ha 37.2 62.6
Retention time yr 0.54 0.09
Annual precipitation m yr−1 1.67 1.67
Runoff* m yr−1 1.43 1.43
* The annual mean values of runoff calculated assuming the runoff coefficient (runoff/precipitation) as equal to 0.86 (Łajczak, 1980, 1988).
HESSD
4, 3113–3144, 2007
What affects the nitrogen retention in Tatra Mountains... D. Rzycho ´n and A. Worsztynowicz Title Page Abstract Introduction Conclusions References Tables Figures ◭ ◮ ◭ ◮ Back Close Full Screen / Esc
Printer-friendly Version Interactive Discussion
Table 2.Land cover in the catchments.
Type % of the catchment area
Zielony Staw Dlugi Staw
Forest (dwarf pine) 4.2 0
Meadows 37.7 20.2
Moraine 27.2 42.8
Bare rocks 21.2 34.1
Lake 9.7 2.8
HESSD
4, 3113–3144, 2007
What affects the nitrogen retention in Tatra Mountains... D. Rzycho ´n and A. Worsztynowicz Title Page Abstract Introduction Conclusions References Tables Figures ◭ ◮ ◭ ◮ Back Close Full Screen / Esc
Printer-friendly Version Interactive Discussion
Table 3.Trends in precipitation chemistry in the Tatras for the period 1992–2005.
Parameter Median slope [meq/m3year] Significance level p
Ca2++Mg2+ +0.963 <0.01 SO2−4 –1.91 <0.01 NO− 3 –0.238 n.s. NH+4 +0.360 n.s. N (NO− 3+ NH + 4) +0.05 n.s. H+ (’92–’96) +0.616 <0.01 H+ (’01–’05) –0.212 <0.01 H+ (’92–’05) –2.23 <0.01 *n.s. – not significant
HESSD
4, 3113–3144, 2007
What affects the nitrogen retention in Tatra Mountains... D. Rzycho ´n and A. Worsztynowicz Title Page Abstract Introduction Conclusions References Tables Figures ◭ ◮ ◭ ◮ Back Close Full Screen / Esc
Printer-friendly Version Interactive Discussion
Table 4.Trends in water chemistry for the two Tatra lakes for the period 1992–2005.
Parameter Median slope [meq/m3/yr] Significance level Dlugi Staw Ca2++Mg2+ –1.604 <0.01 SO2−4 –2.60 <0.01 NO− 3 –2.03 <0.01 ANC +2.16 <0.01 H+(’92–’96) +0.073 n.s. H+(’01–’05) –0.146 n.s. H+(’92–’05) –0.017 <0.01 Zielony Staw Ca2++Mg2+ –2.03 <0.01 SO2−4 -2.72 <0.01 NO− 3 –1.57 <0.01 ANC +1.55 <0.01 H+(’92–’96) –0.026 n.s. H+(’01–’05) –0.007 n.s. H+(’92–’05) +0.019 <0.01 *n.s. – not significant 3134
HESSD
4, 3113–3144, 2007
What affects the nitrogen retention in Tatra Mountains... D. Rzycho ´n and A. Worsztynowicz Title Page Abstract Introduction Conclusions References Tables Figures ◭ ◮ ◭ ◮ Back Close Full Screen / Esc
Printer-friendly Version Interactive Discussion
Table 5.Annual fluxes (meq/m2/yr) of N- and S-compounds in the two Tatra lakes, Dlugi Staw and Zielony Staw, in the years 1992–1996 and 2001–2004.
Zielony Staw Dlugi Staw SO2−4 NO− 3+ NH + 4 SO 2− 4 NO − 3+ NH + 4 1992–1996 2001–2004 1992–1996 2001–2004 1992–1996 2001–2004 1992–1996 2001–2004 Input (dry + wet) 96.5 86.2 90.1 113.0 96.5 86.2 90.1 113.0 Output 83.3 77.9 41.0 33.9 85.3 82.9 64.9 62.8 Input-Output 13.2 8.3 49.1 79.1 11.2 3.3 25.2 50.2 Leakage (%) 86.3 90.4 45.5 30.0 88.4 96.2 72.0 55.6 Retention % 13.7 9.6 54.5 70.0 11.6 3.8 28.0 44.6
HESSD
4, 3113–3144, 2007
What affects the nitrogen retention in Tatra Mountains... D. Rzycho ´n and A. Worsztynowicz Title Page Abstract Introduction Conclusions References Tables Figures ◭ ◮ ◭ ◮ Back Close Full Screen / Esc
Printer-friendly Version Interactive Discussion
Table 6.Annual fluxes (meq/m2/yr) of N- and S-compounds in the two Tatra lakes, Dlugi Staw and Zielony Staw, in the years 1996 and 2002.
Zielony Staw Dlugi Staw
SO2−4 NO− 3+ NH + 4 SO 2− 4 NO − 3+ NH + 4 1996 2002 1996 2002 1996 2002 1996 2002
Input (dry + wet) 120.7 70.3 105.8 92.0 120.7 70.3 105.8 92.0
Output 102.2 75.3 53.5 39.9 100.7 79.2 75.7 62.8
Input-Output 18.5 –5.0 52.4 52.1 20.0 –8.9 30.2 32.6
Leakage (%) 84.6 107.1 50.5 43.4 83.5 112.6 71.5 64.6
Retention % 15.4 ∼0 49.5 56.6 16.5 ∼0 28.5 35.4
HESSD
4, 3113–3144, 2007
What affects the nitrogen retention in Tatra Mountains... D. Rzycho ´n and A. Worsztynowicz Title Page Abstract Introduction Conclusions References Tables Figures ◭ ◮ ◭ ◮ Back Close Full Screen / Esc
Printer-friendly Version Interactive Discussion
Table 7. Criteria for stages of nitrogen saturation based on monthly average NO−
3
concentra-tions in runoff (Stoddard and Traaen, 1995). Stage Criteria
0 ≥3 months in the growing season with NO−
3≤3 meq/m 3
and peak value <20 meq/m3
1 1–2 months in the growing season with NO−
3≤3 meq/m 3
or ≥3 months in the growing season with NO−3≤3 meq/m3and peak value ≥20 meq/m3 2 No months with NO−3≤3 meq/m3
and ≥3 months in the growing season with NO−
3<50 meq/m 3
3 <3 months with NO−
3<50 meq/m 3
HESSD
4, 3113–3144, 2007
What affects the nitrogen retention in Tatra Mountains... D. Rzycho ´n and A. Worsztynowicz Title Page Abstract Introduction Conclusions References Tables Figures ◭ ◮ ◭ ◮ Back Close Full Screen / Esc
Printer-friendly Version Interactive Discussion
Fig. 1.Location of the Tatra Mountains and the study area.
HESSD
4, 3113–3144, 2007
What affects the nitrogen retention in Tatra Mountains... D. Rzycho ´n and A. Worsztynowicz Title Page Abstract Introduction Conclusions References Tables Figures ◭ ◮ ◭ ◮ Back Close Full Screen / Esc
Printer-friendly Version Interactive Discussion 0 200 400 600 800 1992 1994 1996 1999 2001 2003 2005 years mm
HESSD
4, 3113–3144, 2007
What affects the nitrogen retention in Tatra Mountains... D. Rzycho ´n and A. Worsztynowicz Title Page Abstract Introduction Conclusions References Tables Figures ◭ ◮ ◭ ◮ Back Close Full Screen / Esc
Printer-friendly Version Interactive Discussion 0 10 20 30 1992 1994 1996 1999 2001 2003 2005 y ears me q /m 2 mo n th S O4-S 0 10 20 30 1992 1994 1996 1999 2001 2003 2005 y ears me q /m 2 mo n th NO3-N NH4-N
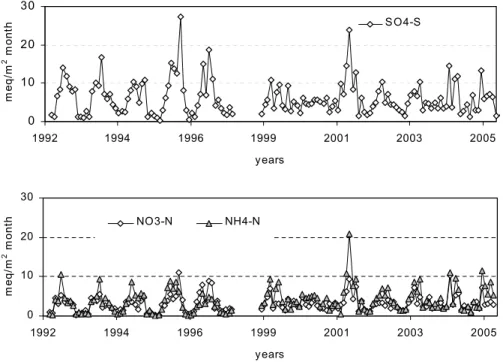
Fig. 3.Monthly inputs of SO2−4 , NO−
3, and NH +
4 by wet deposition in the study area.
HESSD
4, 3113–3144, 2007
What affects the nitrogen retention in Tatra Mountains... D. Rzycho ´n and A. Worsztynowicz Title Page Abstract Introduction Conclusions References Tables Figures ◭ ◮ ◭ ◮ Back Close Full Screen / Esc
Printer-friendly Version Interactive Discussion 0.45 0.50 0.55 0.60 0.65 1992 1996 2000 2004 y ears N /(N + S ) 0.45 0.50 0.55 0.60 0.65 1992 1996 2000 2004 y ears N H4 +/( N H4 + + N O3 -)
Fig. 4. Nitrogen deposition expressed as fraction of N + S deposition (left) and ammonium
HESSD
4, 3113–3144, 2007
What affects the nitrogen retention in Tatra Mountains... D. Rzycho ´n and A. Worsztynowicz Title Page Abstract Introduction Conclusions References Tables Figures ◭ ◮ ◭ ◮ Back Close Full Screen / Esc
Printer-friendly Version Interactive Discussion 0 20 40 60 80 100 120 140
Ca Mg Na K SO4 NO3 ANC
me q /m 3 Dlugi Staw Zielony Staw
Fig. 5. Volume-weighted annual mean concentrations of major chemical compounds in lake outflow from the two Tatra Mountain lakes, Dlugi Staw and Zielony Staw, for the years 1992– 2005.
HESSD
4, 3113–3144, 2007
What affects the nitrogen retention in Tatra Mountains... D. Rzycho ´n and A. Worsztynowicz Title Page Abstract Introduction Conclusions References Tables Figures ◭ ◮ ◭ ◮ Back Close Full Screen / Esc
Printer-friendly Version Interactive Discussion -50 0 50 100 150 200 1992 1994 1996 1998 2000 2002 2004 y ears A N C , m e q /m 3 Dlugi S taw Zielony S taw 0 20 40 60 80 1992 1993 1994 1995 1996 1997 1998 1999 2000 2001 2002 2003 2004 2005 y ears N O 3 -, m e q /m 3 Dlugi S taw Zielony S taw 0 40 80 120 160 1992 1994 1996 1998 2000 2002 2004 y ears SO 4 2-, m e q /m 3 Dlugi S taw Zielony S taw 0 50 100 150 200 250 1992 1994 1996 1998 2000 2002 2004 y ears C a 2+ + M g 2+ , m e q /m 3 Dlugi S taw Zielony S taw 4 5 6 7 8 1992 1994 1996 1998 2000 2002 2004 y ears p H Dlugi S taw Zielony S taw
HESSD
4, 3113–3144, 2007
What affects the nitrogen retention in Tatra Mountains... D. Rzycho ´n and A. Worsztynowicz Title Page Abstract Introduction Conclusions References Tables Figures ◭ ◮ ◭ ◮ Back Close Full Screen / Esc
Printer-friendly Version Interactive Discussion Dlugi S taw 1994 0 20 40 60 80 01 03 05 07 09 11 m onths N O 3 -, m e q /m 3 s tage 3 Zielony S taw 1994 0 2 0 4 0 6 0 8 0 0 1 0 3 0 5 0 7 0 9 1 1 m o n th s N O 3 -, m e q /m 3 s tage 2 Dlugi S taw 2004 0 20 40 60 80 01 03 05 07 09 11 m onths N O3 -, m e q /m 3 s tage 2 Zielony S taw 2004 0 20 40 60 80 01 03 05 07 09 11 m onths N O3 -, m e q /m 3 s tage 2
Fig. 7.Seasonal patterns of NO3− concentrations (meq/m3) in lake outflow from Zielony Staw and Dlugi Staw. Stages of N saturation (following the criteria of Stoddard and Traaen, 1995) are indicated.