HAL Id: hal-01395116
https://hal.archives-ouvertes.fr/hal-01395116
Submitted on 10 Nov 2016
HAL is a multi-disciplinary open access
archive for the deposit and dissemination of
sci-entific research documents, whether they are
pub-lished or not. The documents may come from
teaching and research institutions in France or
abroad, or from public or private research centers.
L’archive ouverte pluridisciplinaire HAL, est
destinée au dépôt et à la diffusion de documents
scientifiques de niveau recherche, publiés ou non,
émanant des établissements d’enseignement et de
recherche français ou étrangers, des laboratoires
publics ou privés.
present-day post-orogenic deformation of the Western
Alps and Pyrenees
Hai Ninh Nguyen, Philippe Vernant, Stephane Mazzotti, Giorgi Khazaradze,
Eva Asensio
To cite this version:
Hai Ninh Nguyen, Philippe Vernant, Stephane Mazzotti, Giorgi Khazaradze, Eva Asensio. 3-D GPS
velocity field and its implications on the present-day post-orogenic deformation of the Western Alps
and Pyrenees. Solid Earth, European Geosciences Union, 2016, 7 (5), pp.1349-1363.
�10.5194/se-7-1349-2016�. �hal-01395116�
www.solid-earth.net/7/1349/2016/ doi:10.5194/se-7-1349-2016
© Author(s) 2016. CC Attribution 3.0 License.
3-D GPS velocity field and its implications on the present-day
post-orogenic deformation of the Western Alps and Pyrenees
Hai Ninh Nguyen1, Philippe Vernant1, Stephane Mazzotti1, Giorgi Khazaradze2, and Eva Asensio2
1Laboratoire Géosciences Montpellier, Université Montpellier, Montpellier, France
2Grup Risknat, Departament de Geodinàmica i Geofísica, Facultat de Geologia, Universitat de Barcelona (UB),
Martí i Franquès s/n, 08028 Barcelona, Spain
Correspondence to:Philippe Vernant ([email protected])
Received: 18 May 2016 – Published in Solid Earth Discuss.: 22 June 2016
Revised: 22 August 2016 – Accepted: 28 August 2016 – Published: 21 September 2016
Abstract. We present a new 3-D GPS velocity solution for 182 sites for the region encompassing the Western Alps, Pyrenees, and southern France. The velocity field is based on a Precise Point Positioning (PPP) solution, to which we apply a common-mode filter, defined by the 26 longest time series, in order to correct for network-wide biases (ref-erence frame, unmodeled large-scale processes, etc.). We show that processing parameters, such as troposphere de-lay modeling, can lead to systematic velocity variations of
0.1–0.5 mm yr−1affecting both accuracy and precision,
es-pecially for short (< 5 years) time series. A velocity con-vergence analysis shows that minimum time-series lengths of ∼ 3 and ∼ 5.5 years are required to reach a velocity
sta-bility of 0.5 mm yr−1 in the horizontal and vertical
com-ponents, respectively. On average, horizontal residual
ve-locities show a stability of ∼ 0.2 mm yr−1 in the
West-ern Alps, Pyrenees, and southWest-ern France. The only signifi-cant horizontal strain rate signal is in the western Pyrenees
with up to 4 × 10⁻⁹yr−1 NNE–SSW extension, whereas
no significant strain rates are detected in the Western Alps (< 1 × 10⁻⁹yr−1). In contrast, we identify significant uplift rates up to 2 mm yr−1in the Western Alps but not in the Pyre-nees (0.1 ± 0.2 mm yr−1). A correlation between site eleva-tions and fast uplift rates in the northern part of the West-ern Alps, in the region of the Würmian ice cap, suggests that part of this uplift is induced by postglacial rebound. The very slow uplift rates in the southern Western Alps and in the Pyrenees could be accounted for by erosion-induced re-bound.
1 Introduction
The southwestern European and Mediterranean domains are part of the broad plate boundary zone that accommodates the relative motion between the Nubian and Eurasian plates. In this domain, active tectonics in the Western Alps and Pyre-nees mountains are revealed by a moderate level of seismic activity, geological evidences for Quaternary deformation, and sparse geomorphological observations of recent defor-mation (e.g., Alasset and Meghraoui, 2005; Chardon et al., 2005; Chevrot et al., 2011; Lacan and Ortuño, 2012; Lar-roque et al., 2009). Global Positioning System (GPS) data show that central Europe east of the Rhine Graben and north
of the Alps behaves rigidly at ∼ 0.4 mm yr−1 and defines a
stable European reference frame (e.g., Altamimi et al., 2011; Nocquet and Calais, 2003). To first order, horizontal defor-mation across the Alps and the Pyrenees is unresolvable
at the level of GPS uncertainty, ∼ 0.5 mm yr−1 (Nocquet,
2012; Rigo et al., 2015; Vigny et al., 2002), although recent studies suggest small possible extension in the French Alps (Walpersdorf et al., 2015) and the western Pyrenees (Asensio et al., 2012; Rigo et al., 2015). In contrast, studies of vertical velocities from GPS data indicate significant uplift rates in the Western and Central Alps (up to ∼ 2 mm yr−1), decreas-ing toward the Eastern Alps (Serpelloni et al., 2013).
These very slow deformation rates in a stable plate con-text highlight the importance of characterization and quan-tification of GPS velocity uncertainties. Numerous sources of uncertainties affect GPS velocity estimations, especially in the vertical component: e.g., reference frame errors (Argus et al., 1999), seasonal signals (Blewitt and Lavallée, 2002), and
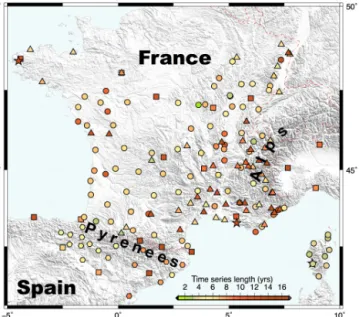
Figure 1. Distribution of the permanent stations used in this study. Symbols denote network (cf. text): stars – IGS; squares – EUREF-EPN; triangles: RENAG; circles – RGP; hexagons: Spanish net-works (Topo-Iberia, RGAN, CATNET, EPSH). Symbols are color-coded according to time-series length.
atmospheric loading effects (Tregoning and Watson, 2009). These various sources of noise and non-tectonic signals can result in artificial trends over several years and systematic bi-ases that may be correlated over large regions. Western Eu-rope, as a near-stable region associated with low-deformation tectonic zones, provides an interesting test case to study GPS velocity and uncertainty estimations. Can tectonic velocities,
likely below 1 mm yr−1, be resolved for the Western Alps
and the Pyrenees mountains? Can uplift patterns in these two mountain belts help constrain studies of ongoing tectonics and dynamics (e.g, Champagnac et al., 2007; Fox et al., 2015; Genti et al., 2015; Vernant et al., 2013)?
In this study, we analyze data from 182 permanent GPS stations located in France and Spain in order to characterize the horizontal and vertical deformation patterns in the West-ern Alps and Pyrenees. We focus on estimations of velocity uncertainties, mainly related to processing options and pa-rameters, to define the minimum time span required to reach a set of horizontal and vertical velocity precision thresholds. These results are used to derive regional velocity and strain rate patterns in our study region.
2 GPS data and processing
We perform an analysis of GPS data from 1997 to December 2013 and provide a self-consistent velocity solution for 182
stations between longitudes −5 and 10◦E and latitudes 41
and 49◦N, with time series from 1.9 to 16.0 years (average 7.8 years), cf. Fig. 1. Our analysis comprises stations from
the following networks and operators: International GNSS Service (IGS, 3 stations), European Permanent GNSS (EU-REF, 20 stations), Topo-Iberia (3 stations), Red de Geodesia Activa de Navarra (RGAN, 7 stations), Escuela Politécnica Superior de Huesca (EPSH, 1 station), La Xarxa CatNet de ICGC (6 stations), French Réseau National GPS (RENAG, 56 stations), and French Réseau GNSS Permanent (RGP, 86 stations); cf. Acknowledgement section for network and data references. Some of these networks include sites oper-ated for geographic or cadastral purposes and are not always geodetic-quality monuments. We omit two sites of the RE-NAG network (BURE and JANU) because of numerous in-terruptions that cause significant nonlinearity to the time se-ries.
For data processing, we use the Precise Point Positioning (PPP) software developed by the Canadian Geodetic Survey of Natural Resources Canada (CSRS) (Héroux and Kouba, 2001). This CSRS-PPP version 1.5 software provides GPS float solutions utilizing precise satellite orbits and clocks, satellite and receiver absolute antenna phase center (APC) mapping, tropospheric models (hydrostatic and wet delays, and mapping functions), solid Earth and ocean tide loading, and Earth rotation parameters. For our reference solution, we use IGS final products (Kouba, 2009) for satellite orbits and clocks, Earth rotation models, and phase mapping correc-tions for both satellite and ground-based antennas. We apply ocean-tide loading corrections based on the FES2004 model (Lyard et al., 2006). Tropospheric delays are estimated and corrected using Vienna mapping functions (VMF1, Boehm et al., 2006) with 10◦elevation cutoff angle, zenith delay es-timated every 5 min, and gradients every 6 h. A priori tropo-sphere parameters are derived from the European Centre for Medium-Range Weather Forecasts (http://www.ecmwf.int/). We tested several processing options in order to esti-mate their impact on daily coordinates and estiesti-mated ve-locities. Comparisons with our reference solution show that the choice of tropospheric model has limited impact on fi-nal velocities. Using global mapping functions (GMF) in-stead of VMF1 results in mean differences of 0.2 and less than 0.1 mm yr−1 in vertical and horizontal velocities, re-spectively. In contrast, the omission of Earth rotation models can result in significant impact in the PPP processing (Kouba, 2009). Our test solution without Earth rotation corrections yields horizontal and vertical velocities that vary from the reference solution by 0.3 and 0.5 mm yr−1on average. Simi-larly, the choice of APC mapping models can result in signif-icant velocity variations. We illustrate this point by compar-ing a solution with the previous IGS model (igs05.atx, asso-ciated with IGS05 reference system; Rothacher and Schmid, 2006) with our reference solution that uses the current model (igs08.atx, associated with IGS08 reference system; Rebis-chung et al., 2011). North, east, and vertical velocities of
these two solutions differ by 0.1, 0.3, and 0.5 mm yr−1 on
average. These tests indicate that the choice of processing pa-rameters can lead to systematic velocity variations of the
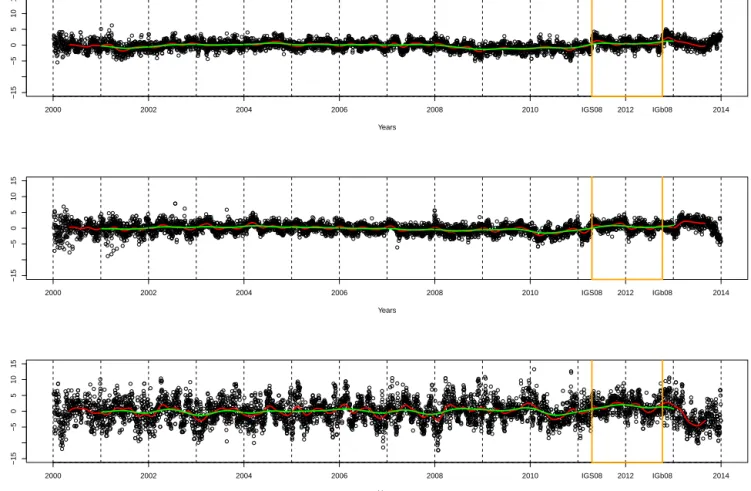
or-2000 2002 2004 2006 2008 2010 2012 2014 −15 −5 0 5 10 15 Years Nor th filter (mm) IGS08 IGb08 2000 2002 2004 2006 2008 2010 2012 2014 −15 −5 0 5 10 15 Years East filter (mm) IGS08 IGb08 2000 2002 2004 2006 2008 2010 2012 2014 −15 −5 0 5 10 15 Years Up filter (mm) IGS08 IGb08
Figure 2. Common-mode stacked filter. Black circles show daily positions. Red and green curves show 1-month and 1-year time averages. Yellow vertical lines show the IGS05 – IGS08 and the IGS08 – IGb08 transitions.
der of 0.5 mm yr−1, affecting primarily short (< 5 years) time series. Because the impacts of those parameter choices are dependent on the duration of the time series, the associated uncertainties affect both the velocity accuracies (e.g., whole network translations) and precisions (e.g., apparent relative motions between sites) and must be considered for tectonic analysis of GPS data, especially in extremely low-deforming areas such as western Europe.
3 Time-series analysis
3.1 Time-series model
Daily position time series are decomposed into a linear term (constant velocity), sine functions with annual and semi-annual periods, and offsets defined by antenna, dome, and receiver changes as well as a visual inspection of the series. For each station’s north, east, and vertical components, posi-tion time series are inverted using a least-square norm to find the best-fit amplitudes of all model parameters.
Uncertainties in GPS velocities are a function of the posi-tion repeatability, the length of the time series, the number of
data points, the presence of steps in the time series, and the noise model (Agnew, 1992; Williams, 2003). For each sta-tion component, we perform a spectral analysis to estimate the spectral index and amplitude of the colored noise in the time series. We then use the formulation of Williams (2003) to calculate the standard error on the north, east, and vertical velocities. Spectral indices α for our analysis range between
−0.4 and −1.1, with a mean value α = −0.7, indicating that
noise in our PPP time series consists primarily of a combi-nation of white (α = 0) and flicker (α = −1) sources, with a very small random-walk (α = −2) contribution. Mean veloc-ity standard errors are 0.5, 0.4, and 0.7 mm yr−1in the north, east, and vertical components, with a direct dependence on time-series length (cf. Sect. 4.1). This noise analysis is con-sistent with current estimations of noise type in GPS time se-ries analyzed with PPP and double-difference software (e.g., Santamaría-Gómez et al., 2011).
3.2 Reference frame
Daily positions and velocities calculated from our PPP anal-ysis are in a reference frame defined by the satellite orbits and clocks. For the time period of interest these frames
fol-Table 1. Average offsets associated with the IGS reference frame transitions.
Raw data Filtered data Raw data Filtered data IGS05 – IGS08 IGS05 – IGS08 IGS08 – Igb08 IGS08 – Igb08 North average (mm) 2.4 0.4 1.9 0.9 North standard deviation (mm) 0.9 0.8 0.9 0.8 East average (mm) 2.0 0.3 1.5 0.6 East standard deviation (mm) 1.0 1.1 1.1 1.1 Up average (mm) 3.0 −0.1 −3.1 −0.9 Up standard deviation (mm) 2.3 2.2 2.5 1.1
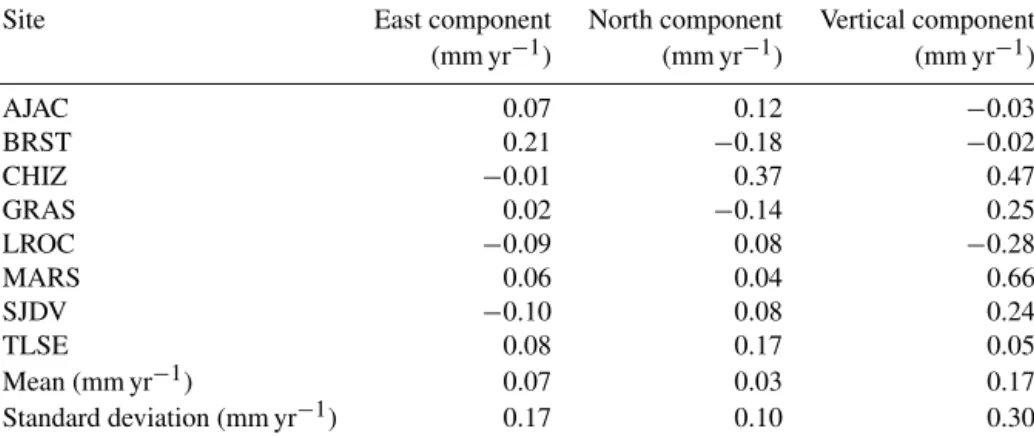
Table 2. Residuals between our velocity solution and the ITRF2008 velocities (Altamimi et al., 2011).
Site East component North component Vertical component (mm yr−1) (mm yr−1) (mm yr−1) AJAC 0.07 0.12 −0.03 BRST 0.21 −0.18 −0.02 CHIZ −0.01 0.37 0.47 GRAS 0.02 −0.14 0.25 LROC −0.09 0.08 −0.28 MARS 0.06 0.04 0.66 SJDV −0.10 0.08 0.24 TLSE 0.08 0.17 0.05 Mean (mm yr−1) 0.07 0.03 0.17 Standard deviation (mm yr−1) 0.17 0.10 0.30
low the official products of the “IGS Reprocessing 1” (e.g., Collilieux et al., 2009) and vary between IGS05 (up to 17 April 2011), IGS08 (between 17 April 2011 and 7 Octo-ber 2012), and IGb08 (after 7 OctoOcto-ber 2012). The transfor-mations between these three reference frames are not null, which results in potential offsets in our calculated positions. However, each processing group involved in the computa-tion of the IGS products may not adopt synchronous model changes, resulting in variation in our time series that cannot be corrected by a single break (T. Herring, personal commu-nication, 2015).
In order to correct for these possible biases, we adopt an empirical approach that consists in removing residual signals common to the whole network. We first calculate a common-mode filter for each component by stacking the daily resid-uals of the time series (post time-series model, cf. Sect. 3.1) for a subset of the 26 stations with 10 years or more of data, 80 % of data completeness, and a network-wide coverage. This filter is then subtracted from the original time series of all 182 stations to produce filtered series that are re-analyzed. Figure 2 shows the common-mode filter. We perform a statis-tical analysis to estimate the effectiveness of this method by estimating the amplitude of offsets in the time series forced at the IGS05 – IGS08 and IGS08 – Igb08 transition dates. For the original (non-filtered) data, significant offsets are es-timated in all three components (about 1.5–3 mm on aver-age, Table 1). In contrast, the filtered data result in much
smaller offsets (0.1–0.9 mm, Table 1) that are not significant compared to their standard deviation. Thus, we consider that our filtered solution is essentially free from reference frame variation problems. This analysis also highlights the impor-tance of the new “Reprocessing 2” analysis currently on go-ing within the IGS.
Velocities calculated after the common-mode filter proce-dure are aligned with a “network average” reference frame, which is not directly aligned with a specific International Terrestrial Reference Frame (ITRF) realization. Our anal-ysis includes eight stations of the core IGS network for which official positions and velocities are provided in the latest ITRF2008 (Altamimi et al., 2011). Time series for these stations range between 11 and 16 year-lengths, result-ing in well-constrained velocities. A comparison of our ve-locities with those from ITRF2008 is given in Table 2. The mean differences in the north, east, and vertical components are within their standard errors (0.03 ± 0.10, 0.07 ± 0.17, 0.17 ± 0.30 mm yr−1), indicating no significant difference between our solution and ITRF2008 at the level of ∼ 0.1 and ∼0.3 mm yr−1in the horizontal and vertical components, re-spectively.
4 Precisions and uncertainties on velocities
In order to assess the impact of time-series length on the es-timated velocity for our PPP solution, we perform a
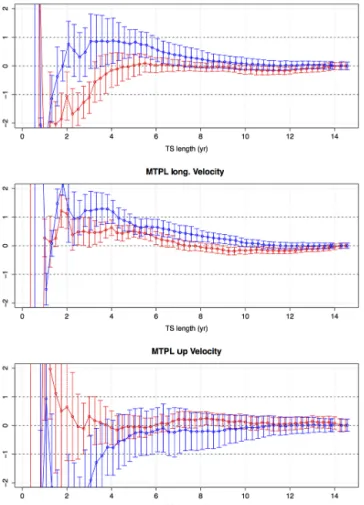
conver-Figure 3. Velocity convergence for the station MTPL for the for-ward (red) and backfor-ward (blue) analyses.
gence analysis for each site in which we compare the velocity computed using the full time-series length to velocities com-puted for a range of time-series lengths of 1 year and more. We estimate the minimum time required for the time-varying velocities to be similar to the long-term velocities within four thresholds values (1.0, 0.5, 0.2, and 0.1 mm yr−1). This anal-ysis is performed by extending the analyzed data by time steps of 2 months, starting from both the beginning (forward) and end (backward) of the series. Figure 3 presents an exam-ple for station MTPL of velocity evolution as a function of the time-series length relative to the reference (full length) velocity. For this station, the short-term velocities can devi-ate from the full-length reference by 1 mm yr−1or more for series shorter than 3–4 years.
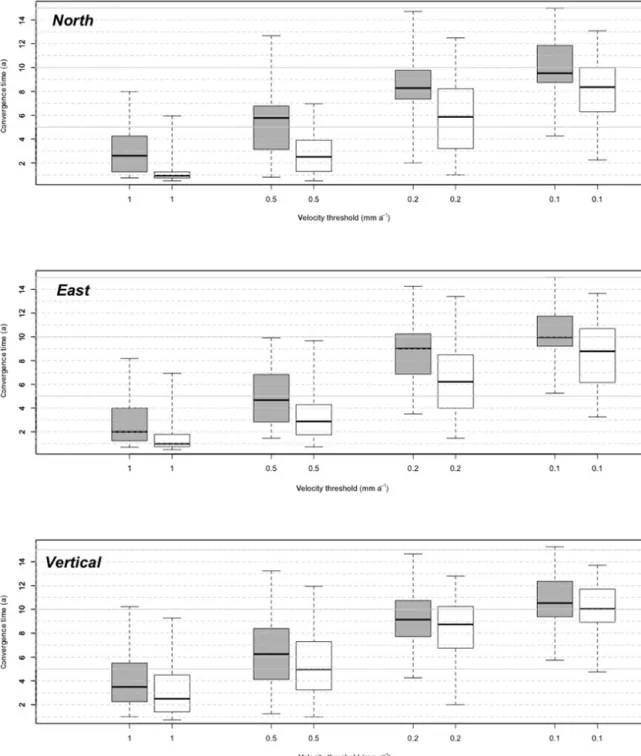
The results of this analysis for the 44 stations with data longer than 10 years are summarized in Fig. 4. Conver-gence times for the filtered data are systematically shorter (by about 1–2 years) compared to the original data due to the removal of long-period non-tectonic signals. For example, the minimum time-series lengths required to reach a stability
threshold of 0.5 mm yr−1in the horizontal components are
∼5 and ∼ 3 years for the original and filtered data, respec-tively. Similarly, the convergence time decreases from ∼ 6.5 to ∼ 5.5 years in the vertical component. Convergence times estimated for a 0.1 mm yr−1velocity threshold are probably a minimum as about half of the time series used for this esti-mation have a length approaching the convergence time.
Kierulf et al. (2013) performed a similar convergence anal-ysis for ∼ 140 GPS stations in Norway. They estimate vergence times of 3.0, 2.5, and 3.5 years for a velocity con-vergence threshold of 0.5 mm yr−1in the north, east, and ver-tical components, respectively. These estimations are similar to ours for the horizontal components and shorter by about 2 years for the vertical. This shorter convergence times may be due to (1) a rougher time step (6 months vs. 1 month) that limits their time resolution and (2) inclusion of short (< 10 years) time series in their statistics, which biases the convergence time estimations to shorter values. The effect of double-difference processing, intrinsically less noisy than our PPP solution, may also contribute to shorter convergence times.
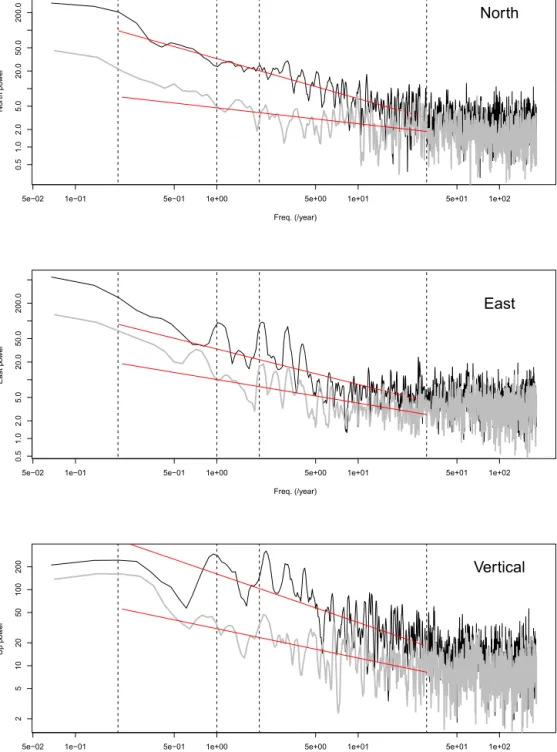
Because it removes a significant long-period noise com-ponent from the time series, the common-mode filter also has a strong impact on the estimation of velocity standard er-rors. The velocity uncertainty analysis (Sect. 3.1) performed on filtered data yields spectral indices significantly smaller (mean value α = −0.45 vs. α = −0.7 for the original data) and thus whiter spectra. This effect is illustrated in Fig. 5 on the spectra for station MTPL original and filtered data. A di-rect consequence of these whiter spectra is the reduction by a factor of ∼ 2 of the mean north, east, and vertical velocity standard errors compared to the original data (i.e., 0.2, 0.2, and 0.3 mm yr−1vs. 0.5, 0.4, and 0.7 mm yr−1for the unfil-tered data).
5 Velocity solution
On the basis of the analyses described above, we present a final GPS velocity field using the filtered data (Table 3). The velocities for 139 stations with time series longer than 5 years, which correspond to an average velocity precision
(convergence threshold) of ∼ 0.5 mm yr−1 or better and 1σ
horizontal velocity uncertainties smaller than 0.5 mm yr−1, are represented in Fig. 6. We define a regional reference frame by minimizing, through the estimation of an Euler vec-tor, the velocities of 61 sites over the whole network and with time series longer than 6 years (see Table 3). The mean
values of the residual velocities are 0.1 and 0.06 mm yr−1
for the north and east component, respectively. This result is in agreement with previous studies (e.g., Altamimi et al., 2011; Argus et al., 2010; Nocquet and Calais, 2003; Nocquet, 2012) and shows that horizontal deformation is very slow, in-cluding in the Western Alps and Pyrenees. The only site with a large velocity (> 2 mm yr−1) corresponds to a station of the foot of a landslide (CLAP, southwestern Alps).
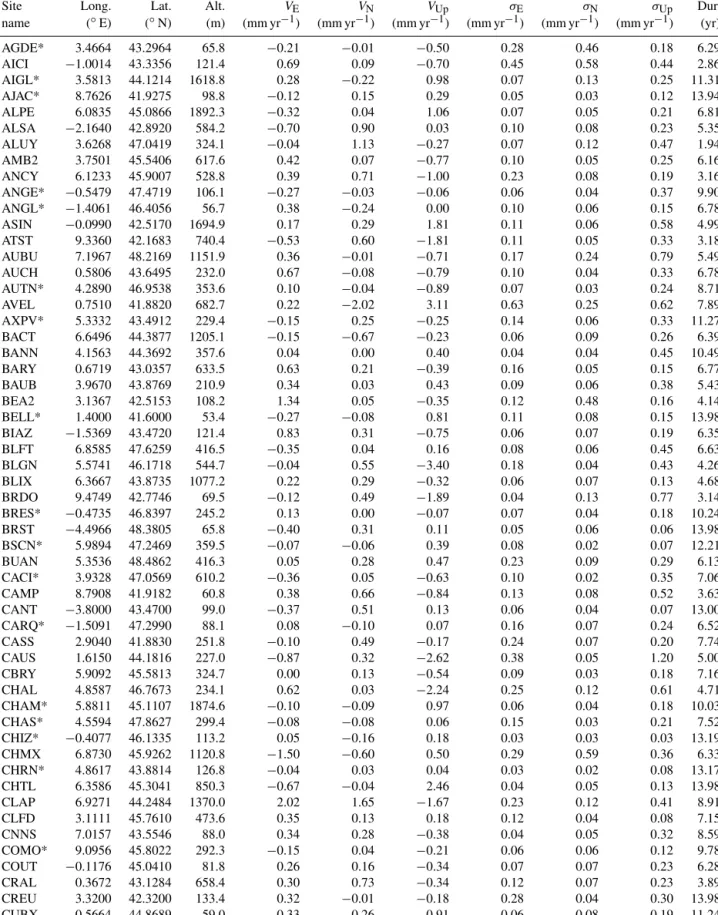
Table 3. Site locations and velocities in a regional (western Europe) reference frame as determined in this study by minimizing the velocities of the 61 sites indicated by an asterisk. East, north, and vertical GPS velocity components (VE, VN, VUp)and 1σ uncertainties (σE, σN, σUp) are given in mm yr−1. “Dur.” corresponds to the length of the time series.
Site Long. Lat. Alt. VE VN VUp σE σN σUp Dur. name (◦E) (◦N) (m) (mm yr−1) (mm yr−1) (mm yr−1) (mm yr−1) (mm yr−1) (mm yr−1) (yr) AGDE* 3.4664 43.2964 65.8 −0.21 −0.01 −0.50 0.28 0.46 0.18 6.29 AICI −1.0014 43.3356 121.4 0.69 0.09 −0.70 0.45 0.58 0.44 2.86 AIGL* 3.5813 44.1214 1618.8 0.28 −0.22 0.98 0.07 0.13 0.25 11.31 AJAC* 8.7626 41.9275 98.8 −0.12 0.15 0.29 0.05 0.03 0.12 13.94 ALPE 6.0835 45.0866 1892.3 −0.32 0.04 1.06 0.07 0.05 0.21 6.81 ALSA −2.1640 42.8920 584.2 −0.70 0.90 0.03 0.10 0.08 0.23 5.35 ALUY 3.6268 47.0419 324.1 −0.04 1.13 −0.27 0.07 0.12 0.47 1.94 AMB2 3.7501 45.5406 617.6 0.42 0.07 −0.77 0.10 0.05 0.25 6.16 ANCY 6.1233 45.9007 528.8 0.39 0.71 −1.00 0.23 0.08 0.19 3.16 ANGE* −0.5479 47.4719 106.1 −0.27 −0.03 −0.06 0.06 0.04 0.37 9.90 ANGL* −1.4061 46.4056 56.7 0.38 −0.24 0.00 0.10 0.06 0.15 6.78 ASIN −0.0990 42.5170 1694.9 0.17 0.29 1.81 0.11 0.06 0.58 4.99 ATST 9.3360 42.1683 740.4 −0.53 0.60 −1.81 0.11 0.05 0.33 3.18 AUBU 7.1967 48.2169 1151.9 0.36 −0.01 −0.71 0.17 0.24 0.79 5.49 AUCH 0.5806 43.6495 232.0 0.67 −0.08 −0.79 0.10 0.04 0.33 6.78 AUTN* 4.2890 46.9538 353.6 0.10 −0.04 −0.89 0.07 0.03 0.24 8.71 AVEL 0.7510 41.8820 682.7 0.22 −2.02 3.11 0.63 0.25 0.62 7.89 AXPV* 5.3332 43.4912 229.4 −0.15 0.25 −0.25 0.14 0.06 0.33 11.27 BACT 6.6496 44.3877 1205.1 −0.15 −0.67 −0.23 0.06 0.09 0.26 6.39 BANN 4.1563 44.3692 357.6 0.04 0.00 0.40 0.04 0.04 0.45 10.49 BARY 0.6719 43.0357 633.5 0.63 0.21 −0.39 0.16 0.05 0.15 6.77 BAUB 3.9670 43.8769 210.9 0.34 0.03 0.43 0.09 0.06 0.38 5.43 BEA2 3.1367 42.5153 108.2 1.34 0.05 −0.35 0.12 0.48 0.16 4.14 BELL* 1.4000 41.6000 53.4 −0.27 −0.08 0.81 0.11 0.08 0.15 13.98 BIAZ −1.5369 43.4720 121.4 0.83 0.31 −0.75 0.06 0.07 0.19 6.35 BLFT 6.8585 47.6259 416.5 −0.35 0.04 0.16 0.08 0.06 0.45 6.63 BLGN 5.5741 46.1718 544.7 −0.04 0.55 −3.40 0.18 0.04 0.43 4.26 BLIX 6.3667 43.8735 1077.2 0.22 0.29 −0.32 0.06 0.07 0.13 4.68 BRDO 9.4749 42.7746 69.5 −0.12 0.49 −1.89 0.04 0.13 0.77 3.14 BRES* −0.4735 46.8397 245.2 0.13 0.00 −0.07 0.07 0.04 0.18 10.24 BRST −4.4966 48.3805 65.8 −0.40 0.31 0.11 0.05 0.06 0.06 13.98 BSCN* 5.9894 47.2469 359.5 −0.07 −0.06 0.39 0.08 0.02 0.07 12.21 BUAN 5.3536 48.4862 416.3 0.05 0.28 0.47 0.23 0.09 0.29 6.13 CACI* 3.9328 47.0569 610.2 −0.36 0.05 −0.63 0.10 0.02 0.35 7.06 CAMP 8.7908 41.9182 60.8 0.38 0.66 −0.84 0.13 0.08 0.52 3.63 CANT −3.8000 43.4700 99.0 −0.37 0.51 0.13 0.06 0.04 0.07 13.00 CARQ* −1.5091 47.2990 88.1 0.08 −0.10 0.07 0.16 0.07 0.24 6.52 CASS 2.9040 41.8830 251.8 −0.10 0.49 −0.17 0.24 0.07 0.20 7.74 CAUS 1.6150 44.1816 227.0 −0.87 0.32 −2.62 0.38 0.05 1.20 5.00 CBRY 5.9092 45.5813 324.7 0.00 0.13 −0.54 0.09 0.03 0.18 7.16 CHAL 4.8587 46.7673 234.1 0.62 0.03 −2.24 0.25 0.12 0.61 4.71 CHAM* 5.8811 45.1107 1874.6 −0.10 −0.09 0.97 0.06 0.04 0.18 10.03 CHAS* 4.5594 47.8627 299.4 −0.08 −0.08 0.06 0.15 0.03 0.21 7.52 CHIZ* −0.4077 46.1335 113.2 0.05 −0.16 0.18 0.03 0.03 0.03 13.19 CHMX 6.8730 45.9262 1120.8 −1.50 −0.60 0.50 0.29 0.59 0.36 6.33 CHRN* 4.8617 43.8814 126.8 −0.04 0.03 0.04 0.03 0.02 0.08 13.17 CHTL 6.3586 45.3041 850.3 −0.67 −0.04 2.46 0.04 0.05 0.13 13.98 CLAP 6.9271 44.2484 1370.0 2.02 1.65 −1.67 0.23 0.12 0.41 8.91 CLFD 3.1111 45.7610 473.6 0.35 0.13 0.18 0.12 0.04 0.08 7.15 CNNS 7.0157 43.5546 88.0 0.34 0.28 −0.38 0.04 0.05 0.32 8.59 COMO* 9.0956 45.8022 292.3 −0.15 0.04 −0.21 0.06 0.06 0.12 9.78 COUT −0.1176 45.0410 81.8 0.26 0.16 −0.34 0.07 0.07 0.23 6.28 CRAL 0.3672 43.1284 658.4 0.30 0.73 −0.34 0.12 0.07 0.23 3.89 CREU 3.3200 42.3200 133.4 0.32 −0.01 −0.18 0.28 0.04 0.30 13.98 CUBX −0.5664 44.8689 59.0 −0.33 −0.26 −0.91 0.06 0.08 0.19 11.24
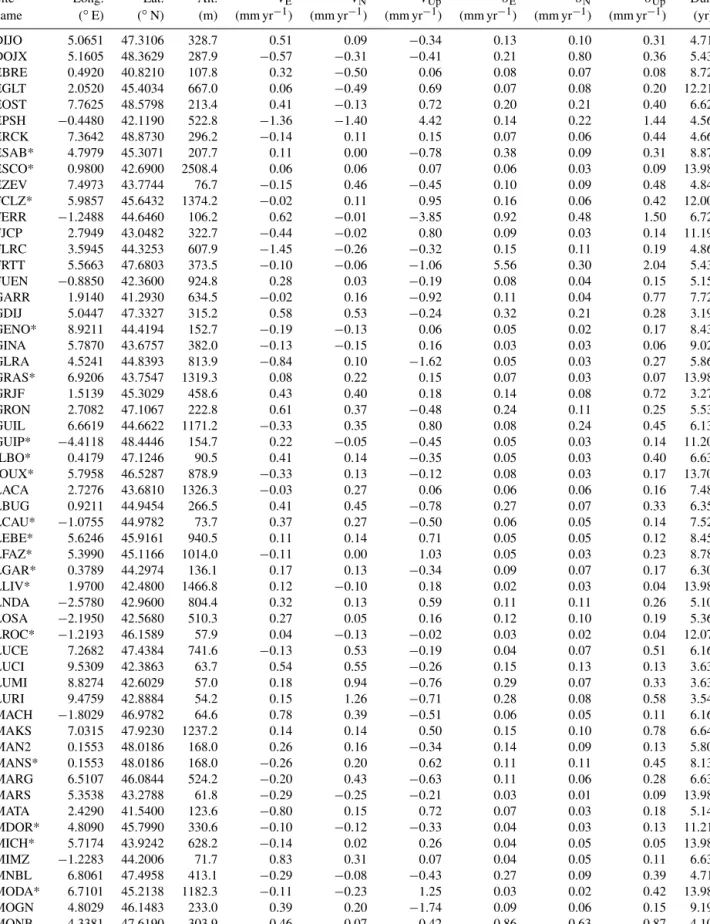
Table 3. Continued.
Site Long. Lat. Alt. VE VN VUp σE σN σUp Dur. name (◦E) (◦N) (m) (mm yr−1) (mm yr−1) (mm yr−1) (mm yr−1) (mm yr−1) (mm yr−1) (yr) DIJO 5.0651 47.3106 328.7 0.51 0.09 −0.34 0.13 0.10 0.31 4.71 DOJX 5.1605 48.3629 287.9 −0.57 −0.31 −0.41 0.21 0.80 0.36 5.43 EBRE 0.4920 40.8210 107.8 0.32 −0.50 0.06 0.08 0.07 0.08 8.72 EGLT 2.0520 45.4034 667.0 0.06 −0.49 0.69 0.07 0.08 0.20 12.21 EOST 7.7625 48.5798 213.4 0.41 −0.13 0.72 0.20 0.21 0.40 6.62 EPSH −0.4480 42.1190 522.8 −1.36 −1.40 4.42 0.14 0.22 1.44 4.56 ERCK 7.3642 48.8730 296.2 −0.14 0.11 0.15 0.07 0.06 0.44 4.66 ESAB* 4.7979 45.3071 207.7 0.11 0.00 −0.78 0.38 0.09 0.31 8.87 ESCO* 0.9800 42.6900 2508.4 0.06 0.06 0.07 0.06 0.03 0.09 13.98 EZEV 7.4973 43.7744 76.7 −0.15 0.46 −0.45 0.10 0.09 0.48 4.84 FCLZ* 5.9857 45.6432 1374.2 −0.02 0.11 0.95 0.16 0.06 0.42 12.00 FERR −1.2488 44.6460 106.2 0.62 −0.01 −3.85 0.92 0.48 1.50 6.72 FJCP 2.7949 43.0482 322.7 −0.44 −0.02 0.80 0.09 0.03 0.14 11.19 FLRC 3.5945 44.3253 607.9 −1.45 −0.26 −0.32 0.15 0.11 0.19 4.86 FRTT 5.5663 47.6803 373.5 −0.10 −0.06 −1.06 5.56 0.30 2.04 5.43 FUEN −0.8850 42.3600 924.8 0.28 0.03 −0.19 0.08 0.04 0.15 5.15 GARR 1.9140 41.2930 634.5 −0.02 0.16 −0.92 0.11 0.04 0.77 7.72 GDIJ 5.0447 47.3327 315.2 0.58 0.53 −0.24 0.32 0.21 0.28 3.19 GENO* 8.9211 44.4194 152.7 −0.19 −0.13 0.06 0.05 0.02 0.17 8.43 GINA 5.7870 43.6757 382.0 −0.13 −0.15 0.16 0.03 0.03 0.06 9.02 GLRA 4.5241 44.8393 813.9 −0.84 0.10 −1.62 0.05 0.03 0.27 5.86 GRAS* 6.9206 43.7547 1319.3 0.08 0.22 0.15 0.07 0.03 0.07 13.98 GRJF 1.5139 45.3029 458.6 0.43 0.40 0.18 0.14 0.08 0.72 3.27 GRON 2.7082 47.1067 222.8 0.61 0.37 −0.48 0.24 0.11 0.25 5.53 GUIL 6.6619 44.6622 1171.2 −0.33 0.35 0.80 0.08 0.24 0.45 6.13 GUIP* −4.4118 48.4446 154.7 0.22 −0.05 −0.45 0.05 0.03 0.14 11.20 ILBO* 0.4179 47.1246 90.5 0.41 0.14 −0.35 0.05 0.03 0.40 6.63 JOUX* 5.7958 46.5287 878.9 −0.33 0.13 −0.12 0.08 0.03 0.17 13.70 LACA 2.7276 43.6810 1326.3 −0.03 0.27 0.06 0.06 0.06 0.16 7.48 LBUG 0.9211 44.9454 266.5 0.41 0.45 −0.78 0.27 0.07 0.33 6.35 LCAU* −1.0755 44.9782 73.7 0.37 0.27 −0.50 0.06 0.05 0.14 7.52 LEBE* 5.6246 45.9161 940.5 0.11 0.14 0.71 0.05 0.05 0.12 8.45 LFAZ* 5.3990 45.1166 1014.0 −0.11 0.00 1.03 0.05 0.03 0.23 8.78 LGAR* 0.3789 44.2974 136.1 0.17 0.13 −0.34 0.09 0.07 0.17 6.30 LLIV* 1.9700 42.4800 1466.8 0.12 −0.10 0.18 0.02 0.03 0.04 13.98 LNDA −2.5780 42.9600 804.4 0.32 0.13 0.59 0.11 0.11 0.26 5.10 LOSA −2.1950 42.5680 510.3 0.27 0.05 0.16 0.12 0.10 0.19 5.36 LROC* −1.2193 46.1589 57.9 0.04 −0.13 −0.02 0.03 0.02 0.04 12.07 LUCE 7.2682 47.4384 741.6 −0.13 0.53 −0.19 0.04 0.07 0.51 6.16 LUCI 9.5309 42.3863 63.7 0.54 0.55 −0.26 0.15 0.13 0.13 3.63 LUMI 8.8274 42.6029 57.0 0.18 0.94 −0.76 0.29 0.07 0.33 3.63 LURI 9.4759 42.8884 54.2 0.15 1.26 −0.71 0.28 0.08 0.58 3.54 MACH −1.8029 46.9782 64.6 0.78 0.39 −0.51 0.06 0.05 0.11 6.16 MAKS 7.0315 47.9230 1237.2 0.14 0.14 0.50 0.15 0.10 0.78 6.64 MAN2 0.1553 48.0186 168.0 0.26 0.16 −0.34 0.14 0.09 0.13 5.80 MANS* 0.1553 48.0186 168.0 −0.26 0.20 0.62 0.11 0.11 0.45 8.13 MARG 6.5107 46.0844 524.2 −0.20 0.43 −0.63 0.11 0.06 0.28 6.63 MARS 5.3538 43.2788 61.8 −0.29 −0.25 −0.21 0.03 0.01 0.09 13.98 MATA 2.4290 41.5400 123.6 −0.80 0.15 0.72 0.07 0.03 0.18 5.14 MDOR* 4.8090 45.7990 330.6 −0.10 −0.12 −0.33 0.04 0.03 0.13 11.21 MICH* 5.7174 43.9242 628.2 −0.14 0.02 0.26 0.04 0.05 0.05 13.98 MIMZ −1.2283 44.2006 71.7 0.83 0.31 0.07 0.04 0.05 0.11 6.63 MNBL 6.8061 47.4958 413.1 −0.29 −0.08 −0.43 0.27 0.09 0.39 4.71 MODA* 6.7101 45.2138 1182.3 −0.11 −0.23 1.25 0.03 0.02 0.42 13.98 MOGN 4.8029 46.1483 233.0 0.39 0.20 −1.74 0.09 0.06 0.15 9.19 MONB 4.3381 47.6190 303.9 0.46 −0.07 −0.42 0.86 0.63 0.87 4.10
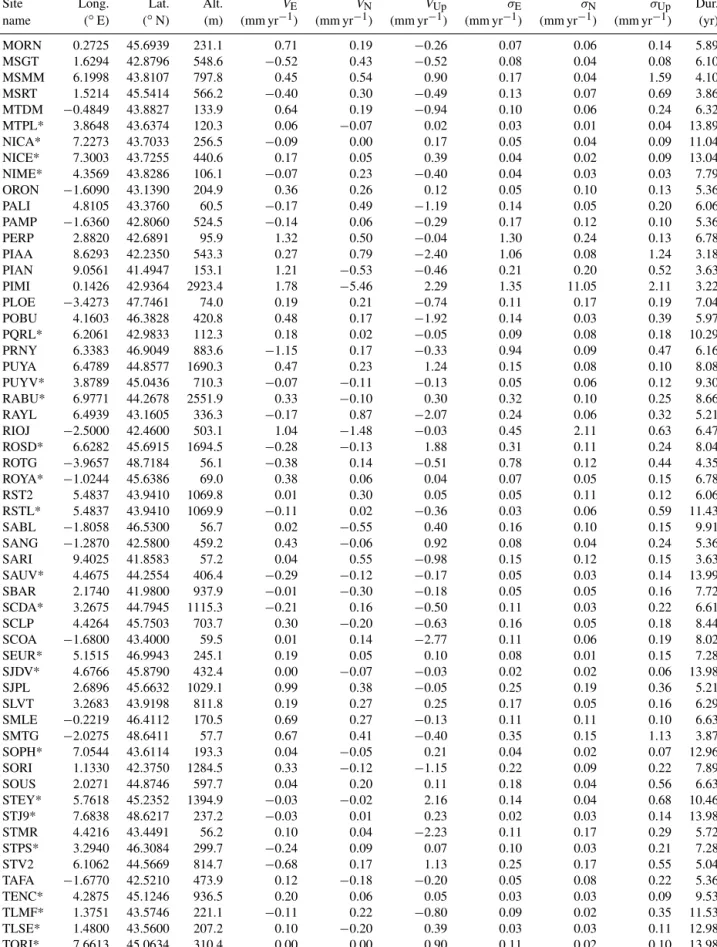
Table 3. Continued.
Site Long. Lat. Alt. VE VN VUp σE σN σUp Dur. name (◦E) (◦N) (m) (mm yr−1) (mm yr−1) (mm yr−1) (mm yr−1) (mm yr−1) (mm yr−1) (yr) MORN 0.2725 45.6939 231.1 0.71 0.19 −0.26 0.07 0.06 0.14 5.89 MSGT 1.6294 42.8796 548.6 −0.52 0.43 −0.52 0.08 0.04 0.08 6.10 MSMM 6.1998 43.8107 797.8 0.45 0.54 0.90 0.17 0.04 1.59 4.10 MSRT 1.5214 45.5414 566.2 −0.40 0.30 −0.49 0.13 0.07 0.69 3.86 MTDM −0.4849 43.8827 133.9 0.64 0.19 −0.94 0.10 0.06 0.24 6.32 MTPL* 3.8648 43.6374 120.3 0.06 −0.07 0.02 0.03 0.01 0.04 13.89 NICA* 7.2273 43.7033 256.5 −0.09 0.00 0.17 0.05 0.04 0.09 11.04 NICE* 7.3003 43.7255 440.6 0.17 0.05 0.39 0.04 0.02 0.09 13.04 NIME* 4.3569 43.8286 106.1 −0.07 0.23 −0.40 0.04 0.03 0.03 7.79 ORON −1.6090 43.1390 204.9 0.36 0.26 0.12 0.05 0.10 0.13 5.36 PALI 4.8105 43.3760 60.5 −0.17 0.49 −1.19 0.14 0.05 0.20 6.06 PAMP −1.6360 42.8060 524.5 −0.14 0.06 −0.29 0.17 0.12 0.10 5.36 PERP 2.8820 42.6891 95.9 1.32 0.50 −0.04 1.30 0.24 0.13 6.78 PIAA 8.6293 42.2350 543.3 0.27 0.79 −2.40 1.06 0.08 1.24 3.18 PIAN 9.0561 41.4947 153.1 1.21 −0.53 −0.46 0.21 0.20 0.52 3.63 PIMI 0.1426 42.9364 2923.4 1.78 −5.46 2.29 1.35 11.05 2.11 3.22 PLOE −3.4273 47.7461 74.0 0.19 0.21 −0.74 0.11 0.17 0.19 7.04 POBU 4.1603 46.3828 420.8 0.48 0.17 −1.92 0.14 0.03 0.39 5.97 PQRL* 6.2061 42.9833 112.3 0.18 0.02 −0.05 0.09 0.08 0.18 10.29 PRNY 6.3383 46.9049 883.6 −1.15 0.17 −0.33 0.94 0.09 0.47 6.16 PUYA 6.4789 44.8577 1690.3 0.47 0.23 1.24 0.15 0.08 0.10 8.08 PUYV* 3.8789 45.0436 710.3 −0.07 −0.11 −0.13 0.05 0.06 0.12 9.30 RABU* 6.9771 44.2678 2551.9 0.33 −0.10 0.30 0.32 0.10 0.25 8.66 RAYL 6.4939 43.1605 336.3 −0.17 0.87 −2.07 0.24 0.06 0.32 5.21 RIOJ −2.5000 42.4600 503.1 1.04 −1.48 −0.03 0.45 2.11 0.63 6.47 ROSD* 6.6282 45.6915 1694.5 −0.28 −0.13 1.88 0.31 0.11 0.24 8.04 ROTG −3.9657 48.7184 56.1 −0.38 0.14 −0.51 0.78 0.12 0.44 4.35 ROYA* −1.0244 45.6386 69.0 0.38 0.06 0.04 0.07 0.05 0.15 6.78 RST2 5.4837 43.9410 1069.8 0.01 0.30 0.05 0.05 0.11 0.12 6.06 RSTL* 5.4837 43.9410 1069.9 −0.11 0.02 −0.36 0.03 0.06 0.59 11.43 SABL −1.8058 46.5300 56.7 0.02 −0.55 0.40 0.16 0.10 0.15 9.91 SANG −1.2870 42.5800 459.2 0.43 −0.06 0.92 0.08 0.04 0.24 5.36 SARI 9.4025 41.8583 57.2 0.04 0.55 −0.98 0.15 0.12 0.15 3.63 SAUV* 4.4675 44.2554 406.4 −0.29 −0.12 −0.17 0.05 0.03 0.14 13.99 SBAR 2.1740 41.9800 937.9 −0.01 −0.30 −0.18 0.05 0.05 0.16 7.72 SCDA* 3.2675 44.7945 1115.3 −0.21 0.16 −0.50 0.11 0.03 0.22 6.61 SCLP 4.4264 45.7503 703.7 0.30 −0.20 −0.63 0.16 0.05 0.18 8.44 SCOA −1.6800 43.4000 59.5 0.01 0.14 −2.77 0.11 0.06 0.19 8.02 SEUR* 5.1515 46.9943 245.1 0.19 0.05 0.10 0.08 0.01 0.15 7.28 SJDV* 4.6766 45.8790 432.4 0.00 −0.07 −0.03 0.02 0.02 0.06 13.98 SJPL 2.6896 45.6632 1029.1 0.99 0.38 −0.05 0.25 0.19 0.36 5.21 SLVT 3.2683 43.9198 811.8 0.19 0.27 0.25 0.17 0.05 0.16 6.29 SMLE −0.2219 46.4112 170.5 0.69 0.27 −0.13 0.11 0.11 0.10 6.63 SMTG −2.0275 48.6411 57.7 0.67 0.41 −0.40 0.35 0.15 1.13 3.87 SOPH* 7.0544 43.6114 193.3 0.04 −0.05 0.21 0.04 0.02 0.07 12.96 SORI 1.1330 42.3750 1284.5 0.33 −0.12 −1.15 0.22 0.09 0.22 7.89 SOUS 2.0271 44.8746 597.7 0.04 0.20 0.11 0.18 0.04 0.56 6.63 STEY* 5.7618 45.2352 1394.9 −0.03 −0.02 2.16 0.14 0.04 0.68 10.46 STJ9* 7.6838 48.6217 237.2 −0.03 0.01 0.23 0.02 0.03 0.14 13.98 STMR 4.4216 43.4491 56.2 0.10 0.04 −2.23 0.11 0.17 0.29 5.72 STPS* 3.2940 46.3084 299.7 −0.24 0.09 0.07 0.10 0.03 0.21 7.28 STV2 6.1062 44.5669 814.7 −0.68 0.17 1.13 0.25 0.17 0.55 5.04 TAFA −1.6770 42.5210 473.9 0.12 −0.18 −0.20 0.05 0.08 0.22 5.36 TENC* 4.2875 45.1246 936.5 0.20 0.06 0.05 0.03 0.03 0.09 9.53 TLMF* 1.3751 43.5746 221.1 −0.11 0.22 −0.80 0.09 0.02 0.35 11.53 TLSE* 1.4800 43.5600 207.2 0.10 −0.20 0.39 0.03 0.03 0.11 12.98 TORI* 7.6613 45.0634 310.4 0.00 0.00 0.90 0.11 0.02 0.10 13.98
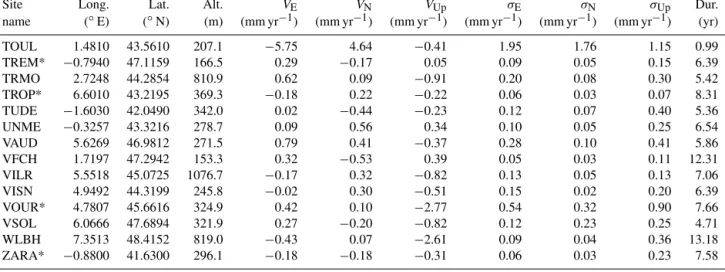
Table 3. Continued.
Site Long. Lat. Alt. VE VN VUp σE σN σUp Dur. name (◦E) (◦N) (m) (mm yr−1) (mm yr−1) (mm yr−1) (mm yr−1) (mm yr−1) (mm yr−1) (yr) TOUL 1.4810 43.5610 207.1 −5.75 4.64 −0.41 1.95 1.76 1.15 0.99 TREM* −0.7940 47.1159 166.5 0.29 −0.17 0.05 0.09 0.05 0.15 6.39 TRMO 2.7248 44.2854 810.9 0.62 0.09 −0.91 0.20 0.08 0.30 5.42 TROP* 6.6010 43.2195 369.3 −0.18 0.22 −0.22 0.06 0.03 0.07 8.31 TUDE −1.6030 42.0490 342.0 0.02 −0.44 −0.23 0.12 0.07 0.40 5.36 UNME −0.3257 43.3216 278.7 0.09 0.56 0.34 0.10 0.05 0.25 6.54 VAUD 5.6269 46.9812 271.5 0.79 0.41 −0.37 0.28 0.10 0.41 5.86 VFCH 1.7197 47.2942 153.3 0.32 −0.53 0.39 0.05 0.03 0.11 12.31 VILR 5.5518 45.0725 1076.7 −0.17 0.32 −0.82 0.13 0.05 0.13 7.06 VISN 4.9492 44.3199 245.8 −0.02 0.30 −0.51 0.15 0.02 0.20 6.39 VOUR* 4.7807 45.6616 324.9 0.42 0.10 −2.77 0.54 0.32 0.90 7.66 VSOL 6.0666 47.6894 321.9 0.27 −0.20 −0.82 0.12 0.23 0.25 4.71 WLBH 7.3513 48.4152 819.0 −0.43 0.07 −2.61 0.09 0.04 0.36 13.18 ZARA* −0.8800 41.6300 296.1 −0.18 −0.18 −0.31 0.06 0.03 0.23 7.58
Figure 7 shows the dispersion of the east and north com-ponents of the residual velocities. The 65 sites with time series longer than 8 years, horizontal velocities are lower
than 0.7 mm yr−1 (except CLAP) and the weighted
root-mean-square (WRMS) dispersion is 0.18 mm yr−1. For
sta-tions with longer time series of more than 10 or 12 years, the
WRMS are similar (0.17 and 0.18 mm yr−1, respectively).
This stability of the dispersion for stations over 8 years raises the question of whether these velocities represent a long-term motion of the sites or if we are reaching the threshold of the GPS horizontal velocity accuracy.
Deformation patterns associated with our velocity field are estimated by running an interpolation and smoothing func-tion through the 3-D velocity data. Horizontal strain rates
are calculated on a regular 0.5 × 0.5◦ grid using a
Gaus-sian interpolation function with a 75 km half-width and tak-ing into account each GPS sites uncertainty (cf., Mazzotti et al., 2011). The horizontal strain rate field (Fig. 8) shows no significant strain rates above ∼ 1 × 10⁻⁹yr−1, except in the western Pyrenees where north–south to northeast–southwest extension is observed up to ∼ 4 × 10⁻⁹yr−1, above the for-mal uncertainty level. This strain rate pattern is consistent with that derived from shorter time series of the Spanish continuous sites (Asensio et al., 2012) and campaign GPS data in the Pyrenees, where Rigo et al. (2015) estimate
a north–south extension of ∼ 2 × 10⁻⁹yr−1 in the
west-ern region but no significant strain in the central and east-ern regions. In contrast, our estimation of non-significant strain rates (< 1 × 10⁻⁹yr−1)in the Western Alps does not agree with campaign GPS results in the Briançon region
where east–west extension rates of (16 ± 11) × 10−9yr−1
are estimated (Walpersdorf et al., 2015). This disagreement may be due to the high spatial wavelength of our solution (∼ 100 km or more), whereas campaign data from Walpers-dorf et al. (2015) sample a much smaller area (∼ 30 km), and to the fact that we have less sites in Italy in our solution.
The main feature of the vertical velocities (Fig. 9) is the zone of uplift (up to ∼ 2.0 mm yr−1) observed in the north-central region of the Western Alps. This pattern of uplift is clearly limited to the region north of about 44.5◦N, whereas the southern French Alps and the foreland regions of the Rhone Valley and the French Jura show no vertical mo-tion within ± 0.5 mm yr−1. Our results are consistent with the uplift pattern identified by Serpelloni et al. (2013) in the Western Alps (average difference at common sites of 0.05 ± 0.79 mm yr−1), although the higher station density in our solution allows a sharper definition of region affected by significant uplift. In contrast, no significant vertical pattern can be observed in the Pyrenees, where most stations show vertical velocities about ± 0.5 mm yr−1.
Stations in the northern region of the Western Alps show a first-order correlation between uplift rates and topography (Fig. 10), with highest uplift rates (> 1.0 mm yr−1) limited to stations located above ∼ 1000 m altitude. This is consistent with GPS and leveling results in the Swiss Alps where the
most elevated region displays uplift rates up to 2 mm yr−1
(Brockmann et al., 2012). Although this correlation seems straightforward, it is not the altitude of the GPS site that mat-ters but rather the mean elevation of the mountains surround-ing the site. In other words a GPS site in a valley located in the highest part of the western Alps should have a high uplift rate even if it is located at low elevation. Because GPS sta-tions are commonly located on ridges rather than in valleys, station elevations are a good proxy for the mean elevation of the surrounding area. To check this later assumption, we have filtered the topography by averaging it over 10 × 10 km windows and the correlation is consistent with the results presented in Fig. 10. In the Western Alps, the southern part shows no evidences of significant uplift (∼ 0 mm yr−1), in contrast to the northern part of the Western Alps, where the uplift rates are the highest (1–2 mm yr−1) for the same eleva-tion range. To first order these uplift rates seems correlated to
Figure 4. Whisker plots of convergence time for four velocity thresholds (1.0, 0.5, 0.2, and 0.1 mm yr−1). Thick bars, boxes, and dashed bars represent the median, quartile (25 and 75 %) and extreme values of the distributions for the 44 stations with at least 10 years of data. Grey and white whisker plots correspond to unfiltered (raw) and filtered (with common-mode correction) data.
the Würmian ice cap that was thicker in the northern part of the Western Alps (Stocchi et al., 2005) and can be modeled according to Chéry et al. (2016).
Stations in the Pyrenees show no such correlation, in par-ticular for the sites with the longest time series and above an elevation of 1500 m, which show vertical velocities of
∼0.1 ± 0.2 mm yr−1 (Figs. 9 and 10). This very low uplift
rate is in agreement with an erosion-induced deformation in the Pyrenees (Genti et al., 2015). Figure 10 shows no corre-lation between vertical velocities and time-series lengths for the Western Alps or the Pyrenees, but it clearly shows the Pyrenees’s lack of continuous GPS sites at mid- to high ele-vations.
5e−02 1e−01 5e−01 1e+00 5e+00 1e+01 5e+01 1e+02 0.5 1.0 2.0 5.0 20.0 50.0 200.0 Freq. (/year) Nor th po w er North
5e−02 1e−01 5e−01 1e+00 5e+00 1e+01 5e+01 1e+02
0.5 1.0 2.0 5.0 20.0 50.0 200.0 Freq. (/year) East p ow er East
5e−02 1e−01 5e−01 1e+00 5e+00 1e+01 5e+01 1e+02
2 5 10 20 50 100 200 Freq. (/year) Up p ow er Vertical
Figure 5. Noise spectra for site MTPL. Spectra derived form the unfiltered time series are in black, those for the filtered time series are in grey. The red lines represent the best spectral models used for the uncertainty analyses.
The dispersion of the horizontal velocities (Fig. 7) and vertical velocity vs. altitude correlation (Fig. 10) shows that we can resolve sub-millimeter horizontal and vertical veloc-ities in the Alps and the Pyrenees. Furthermore, the indepen-dent result obtained with leveling in the Western Alps (Noc-quet et al., 2016) shows that the uplift motion on the order of 1 mm yr−1is significant. Strain rate computation (Fig. 8)
suggests consistent patterns such as E–W extension in the
Western Alps. However, these rates (∼ 1 × 10⁻⁹yr−1) are
not significant and only denser networks with careful anal-ysis of local coherent patterns will tell us whether this pat-tern is true or not. Combining the continuous and survey GNSS networks in a single homogeneous reprocessing could achieve this.
Figure 6. Horizontal velocities for stations with time series longer than 5 years in a regional (western Europe) reference frame.
Figure 7. East vs. north components of the residuals relative to a regional reference, color-coded based on the time-series lengths.
To the question “Are the Alps collapsing?” (Selverstone, 2005), we can answer “not in the sense of a post-orogenic collapse of the mountain range”. Indeed, our GPS veloci-ties show no significant (< 0.2 mm yr−1) horizontal outward flowing of the Western Alps. However, significant uplift of the northern part of the Western Alps is clearly observed.
Figure 8. Smoothed horizontal strain rate field for the Western Alps and Pyrenees region. Dashed lines are strain rate standard error. Light grey curves show the drainage pattern and dark grey curves the seashores and country borders.
Figure 9. Vertical velocities for stations with time series longer than 5 years in the IGS08 reference frame (see Table 3 for the site list).
These vertical velocities seem correlated to the Würmian ice cap thickness and suggest that part of the present-day uplift is related to postglacial rebound. Models of glacial isotactic rebound for the Alps suggest either a low amplitude and a large wavelength (Stocchi et al., 2005) or a very localized uplift due to the Little Ice Age glacier shrinkage (Barletta et al., 2006); both models are not consistent with the GPS observations that suggest a short wavelength and a large am-plitude of the uplift. The drawback of these models is that
Figure 10. Vertical velocities, color-coded based on the time-series length, vs. site elevations for stations located in the Western Alps and the Pyrenees.
they consider a 1-D-layered lithosphere, which is probably far from the truth given the geological history of the region. An evidence for a more complicated lithosphere is given by the seismicity below Switzerland where the earthquake max-imum depth vary from ∼ 30 km in the foreland to ∼ 15 km below the range (Deichmann, 2003). This suggests a wedge of softer material in the lower crust below the Alps (Chéry et al., 2016), in some way similar to the Andes of Patago-nia where a localized uplift due to glacier mass changes is modeled based on a wedge of softer material in the continen-tal lithosphere (Klemann et al., 2007). This does not exclude contributions from deep processes for part of the uplift (Fox et al., 2015) or erosion-induced rebound (Champagnac et al., 2007; Genti et al., 2015; Vernant et al., 2013). A careful and detailed model of the response to the Last Glacial Maximum of the Pyrenees and the Alps will certainly bring valuable new insights on post-orogenic mountain processes.
6 Conclusions
Our new GPS velocity solution based on 182 sites for the region encompassing the Western Alps, the Pyrenees, and southern France leads to four main conclusions:
1. These areas can be associated with as a stable region,
within a dispersion (WRMS) of ∼ 0.2 mm yr−1 on the
horizontal velocities. However, even with this low dis-persion, horizontal velocities, without a regional coher-ence, can still reach up to 0.7 mm yr−1, raising the ques-tion of the significance of these velocities: are there lo-cal processes explaining these residuals or do they rep-resent a bias in our uncertainty estimates?
2. Significant horizontal strain rates up to 4 × 10⁻⁹yr−1 of NNE–SSW extension are evidenced in the Western Pyrenees, but none are seen in the Western Alps (i.e., < 1 × 10⁻⁹yr−1).
3. In contrast, significant uplift rates up to 2 mm yr−1are observed in the Western Alps but not in the Pyrenees where they are close to 0.1 ± 0.2 mm yr−1.
4. These significant uplift rates are observed in the north-ern part of the Westnorth-ern Alps. They are correlated to the mean elevation of the region surrounding the GPS sites, but this correlation is not true for the Pyrenees or the southern part of the Western Alps.
The observations of uplift rates, and lack of significant hor-izontal motion in the northern Western Alps, are correlated with the Würmian ice cap thickness and tend to suggest that a large part of this uplift is induced by postglacial rebound from the Last Glacial Maximum associated with a wedge of softer material in the continental lithosphere below the West-ern Alps. Unfortunately, the GPS network is too sparse to characterize uplift in the Pyrenees, where we see significant horizontal strain rates. With a few more sites in this region we will be able, with a careful comparison between the Pyre-nees, the southern and northern regions of the Western Alps, to decipher the role of erosion, glacier mass changes, and deep processes in the present-day uplift rates of this moun-tain ranges.
7 Data availability
We thank Natural Resources Canada for providing the CCRS-PPP software. Time-series analysis was done with the R statistical software (http://www.r-project.org). GPS data used in this study were extracted from the following archives: RENAG (http://renag.resif.fr), IGS (http://www.igs.org), EUREF (http://www.epncb.oma.be), RGP (http://rgp.ign.fr),
Topo-Iberia (http://www.igme.es/TopoIberia/default.html),
RGAN (http://www.navarra.es/appsext/rgan/default.aspx),
EPSH (http://epsh.unizar.es/~serreta/huescagps.html), and CATNET (http://catnet-ip.icc.cat).
Acknowledgements. We thank E. Brockmann and two anonymous reviewers for their helpful reviews. This work was supported by the Centre National de la Recherche Scientifique (CNRS–INSU),
Languedoc-Roussillon Regional Authority (grant Chercheurs d’Avenir to P. Vernant), and the REseau SIsmologique & géodésique Français (RESIF). We thank all the people involved in the GPS site maintenance and data distribution for the stations used in this study.
Edited by: S. McClusky
Reviewed by: E. Brockmann and two anonymous referees
References
Agnew, D. C.: The time-domain behaviour of power-law noises, Geophys. Res. Lett., 19, 333–336, 1992.
Alasset, P.-J. and Meghraoui, M.: Active faulting in the western Pyrénées (France): Paleoseismic evidence for late Holocene ruptures, Tectonophysics, 409, 39–54, doi:10.1016/j.tecto.2005.08.019, 2005.
Altamimi, Z., Collilieux, X., and Métivier, L.: ITRF2008: an im-proved solution of the international terrestrial reference frame, J. Geodesy., 85, 457–473, doi:10.1007/s00190-011-0444-4, 2011. Argus, D. F., Gordon, R. G., Heflin, M. B., Ma, C., Eanes, R. J.,
Willis, P., Peltier, W. R., and Owen, S. E.: The angular veloci-ties of the plates and the velocity of Earth’s centre from space geodesy, Geophys. J. Int., 180, 913–960, doi:10.1111/j.1365-246X.2009.04463.x, 2010.
Argus, D. F., Peltier, W. R., and Watkins, M. M.: Glacial isostatic adjustment observed using very long baseline interferometry and satellite laser ranging geodesy, J. Geophys. Res., 104, 29077– 29093, 1999.
Asensio, E., Khazaradze, G., Echeverria, A., King, R. W., and Vilajosana, I.: GPS studies of active deformation in the Pyre-nees, Geophys. J. Int., 190, 913–921, doi:10.1111/j.1365-246X.2012.05525.x, 2012.
Barletta, V. R., Ferrari, C., Diolaiuti, G., Carnielli, T., Saba-dini, R., and Smiraglia, C.: Glacier shrinkage and mod-eled uplift of the Alps, Geophys. Res. Lett., 33, L14307, doi:10.1029/2006GL026490, 2006.
Blewitt, G. and Lavallée, D.: Effect of annual signals on geodetic velocity, J. Geophys. Res., 107, ETG_9-1–ETG_9-11, 2002. Boehm, J., Werl, B., and Schuh, H.: Troposphere mapping
func-tions for GPS and very long baseline interferometry from Eu-ropean Centre for Medium-Range Weather Forecasts opera-tional analysis data, J. Geophys. Res.-Sol. Ea., 111, B02406, doi:10.1029/2005JB003629, 2006.
Brockmann, E., Ineichen, D., Marti, U., Schaer, S., and Schlatter, A.: Determination of Tectonic Movements in the Swiss Alps us-ing GNSS and Levellus-ing, in: Geodesy for planet Earth: Interna-tional Association of Geodesy Symposia, edited by: Kenyon, S., Pacino, M. C., and Marti, U., 136, 689–695, 2012.
Champagnac, J. D., Molnar, P., Anderson, R. S., Sue, C., and Dela-cou, B.: Quaternary erosion-induced isostatic rebound in the western Alps, Geology, 35, 195–198, doi:10.1130/g23053a.1, 2007.
Chardon, D., Hermitte, D., Nguyen, F., and Bellier, O.: First pale-oseismological constraints on the strongest earthquake in France (Provence) in the twentieth century, Geology, 33, 901–904, doi:10.1130/G21713.1, 2005.
Chéry, J., Genti, M., and Vernant, P.: Ice cap melting and low-viscosity crustal root explain the narrow geodetic up-lift of the Western Alps, Geophys. Res. Lett., 43, 1–8, doi:10.1002/2016GL067821, 2016.
Chevrot, S., Sylvander, M., and Delouis, B.: A preliminary catalog of moment tensors for the Pyrenees, Tectonophysics, 510, 239– 251, doi:10.1016/j.tecto.2011.07.011, 2011.
Collilieux, X., Altamimi, Z., Métivier, L., and van Dam, T.: Qual-ity assessment of GPS reprocessed Terrestrial Reference Frame, Amer. Geophys. Union Fall Meeting, San Francisco, 2009. Deichmann, N.: Focal depths of earthquakes below Switzerland,
Swiss Seismol Service ETH Zürich, 2003.
Fox, M., Herman, F., Kissling, E., and Willett, S. D.: Rapid exhuma-tion in the Western Alps driven by slab detachment and glacial erosion, Geology, 43, 379–382, doi:10.1130/G36411.1, 2015. Genti, M., Chery, J., Vernant, P., and Rigo, A.: Impact of gravity
forces and topography denudation on normal faulting in Central– Western Pyrenees: Insights from 2-D numerical models, C. R. Geosci., 348, 1–11, doi:10.1016/j.crte.2015.08.004, 2015. Héroux, P. and Kouba, J.: GPS Precise Point Positioning using IGS
orbit pro- ducts, Phys. Chem. Earth, 26, 573–578, 2001. Kierulf, H. P., Ouassou, M., Simpson, M. J. R., and Vestøl, O.: A
continuous velocity field for Norway, J. Geodesy., 87, 337–349, doi:10.1007/s00190-012-0603-2, 2013.
Klemann, V., Ivins, E. R., Martinec, Z., and Wolf, D.: Models of ac-tive glacial isostasy roofing warm subduction: Case of the South Patagonian Ice Field, J. Geophys. Res.-Sol. Ea., 112, B09405, doi:10.1029/2006JB004818, 2007.
Kouba, J.: A guide to using International GNSS Service (IGS) products, International GNSS Service, available at: https://igscb. jpl.nasa.gov/components/usage.html (last access: 20 February 2016), 2009.
Lacan, P. and Ortuño, M.: Active Tectonics of the Pyrenees: A re-view, J. Iber. Geol., 38, 9–30, 2012.
Larroque, C., Delouis, B., Godel, B., and Nocquet, J.-M.: Active deformation at the southwestern Alps–Ligurian basin junction (France–Italy boundary): Evidence for recent change from com-pression to extension in the Argentera massif, Tectonophysics, 467, 22–34, doi:10.1016/j.tecto.2008.12.013, 2009.
Lyard, F., Lefevre, F., Letellier, T., and Francis, O.: Modelling the global ocean tides: modern insights from FES2004, Ocean Dy-nam., 56, 394–415, doi:10.1007/s10236-006-0086-x, 2006. Mazzotti, S., Leonard, L. J., Cassidy, J. F., Rogers, G. C., and
Halchuk, S.: Seismic hazard in western Canada from GPS strain rates versus earthquake catalog: J. Geophys. Res.-Sol.Ea., 116, B12310, doi:10.1029/2011JB008213, 2011.
Nocquet, J. M. and Calais, E.: Crustal velocity field of the western Europe from permanent GPS array solutions, 1996–2001, Geo-phys. J. Int., 154, 72–88, 2003.
Nocquet, J.-M.: Present-day kinematics of the Mediterranean: A comprehensive overview of GPS results, Tectonophysics, 579, 220–242, doi:10.1016/j.tecto.2012.03.037, 2012.
Nocquet, J. M., Sue, C., Walpersdorf, A., Tran, T., Lenôtre, N., Ver-nant, P., Cushing, M., Jouanne, F., Masson, F., Baize, B., Chéry, J., and van der Beek, P. A.: Present-day uplift of the western Alps, Sci. Rep., 6, 1–6, doi:10.1038/srep28404, 2016.
Rebischung, P., Schmid, R., and Ray, J.: Upcoming switch to IGS08/igs08, atx. IGSMAIL-6354, 2011.
Rigo, A., Vernant, P., Feigl, K. L., Goula, X., Khazaradze, G., Ta-laya, J., Morel, L., Nicolas, J., Baize, S., Chéry, J., and Sylvander, M.: Present-day deformation of the Pyrenees revealed by GPS surveying and earthquake focal mechanisms until 2011, Geo-phys. J. Int., 201, 947–964, doi:10.1093/gji/ggv052, 2015. Rothacher, M. and Schmid, R.: ANTEX: The antenna exchange
format version 1.3. Format specifications, IGS Central Bureau, Pasadena, 2006.
Santamaría-Gómez, A., Bouin, M.-N., Collilieux, X., and Wöppel-mann, G.: Correlated errors in GPS position time series: Impli-cations for velocity estimates, J. Geophys. Res.-Sol. Ea., 116, B01405, doi:10.1029/2010JB007701, 2011.
Selverstone, J.: Are the Alps collapsing?, Annu. Rev. Earth Planet. Sci., 33, 113–132, doi:10.1146/annurev.earth.33.092203.122535, 2005.
Serpelloni, E., Faccenna, C., Spada, G., Dong, D., and Williams, S. D.: Vertical GPS ground motion rates in the Euro-Mediterranean region: New evidence of velocity gradients at different spatial scales along the Nubia-Eurasia plate boundary, J. Geophys. Res.-Sol. Ea., 118, 6003–6024, doi:10.1002/2013JB010102, 2013. Stocchi, P., Spada, G., and Cianetti, S.: Isostatic rebound following
the Alpine deglaciation: Impact on the sea level variations and vertical movements in the Mediterranean region, Geophys. J. Int., 162, 137–147, doi:10.1111/j.1365-246X.2005.02653.x, 2005. Tregoning, P. and Watson, C.: Atmospheric effects and spurious
sig-nals in GPS analyses, J. Geophys. Res.-Sol. Ea., 114, B09403, doi:10.1029/2009JB006344, 2009.
Vernant, P., Hivert, F., Chéry, J., Steer, P., Cattin, R., and Rigo, A.: Erosion-induced isostatic rebound triggers extension in low convergent mountain ranges, Geology, 41, 467–470, doi:10.1130/G33942.1, 2013.
Vigny, C., Chéry, J., Duquesnoy, T., Jouanne, F., Ammann, J., Anzidei, M., Avouac, J. P., Barlier, F., Bayer, R., Briole, P., Calais, E., Cotton, F., Duquenne, F., Feigl, K. L., Ferhat, G., Flouzat, M., Gamond, J. F., Geiger, A., Harmel, A., Kasser, M., Laplanche, M., Le Pape, M., Martinod, J., Mnard, G., Meyer, B., Ruegg, J. C., Scheubel, J. M., Scotti, O. and Vidal, G.: GPS network monitors the Western Alps’ deformation over a five-year period: 1993–1998, J. Geodesy., 76, 63–76, doi:10.1007/s00190-001-0231-8, 2002.
Walpersdorf, A., Sue, C., Baize, S., Cotte, N., Bascou, P., Beau-val, C., Collard, P., Daniel, G., Dyer, H., Grasso, J. R., Haute-coeur, O., Helmstetter, A., Hok, S., Langlais, M., Ménard, G., Mousavi, Z., Ponton, F., Rizza, M., Rolland, L., Souami, D., Thirard, L., Vaudey, P., Voisin, C. and Martinod, J.: Coherence between geodetic and seismic deformation in a context of slow tectonic activity (SW Alps, France), J. Geodynam., 85, 58–65, doi:10.1016/j.jog.2015.02.001, 2015.
Williams, S. D. P.: The effect of coloured noise on the uncertainties of rates estimated from geodetic time series, J. Geodesy, 76, 483– 494, doi:10.1007/s00190-002-0283-4, 2003.