HAL Id: hal-03011082
https://hal.archives-ouvertes.fr/hal-03011082
Submitted on 17 Nov 2020
HAL is a multi-disciplinary open access
archive for the deposit and dissemination of
sci-entific research documents, whether they are
pub-lished or not. The documents may come from
teaching and research institutions in France or
abroad, or from public or private research centers.
L’archive ouverte pluridisciplinaire HAL, est
destinée au dépôt et à la diffusion de documents
scientifiques de niveau recherche, publiés ou non,
émanant des établissements d’enseignement et de
recherche français ou étrangers, des laboratoires
publics ou privés.
Monem Ayaz, Renaud Toussaint, Gerhard Schafer, Knut Jørgen Måløy
To cite this version:
Monem Ayaz, Renaud Toussaint, Gerhard Schafer, Knut Jørgen Måløy. Gravitational and
Finite-Size Effects On Pressure Saturation Curves During Drainage. Water Resources Research, American
Geophysical Union, 2020, 56 (10), pp.e2019WR026279. �10.1029/2019WR026279�. �hal-03011082�
Monem Ayaz1,2,3 , Renaud Toussaint1,3,4 , Gerhard Schäfer2 , and Knut Jørgen Måløy3
1University of Strasbourg, CNRS, Institut de Physique du Globe de Strasbourg, UMR 7516, Strasbourg, France, 2Université de Strasbourg, CNRS, LHyGeS UMR 7517, Strasbourg, France,3PoreLab, The Njord Centre, Department of
Physics, University of Oslo, Oslo, Norway,4Lavrentev Institute of Hydrodynamics, Siberian Branch, Russian Academy of Sciences, Novosibirsk, Russia
Abstract
We experimentally and numerically study the influence of gravity and finite-size effects on the pressure-saturation relationship in a given porous medium during slow drainage. The effect of gravity is systematically varied by tilting the system relative to the horizontal configuration. The use of a quasi two-dimensional porous media allows for direct spatial monitoring of the saturation. Exploiting the fractal nature of the invasion structure, we obtain a relationship between the final saturation and the Bond number SFnw=Bo
0.097using percolation theory. Moreover, the saturation, pressure, and Bond number are functionally related, allowing for pressure-saturation curves to collapse onto a single master curve, parameterized by the representative elementary volume size and by the Bond and capillary numbers. This allows to upscale the pressure-saturation curves measured in a laboratory to large representative
elementary volumes used in reservoir simulations. The large-scale behavior of these curves follows a simple relationship, depending on Bond and capillary numbers, and on the flow direction. The size distribution of trapped defending fluid clusters is also shown to contain information on past fluid flow and can be used as a marker of past flow speed and direction.
1. Introduction
Displacement of one immiscible fluid by another in a porous medium is an important research topic both from a fundamental and an applied perspective. An increased understanding of the basic mechanisms that govern the pore-scale description is of interest for multiple disciplines of science such as soil-science, hydrol-ogy, physics, and biology and has shown industrial importance through applications such as enhanced oil recovery, CO2sequestration and by mapping and controlling of migrating ground water contaminants
(Nsir et al., 2012). Furthermore, it has revealed a variety of pattern-forming processes emerging from the pore scale up to the system scale (Lenormand et al., 1983; Måløy et al., 1985; Méheust et al., 2002; Løvoll et al., 2004; Toussaint et al., 2005), typically governed by the interplay between viscous, capillary, and gravita-tional forces. The structures have shown to exhibit a complex behavior, characterized by its rich intermittent dynamics (Clotet et al., 2016; Furuberg et al., 1988; Måløy et al., 1992; Moura et al., 2020; Moura, Måløy, Flekkøy, et al., 2017; Moura, Måløy, & Toussaint, 2017; Planet et al., 2009).
We study two phase flow in a quasi two-dimensional (2-D) porous confinement and look at the simple case of drainage at pore scale, where a nonwetting phase displaces a wetting one. Such experiments have shown to generate displacement structures that depend on the density and viscosity contrast between the fluids, surface tension, and the flow rates at which the system is driven (Lenormand et al., 1983; Løvoll et al., 2004; Toussaint et al., 2005). Furthermore, such structures are assembled by trapped regions of wetting phase, completely surrounded by the invading phase. The trapped islands are characterized by their power law distribution in size with an exponential cutoff directly related to the gravitational forces (Blunt & King, 1990) and the system's finite size.
The forces at play dominate at different length scales and their interplay gives rise to separate scaling regimes allowing for an upscaling of the system which consists of relating the pore-scale description to properties defined at the Darcy scale or even at the macroscopic scale (Toussaint et al., 2011; Vasseur et al., 2013; Wilkinson, 1986). In the limit of very slow flow rates, the emerging structure is seen to depend entirely on capillary and gravitational fores (Birovljev et al., 1991; Lenormand et al., 1983; Méheust et al., 2002),
Key Points:
• During slow drainage, the residual saturation can be obtained as a scaling law of the Bond number or the system size
• A general pressure-saturation law is obtained for primary drainage arising from hydrostatic effects, fractal properties, and the system size
• The final saturation after drainage allows to obtain information on the flux while it took place
Correspondence to:
R. Toussaint,
Citation:
Ayaz, M., Toussaint, R., Schäfer, G., & Måløy, K. J. (2020). Gravitational and finite-size effects on pressure saturation curves during drainage.
Water Resources Research, 56, e2019WR026279. https://doi.org/10. 1029/2019WR026279
Received 16 SEP 2019 Accepted 10 SEP 2020
Accepted article online 16 SEP 2020
©2020. The Authors.
This is an open access article under the terms of the Creative Commons Attribution License, which permits use, distribution and reproduction in any medium, provided the original work is properly cited.
and the obtained structure is seen to be well modeled by invasion percolation (Chandler et al., 1982; Wilkinson, 1984). When a low viscous fluid displaces a high viscous one at large enough rates, the unsta-ble displacement pattern that emerges is called viscous fingering. The analogy between diffusion-limited aggregation (DLA) and viscous fingering was first proposed by Paterson (1984) and is based on the equiva-lence between the probability field of diffusing particles and the pressure field in the viscous fluid. On the other hand, when a highly viscous fluid is injected into a lowly viscous fluid, a stable displacement will be observed. This situation is analog to the anti-DLA as proposed by Paterson (1984).
Numerical modeling of two-phase displacement in water-saturated porous media using continuum mod-els has been performed by many researchers (Aggelopoulos & Tsakiroglou, 2009; Kokkinaki et al., 2013; Nayagum et al., 2004; Schneider et al., 2015; Sleep et al., 2015; Zhang & Smith, 2001). However, the detailed local description of the invasion front in a porous medium cannot be simulated with these models because they do not explicitly consider the capillary and viscous pressure fluctuations at the pore scale. To over-come this shortcoming, microscopic approaches such as Stokes' solution for flow in single pores with a specified geometry or lattice Boltzmann methods (LBM) have been investigated to reproduce experiments (Aursjø et al., 2010; Fiorentino et al., 2017; Misztal et al., 2015). Similarly, pore-scale network models have been developed to study a wide range of displacement processes, including drainage and imbibition (Aker et al., 1998; Joekar Niasar et al., 2009; Kallel et al., 2017; Nordhaug et al., 2003; Nsir et al., 2012, 2018; Sheng & Thompson, 2013; Singh & Mohanty, 2003; Tørå et al., 2012; Yang et al., 2019). Ewing and Berkowitz (1998) developed a generalized growth model based on invasion percolation to simulate immiscible displacement in saturated porous media. Capillary, viscous, and gravity forces were incorporated in their three-dimensional (3-D) algorithm, where viscous forces were expressed stochastically rather than explicitly. Glass et al. (2001) developed a macromodified invasion percolation (MMIP) model, including also the effects of all three forces within the invading phase in a macroheterogeneous porous medium.
In macroscale modeling of two-phase flow, the porous medium and the flow are described by continuous mathematical fields using an empirical functional relationship, coupling the saturation of the wetting fluid
Swto the capillary pressure pnw−pw=p(Sw), which is the main assumption at hand, where pnwand pwis the pressure in the nonwetting fluid and pwthe pressure in the wetting one. In practice, this relation can be found by conducting experiments on a given porous medium and fluid pair on representative volumes. It is usually parameterized using mathematical models such as Van-Genuchten or Brooks-Corey model (Brooks & Corey, 1964; van Genuchten, 1980). In the case of primary drainage, the Brooks-Corey model introduces several model parameters such as pore size index, entry pressure needed by the invading fluid to displace water, and the residual saturation of the wetting phase. The latter one is an important model parameter because the description of two-phase flow at the macroscopic scale requires also the use of a second constitutive relationship: relative permeabilities as function of saturation of the wetting phase. In this paper we study the capillary pressure-saturation (PS) relationship during drainage in a system of finite size, taking into account gravitational effects. We examine how this finite size and gravitational forces influence this PS relationship and how it can be upscaled. First, we propose a simple numerical scheme based on invasion percolation (IP) in a gradient which produces PS curves. In this numerical scheme we take into consideration that we have a gravitational field acting on the system, a distribution of capillary pressure thresholds linked to the pore-scale geometry and the fact that the system has a finite size. Next, we study the relative pressure of the wetting fluid measured at the outlet of a transparent quasi two-dimensional exper-imental setup with respect to the imposed constant atmospheric pressure of the nonwetting air phase as a function of the saturation, ΔP = Pa−pw=𝑓(Sw). Comparing experimental and numerical results allows to analyze what part of the experimental pressure signal is mostly controlled by the approximate description underlying the IP in gradient algorithm. It also allows to express analytically the pressure field in the numer-ical model system, to perform geometrnumer-ical analysis on the invasion structure and hence to perform further approximations that cast light on the origin of the shape of the macroscopically measured capillary-pressure relationship. From the PS relation obtained during the detailed gravity-stabilized experimental and numer-ical primary drainage studies, we can then directly derive one of the significant characteristics of water retention curves which is the residual saturation of the wetting phase Sw= 1 − Snw. We further deduce a functional relationship, which couples the final saturation with the pore-scale description under the influ-ence of gravity using percolation theory. This allows to upscale the pressure saturation relationship for a given porous medium, with the help of laboratory drainage tests. We also show how the residual saturation depends on the Bond number and the conditions of drainage flow, in terms of flow angle and flux.
2. Theory
When the viscous forces are negligible for the invasion process (capillary regime), the obtained displacement pattern can be understood by the relative importance of gravity to capillary forces, which is convention-ally defined by the Bond number Bo, corresponding to the ratio of buoyancy forces to capillary forces at a pore scale,
Bo =Δpgrav
Δpcap
= Δ𝜌ga sin 𝛼
𝛾∕a , (1)
where Δ𝜌 is the density contrast between the two fluids, g is the gravitational acceleration, 𝛼 is the angle between the average flow direction and the horizontal plane, a is the typical pore size, and𝛾 is the surface tension between the two fluids. Δ𝜌 ag sin 𝛼 is the hydrostatic pressure drop on a length scale a, parallel to the flow direction. The typical ratio between viscous and capillary forces over a pore is defined by the capillary number
Ca =Δpvisc
Δpcap = 𝜇va2
𝛾𝜅 , (2)
where𝜇 is the viscosity of the most viscous fluid, v is the Darcy velocity, and 𝜅 is the permeability of the porous medium.
When the least viscous fluid displaces the most viscous one, as considered here, viscous forces destabilize the system and promote fingering. When the least dense fluid invades the system from the top, as also con-sidered here, gravity forces stabilize the system and promote a horizontal front, on average. Variations of the capillary pressure thresholds promote a small-scale roughness of the front. The separation between sta-bility and instasta-bility is set by comparing the Bond and capillary numbers (Toussaint et al., 2005): A stable situation corresponds to Bo> Ca (Méheust et al., 2002), an unstable one to Bo < Ca (Løvoll et al., 2011). We consider situations where the nonwetting invading fluid has negligible viscosity in front of the defend-ing one. The presence of disorder in the porous medium gives a distribution of capillary thresholds with a well-defined spread. In order to capture the relative relevance of these fluctuations, we utilize the fluctuation number Fl as suggested by Méheust et al. (2002) and Auradou et al. (1999).
Fl = C(Bo − Ca), (3)
where the dimensionless prefactor is C = 𝛾∕(aWt), with𝛾/a the characteristic average capillary pressure threshold and Wtthe standard deviation of the random capillary thresholds in the porous medium. For most media, the average value and the standard deviation of the capillary pressure thresholds are of the same order of magnitude (Toussaint et al., 2005), and C is of order 1. The invasion front is defined as the set of pores bordering the nonwetting phase to the bulk of the defending fluid. From percolation theory the front width𝜎 for a gravity-stabilized drainage front is found to scale with the fluctuation number Fl as (Birovljev et al., 1991; Wilkinson, 1984, 1986)
𝜎∕a ∝ Fl−𝜈∕(1+𝜈). (4)
Here𝜈 is a critical exponent of the correlation length from percolation theory, 𝜈 = 4∕3 in 2-D (Stauffer & Aharony, 2014) and𝜈 = 0.88 in 3-D (Adler et al., 1990). Since the fluctuation number depends on the width of the capillary threshold distribution, an increase in its width results in an increase of the front width. Throughout our study in sections 3, 4, and 5, we will consider Ca≪ Bo; hence, we will utilize the reduced expression Fl = [𝛾∕(aWt)]Bo ∼ Bo, so that
𝜎∕a ∝ Bo−𝜈∕(1+𝜈). (5)
3. Experimental Setup
The experiments are performed in a quasi two-dimensional porous medium (cf. Figure 1), which is made up by randomly distributing a monolayer of glass beads (of diameters ranging from 0.9 to 1 mm) between the sticky sides of two sheets of adhesive contact paper in a transparent Hele-Shaw cell with thick walls.
Figure 1. Schematics of the experimental setup. The porous medium is sandwiched between two sheets of adhesive
contact paper and kept rigid by clamping it between a water-filled pressure cushion pressed against a rigid transparent plate and a plexiglass plate. A pulley connected to a light box is used to provide the desired inclination𝛼.
The boundaries are sealed off with a rectangular layer of silicon glue. Hence, the porous medium can be considered as a rectangular box of length L = 14.5 cm, width W = 10 cm, and thickness b = 1 mm. Appended to the system is a filter, positioned between the fixed glass beads and the outlet. The filter consists of a sponge with a typical pore size much smaller than the pores in the main porous matrix. The resulting difference in entrance pressure makes it necessary to invade all clusters connected to the outlet filter, before invading the outlet filter.
To prevent the potential displacement of beads, the porous matrix is kept rigid by a thick plexiglas plate from above with milled inlet and outlet channels allowing for the injection and extraction of fluid phases. From below a mylar film is kept under pressure by a 3.5 m high water column, acting as a pressurized cushion forcing the glass beads above to stay in place. The rigid model is mounted onto an illuminating light box that can be tilted by an angle𝛼 over the horizontal, allowing for tuning of the gravitational component g sin 𝛼. The invading nonwetting phase used in all the experiments is air. The wetting phase used is glycerol-water solution with a 90% glycerol by weight, dyed with a 0.1% of negrosine for visual contrast. The wetting fluid has a density of𝜌w=1,205 kg ·m−3and kinematic viscosity of𝜈 = 4.25 10−5m2·s−1. The surface tension between the two fluids is𝛾 = 6.4 · 10−2N·m−1.
During the experiments the relative pressure difference between the nonwetting and wetting phase is mea-sured by two HoneywellⓇ26PCAFG6G flow-through pressure sensors, connected to the outlet of the model. The saturation of the two phases is extracted by thresholding the grayscale map from images taken at fixed time lapse with a NIKONⓇD7100 single reflex camera (SLR) camera mounted perpendicular to model, sim-ilarly to the procedure used by Moura et al. (2017). A syringe pump is used to provide constant flow rates, with a discharge rate of Q = 6.67 · 10−11m3·s−1, corresponding to a capillary number of Ca = 1.2 · 10−4. The
experiments are terminated once the pores boarding the filter have all been invaded.
4. The Network Model
IP algorithms (Chandler et al., 1982; Moura et al., 2015; Wilkinson & Willemsen, 1983) have been exten-sively used to model drainage in the capillary regime between immiscible fluids when the viscous pressure drop and compressibility of the wetting fluid are negligible for the displacement of the fluid-fluid interface, contrarily to cases where viscous forces (Løvoll et al., 2011) or compressibility (Jankov et al., 2010) play an important role.
In such models the invasion is represented by a cluster growth process on a random lattice, dependent solely on the global homogeneous pressure in each phase and on the local capillary pressure thresholds in the pore throats along the interface. Such arrangements have been shown to generate displacement struc-tures that are quantitatively similar to what is observed during drainage (Blunt et al., 1992; Lenormand & Zarcone, 1985). In this study we will utilize a bond invasion percolation model. The porous medium is modeled as a completely connected network, where all the pore sites are interconnected to their neigh-boring pores through pore throats. The pore throats are oriented at 45◦from the main flow direction on a rectangular lattice with periodic boundary conditions perpendicular to the flow direction.
Disorder is introduced in the model by letting pore throats sizes be drawn from a distribution corresponding to the experimental one. First, a random variable is picked from an uniform distribution in [0,1]. Next, a mapping is made transforming the flat distribution to the experimental one, obtained utilizing an imaging based algorithm. The size distribution of the pore throats channel radii is characterized on the experimental porous matrix, utilizing a Delaunay triangulation over all the constricting beads, as suggested by Bryant and Blunt (1992) and detailed by Moura et al. (2017). For each pore throat, the channel radius R fixes the corresponding capillary threshold pressure needed to be overcome in order to invade the adjacent pore site, from Young Laplace law, ΔPt
c=𝛾∕2R.
The algorithm of IP in a Gradient to describe drainage in a gravitational field follows the principles intro-duced by Sapoval et al. (1985) and Birovljev et al. (1991). Gravity is accounted for by linearly weighting the capillary throat thresholds with the hydrostatic pressure difference between the two fluids, taking into account that the pressure in the wetting phase at elevation z above the outlet is Pw=Poutlet−𝜌wgz, where
Poutletis the pressure in the wetting fluid at the outlet position.
Initially, the network is fully saturated with a wetting fluid. For each iteration the interface of the nontrapped part of the defending structure moves where the capillary pressure threshold adjusted by the hydrostatic pressure drop is lowest (see Equation 9). This movement involves both the invasion of the pore throat and of the connecting pore. The parts of the interface that enclose (trap) entirely a connected part of the defend-ing fluid will be locked due to the incompressibility assumption of the defenddefend-ing fluid: No further invasion is allowed into these trapped clusters. Once breakthrough is reached, that is, once a pore along the outlet is invaded, the simulation is continued, but the pore throats between the model and the outlet cannot be invaded, reflecting the presence of the semipermeable filter at the outlet. The other pore throats, internal to the model and along the boundary of the invasion structure, can still be invaded if they are connected to the outlet via the wetting phase, similarly to the rule applied before breakthrough. Hence, after break-through, the invasion of pores inside the model and connected to the outlet continues. Finally, the invasion is stopped once all the sites bordering the outlet of the model have been fully invaded: These sites prevent the connection of any remaining wetting fluid filled pores and the outlet, effectively blocking any further displacement of the wetting phase. The aspect ratio of the IP lattice was equal to the experimental system for all the simulations performed. The size of the lattice used was 232 × 330 sites.
The previous paragraph describes the numerical algorithm. It is worth noting that the numerical inva-sion events are ordered, but the ordering indexes are not directly proportional to physical time. Physically, when a pore throat and the adjacent pore are invaded, such movement may eventually give access to one or more neighboring pores of lower capillary pressure threshold, which the interface will invade at once (in simulations where the outlet pressure is not reduced), and repetition of this process can lead to the col-lective displacement known as a Haines jump (Haines, 1930). If, by contrast, the outlet pressure is allowed to decrease to have a hydrostatic pressure in the defending fluid during this series of numerical invasion events, a Haines jump corresponds to a set of successive invasion events during an avalanche, defined by the outlet pressure series: An avalanche starts when the outlet pressure starts to decrease and finishes when it rises again above the value it had prior to this decrease. Such avalanches in experimental systems have been studied, for example, by Måløy et al. (1992) and Moura et al. (2020).
5. Results
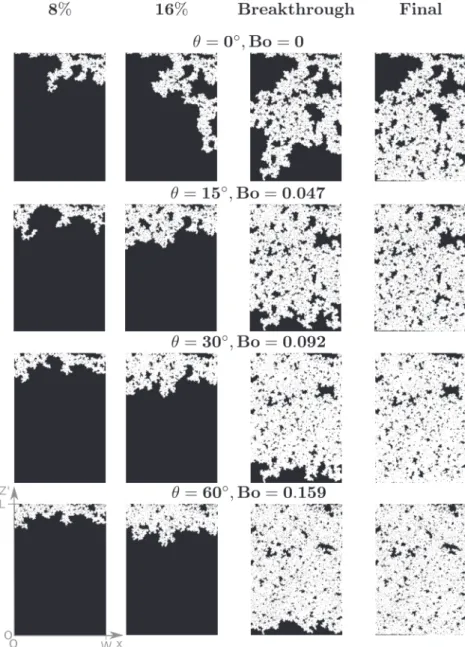
Figure 2 shows a selected set of snapshots captured for different Bond numbers, displaying the growth of the displacement structure from the start of the invasion up to the end of the experiments, when all the pores bordering the outlet channel have been invaded and the final saturation SF
nwis reached. The gray map images have been thresholded. In the resulting binarized images, air and beads are displayed in white; the wetting
Figure 2. Snapshots from four different experiments. The air invades the saturated porous media from top to bottom;
the time evolution for each Bond number goes from left to right. In these binarized snapshots, air and beads are white, and the wetting fluid is black. The first two columns show the displacement structure after, respectively, 8% and 16% of air has saturated the medium taking 2.7 and 5.4 hr; the two last ones show the Breakthrough and final configurations. The duration of the experiments with increasing inclination is 18.9, 25.7, 26.1, and 26.6 hr.
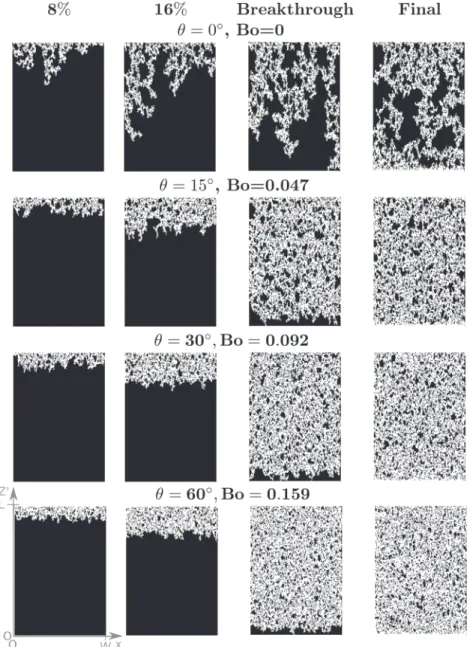
fluid is displayed in black. For comparison, snapshots from the simulations are presented in Figure 3. To first order, simulations and experiments shown in Figures 2 and 3 are qualitatively similar. The main difference noted is the detailed shape of the patterns at small scale, which could appear slightly more ramified in the experimental case than in the numerical one. This could be due to the fact that several pores can be invaded simultaneously in the experiment, which is not the case in the simulations. During such an invasion, the capillary number becomes locally larger in the experiments, whereas it stays strictly zero in the simulations. Also, the shape of the pore networks is different between the two cases (rectangular in one case and between a monolayer of spheres placed at random in the other).
We observe that an increase of the gravitational component leads to a denser displacement structure, that is, a higher SF
nw. The invasion front, which refers to the set of pores bordering the bulk of the wetting phase, shows a reduced spread𝜎 along the flow direction; that is, when the Bond number increases, the system
Figure 3. Snapshots from network simulations with Bond numbers comparable to those set by the inclinations in the
experiments. Invading air is in white; dense wetting defending fluid is in black. The first two columns show the displacement structure after, respectively, 8% and 16% of air has saturated the medium; the two last ones show the breakthrough and final configurations.
tends to become more stabilized and the fronts are hence closer to a horizontal flat structure. The hydrostatic pressure gradient suppresses the maximum height difference between points along the front.
The changes observed in the structure in Figures 2 and 3 between the experiments (or simulations) in hor-izontal cells, at Bo = 0, and the other cases at nonzero angle are more important than the changes between the other cases. This is coherent with the fact that the interface width predicted by Equation 5 diverges for
Bo→ 0. As will be detailed later, and as was shown by Moura et al. (2015), the interface width is set by finite
size effects for the horizontal case at Bo = 0. The large areas of trapped wetting fluid observed for Bo = 0 are also related to this large interface size.
In these experiments, the cells were cleaned and resaturated in wetting fluid prior to each experiment, but the same bead configuration was used for every experiment. Tests done after rebuilding the cell with other bead configurations changed the exact position of the fluctuations in pressure saturation curves and location of the trapped wetting fluid islands but did not change the overall behavior reported in Figures 2 and 6.
Figure 4. Pressure-saturation curves obtained for five different inclinations
of the experimental model. Here Snwis the saturation of nonwetting phase, andΔPcorresponds to the pressure difference between the outlet and the atmospheric pressure.
5.1. Measuring PS Curves
The saturation of the nonwetting phase Snwis extracted by image analysis from the sequence of captured images. The saturation increases linearly with time, in accordance with the constant flow rate imposed on the system. The pressure drop across the model is at any time such that it maintains the constraint by the flow rate. The pressure ΔP is the differ-ence between the atmospheric pressure Paand the pressure in the wetting phase at the outlet
ΔP = Pa−Poutlet. (6) Combining the extracted saturation with the pressure measurements, a series of PS curves are obtained, as shown in Figure 4. The equivalent measurement is done on the IP simulations and shown in Figure 5. The first data point on these curves of pressure difference between the two phases, in this system is nonzero, which is related to the varying hydro-static pressure ΔPhacross the system, which scales as the gravitational term g sin𝛼 for different inclinations. The respective initial values of the pressure offsets are followed by a pressure buildup without any pore inva-sion. As the initially flat interface begins to fill the local geometry of the pore throats, the capillary pressure ΔPcstarts to build up. Pore throats have widths that are spatially uncorrelated, and thereby, each pore throat exhibits an associated capillary threshold pressure Pt
cwhich is the minimum pressure needed for the interface to penetrate its respective pore throat. For a given porous structure, fluid pair, and wettabilities there will be a distribution of capillary pressure thresholds associated to the system. The condition for invasion is that the local pressure difference between two phases along the front satisfies ΔPc=Pt
c. In the presence of gravity, height differences along the invasion front give rise to a hydrostatic term. When accounted for, this gives the following invasion criterion:
ΔPc=Pa− (Poutlet− Δ𝜌gz) = ΔP + Δ𝜌gz = Ptc, (7)
where z = z′sin𝛼 is the elevation of the pore throat considered above the cell bottom, with z′the linear
upward coordinate along the cell. z′varies between 0 at the outlet, at the bottom of the cell, and L at the
inlet at the top of the cell. This can also be expressed as ΔP = Pt
c− Δ𝜌(g sin 𝛼)z
′. (8)
Figure 5. The pressure saturation curves obtained numerically, for a
system size with the same aspect ratio L×Was the experimental system.
Therefore, the front will move at the place with the lowest modified capillary pressure threshold
Ptc− Δ𝜌(g sin 𝛼)z′ (9) When this criterion is met, the smallest capillary threshold is invaded fol-lowed by a rapid decrease in pressure during the unstable Haines jump where pores are invaded until the interface stabilizes on smaller pore throats. As the porous boundary is horizontal, the initial pressure buildup associated with the invasion of the first pores is independent of gravi-tational effects, that is, it is invariant with respect to the Bond number. Once the lowest capillary threshold is reached by ΔPcin Equation 7, it fluctuates as the pressure drops during these Haines jumps and rises again. It fluctuates during the whole process, since the subsequent cap-illary thresholds of invaded pores Pt
c are distributed. As the invasion front progresses downward, the values of z′where a pore invasion takes
place slowly decrease. Consequently, the pore pressure difference ΔP, from Equation 8, slowly increases on average with the invading fluid saturation, in addition to the fluctuations associated to those of Pt
the Haines jumps. These fluctuations consist in many buildups followed by sudden relaxations (occurring at many time scales), allowing for the invasion of multiple pores during one burst (Furuberg et al., 1996; Haines, 1930; Måløy et al., 1992). Some differences can be noted about the shape of the pressure fluctuations between the experimental (Figure 4) and numerical (Figure 5) results: The pressure signal seems more reg-ular in the experiments, with less high frequency content. Although pores are invaded one by one in terms of numerical steps in the simulations whereas several pores are invaded in a Haines jump in the experi-ments, this is unlikely to be the source of the discrepancy: Multiple pore invasion (in real physical time) is easy to define in an IP model: It is enough to consider the number of pores necessary to reach again the same pressure level and define this as an avalanche. This is the usual definition, as in fiber bundle model dynamics, reviewed, for example, by Pradhan et al. (2010). These avalanches are present in our simulations. Three other factors can make these fluctuations different between the simulations and experiments: (1) The sampling rate of the experimental sensor is not so fast as to capture the fastest fluctuations. (2) The capillary pressure thresholds distribution was not perfectly matched in the simulations due to limited knowledge on it in the experiments: The right width Wtwas used, but the shape might differ, which leads to different fea-tures for these fluctuations. (3) Viscous effects are not negligible during the unstable phases; they exist in the experiments, for which results depend on where the pressure is measured but not in the simulations. These differences are subtle, and the latter is certainly the main source of discrepancy in the shape of the jumps (rounded aspect at small scale in Figure 4, and not in Figure 5).
The hydrostatic pressure gradient tends to suppress any height differences between two points along the front. Two distinct features of the PS curve are observed. The pressure difference is seen to fluctuate, cor-responding to Haines jumps, arising from the fact that the aforementioned capillary threshold pressure displays disorder at the invasion front. We further see that the pressure difference ΔP in Equation 8 increases because the hydrostatic pressure difference Δ𝜌g sin(𝛼)z' decreases linearly as the invading phase approaches the outlet. The slopes observed in the PS curves during experiments, in Figure 4, and simulations, in Figure 5, are consistent with each other and reflect this increase of ΔP as the invasion phase approaches the outlet and the nonwetting phase saturation Snwincreases. The increase of the slope with Bo is also consistent with the sin(𝛼) term in Equation 8.
Once the invading phase reaches breakthrough, the invasion structure is in contact with the filter prolongat-ing the cell, presentprolongat-ing much smaller pore throats, so that this filter is not invaded, while pores with higher capillary thresholds are invaded in the cell. This leads to an increase of the capillary pressure as the invasion goes on. Once the pores bordering the filter have all been invaded, the system is said to have reached its final saturation SF
nw. We observe that there is a consistency between the numerical (Figure 5) and the experimen-tal (Figure 4) final saturation values as the inclination increases. A larger difference between experimenexperimen-tal and numerical final saturations SF
nwcan be noticed in the case of Bo = 0. This case is on the verge of marginal instability, which happens at Bo = 0 and Ca = 0. This case is very slightly unstable, corresponding to a very low capillary number Ca. This can be interpreted from the work of Moura et al. (2015), done in such a con-figuration. In this case, a characteristic correlation length of saturation diverges, and finite-size effects come into play to determine the final saturation. Large fluctuations are present in the final saturation between different realizations of experiments, or of simulations, or between different subsets of the system. Figures 4 and 5 correspond to one realization each, and the fact that they differ significantly from each other at Bo = 0 presumably reflects this dispersion around the average value for this configuration. As will be detailed later on, the correlation length is smaller at larger Bo, so that the macroscopic final saturation reflects the average of a larger number of independent subsystems of size determined by the correlation length. Consequently, the system-size finite saturation is less dispersed between realizations when Bo increases. This is consis-tent with the better match observed for the final saturations SF
nwbetween experiments and simulations in Figures 4 and 5 at larger Bond numbers.
5.2. Master Curve: Relating the Pressure Drop and Saturation for Different Bond Numbers
For the case Bo> 0, that is, when the lightest fluid penerates from the top and gravity stabilizes the sys-tem, and the system is in mechanical equilibrium, the total pressure difference across the porous model is expressed as ΔP = ΔPc − ΔPh. Here ΔPcis the capillary pressure across the interface, given by the Laplace pressure, Equation 10, and ΔPh is the hydrostatic pressure difference across the wetting phase. For slow drainage where Ca≪ 1, this pressure difference is essentially hydrostatic and can be expressed as
Figure 6. Schematics of a fully saturated porous medium, which has been
drained until the average front position is in a Distance l from the outlet.
ΔPh = Δ𝜌gl sin 𝛼. Here, Δ𝜌 is the density contrast between the flu-ids, the term g sin𝛼 is the component of gravity parallel to the cell, and
l = Δz′is the distance between the point considered along the two fluids
boundary and the outlet, projected along the steepest descent direction. Since gravity stabilizes the front, one can consider a characteristic dis-tance l as the mean in-plane disdis-tance between the outlet and the invasion front. Thereby, the measured pressure across the cell can be expressed as follows:
ΔP =2𝛾∕R − Δ𝜌gl sin 𝛼. (10) Furthermore, a functional dependency of the saturation with respect to l can be expressed, by considering the volume conservation of the nonwet-ting phase. Saturation is size and region dependent. To disnonwet-tinguish here between local values and global one, we note the global saturation, which is the one measured in most experiments, as the system size or total sat-uration Stot
nw. It corresponds to the average saturation in the entire cell of size Atot = L × W, that is, to the saturation measured in Figure 4. We approximate the system as locally transiting from an initial saturation S0
nw to a characteristic residual final saturation SF
nwafter the passage of the drainage front, that is, above it, compare Figure 6, which is a simplified representation of the saturation maps of Figures 2 and 3. Fluctuations along the invasion front are assumed to average out, and the thickness of this front is neglected in front of the system size L, that is, the local satu-ration is supposed to jump from the initial value S0
nw, under the front, to the final value SF
nw, above the front. We denote A
F = (L−l)×Wthe area of the region where the invasion front has passed. By volume conservation, we get an expression for the total saturation
Stot
nwAtot=SFnwA F+So
nw(Atot−AF). (11)
where Atot=LWis the total area, i.e.
Stot nwLW = S F nw(L − l)W + S o nwlW. (12)
Dividing this equation by SF
nwLWleads to l L= Stot nw SF nw −1 S0 nw SF nw −1. (13)
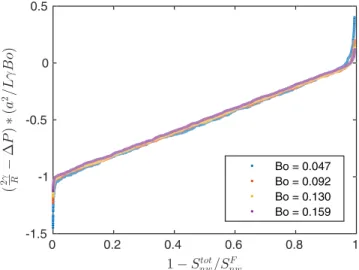
Figure 7. Data collapse of pressure as function of the relative saturation,
for the experimentally obtained data sets.
Since the system is initially fully saturated, S0
nw=0. This gives an expres-sion for the distance to the outlet as l = L(1 − Stot
nw∕SFnw). Inserting this in Equation 10 leads to the following saturation pressure relation:
ΔP = 2𝛾 R − 𝛾L a2Bo ( 1 −S tot nw SF nw ) . (14)
This equation has been expressed with the Bond number from Equation 1. In Figure 7, the rescaled pressure is plotted as a function of the relative saturation obtained from the experiments shown in Figure 2, whose raw saturation pressure measurements are shown in Figure 4. Sim-ilar results obtained from the numerical modeling whose snapshots are shown in Figure 3 are displayed in Figure 8: we here show the enve-lope of the PS curves, that is, the maximum of the pressure difference reached up to a certain saturation, without displaying the fluctuations related to the Haines jumps. The term 2𝛾/R corresponds approximately to the entrance pressure; that is, it is approximated as the rise in ΔP asso-ciated to the invasion of the first pore. More precisely, the term 2𝛾/R to consider corresponds to the capillary pressure at the characteristic
Figure 8. Data collapse of pressure as function of the relative saturation,
for the numerically obtained data sets.
position of the invasion front, separating the initial saturation zone and the final saturation one. The position of this front can be evaluated exper-imentally from its average position in the snapshots in Figure 3. At a given time, the boundary of the fully saturated cluster is extracted from image analysis. The average of the z′positions of the pixels belonging to this
boundary defines the average front position l. At the same time, ΔP is measured and 2𝛾/R is evaluated using Equation 10, by linear regression of the central (straight) part of the P−l curve at non zero saturation. Theoretically, the characteristic position of the front can alternatively be defined as the position where the occupancy probability corresponding to the capillary pressure drop is equal to the percolation threshold for the type of network defined by the porous matrix. As demonstrated by Moura et al. (2015), this corresponds to
2𝛾∕R = 𝑓−1(pc), (15) with pc the percolation threshold in terms of occupancy probability,
𝑓(P) = ∫P
0 g(P
′)dP′ is the cumulative distribution of the normalized
capillary threshold distribution (probability density function) g(P), and
f−1is the reciprocal function of f . In other words, the constant term in
Equation 14 corresponds to the capillary pressure threshold corresponding to the percolation threshold in the pore network. This is the procedure used to determine 2𝛾/R in the simulations, where the distribution of capillary pressure thresholds f (p) and square network connectivity allowing to determine pc=1∕2(Moura et al., 2015; Stauffer & Aharony, 2014) are known.
We see that by inserting pore-scale description of the system, and taking into account the gravity effect across the cell, we are able to collapse the PS curves onto a single master curve: This equation, Equation 14, cap-tures properly the entrance pressure, the rise of the pressure drop with the drainage, and the final pressure buildup when the invader is limited by the semipermeable membrane. This is the case both for the exper-iments (Figure 7) and for the simulations (Figure 8), in all probed effective gravities (i.e., cell angles over the horizontal). This reduced pressure has two terms: One is related to the disorder in the system, and the second term is related to the hydrostatic height difference, which decreases as the drainage takes place and the average interface moves down, closer to the outlet.
5.3. Final Saturation as Function of the Bond Number
Previous research has allowed to explicit a functional dependency between final air saturation and the spatial extension of the system size in the absence of gravity, that is, for the flat case, in the capillary regime (Moura et al., 2015). Løvoll et al. (2011) extended the analysis to take dynamical effects into account, allowing a broad range of capillary numbers to be permitted, in a viscosity-destabilizing situation, that is, when the least viscous fluid invades the system, without stabilizing effects of gravity. In this section we propose a scaling relation between the residual saturation (at the end of the drainage) and the Bond number for a gravity-stabilized situation, that is, when the lighter fluid is initially on top of the denser one.
The invaded region in the capillary regime is shown to display a fractal structure (Lenormand et al., 1983; Wilkinson, 1984), with a well-established fractal dimension (Mandelbrot, 1982) of Dc = 1.83 for a two-dimensional (2-D) system (Lenormand & Zarcone, 1985). Exploiting together this fractal property of the invaded area and the scaling properties of the invasion front, a functional relationship between the final saturation SF
nwand the Bond number or system size can be obtained. The final saturation of the system SFnw is attained once all the pores closest to the outlet have been invaded. We first note that the largest connected clusters of defending fluid, that stay trapped after the invasion interface moved through the system, are built by the motion of this interface. Before they are disconnected of the large cluster connected to the outlet, the boundary of these clusters is part of the mobile interface. Their maximum size is reached when they become disconnected, after what their size does not evolve significantly. Hence, the maximum linear size of the trapped clusters corresponds to the typical size of the interface in the average flow direction. This cutoff length scale lccorresponds thus to the root-mean-square width of the mobile front, that is, lc≃𝜎, which follows the scaling law from Equation 5, set by IP in a gradient, as established by (Birovljev et al., 1991):
Figure 9. The final saturation as a function of the Bond number is plotted
both for the experimental and numerical results together with the predicted 2-D relationSF
nw=Bo0.097.
Up to this size, the system is fractal with a fractal dimension correspond-ing to capillary fcorrespond-ingercorrespond-ing and IP, Dc. Above this size, the mobile front looks like a straight horizontal line. The fractal dimension of the set of trapped clusters at scales above this size is thus not set any more by the selection of smallest thresholds but by the geometry of the straight line leaving trapped clusters everywhere behind it: It presents the trivial frac-tal dimension of the space left behind the front, that is, D = 2 in two dimensions (2-D). If the system size is smaller than this characteristic size
aBo−𝜈/(1 + 𝜈), the system is fractal up to the system's shortest size, W or L. To summarize, the system is fractal with dimension Dcup to a cutoff size
lc=Min(aBo−𝜈∕(1+𝜈), W, L). (17) The functional relationship between the final saturation and lcis found by considering a partitioning of the model of dimensions L × W into square boxes of length lc. For every such box the displacement structure occupies on average (lc∕a)Dc pores. Above this size, the fractal dimension is the trivial fractal dimension D = 2, and the number of boxes of size l2
cwith trapped clusters required to cover the system is simply LW ∕l2
c. Moreover, a pore area is a2, the system's area is LW , and the final saturation is the
fraction of the total area occupied by the nonwetting fluid. Hence,
SFnw= (LW l2 c ) (l c a )Dc a2 LW = ( lc a )Dc−2 . (18)
Using Equation 17 hence leads to
SFnw∝Bo[−𝜈∕(𝜈+1)](Dc−2), (19)
where𝜈 is a critical percolation exponent, having the value 4/3 in 2-D (Stauffer & Aharony, 2014). This is the case when gravity sets up the cutoff scale, that is, when aBo−𝜈/(1 + 𝜈)< Min(W, L). By contrast, when the
system size or gravity is negligible, we predict
SF
nw∝Min(W ∕a, L∕a)
(Dc−2). (20)
This last relation is satisfied by experiments and simulations in horizontal cells where Bo≪ 1 for slow drainage where Ca≪ 1, as demonstrated by Moura et al. (2015).
This relation, Equation 19, holds for Bo> Ca, where the invading fluid from the top has the lower density. In this case, corresponding to the experiments and simulations done here, we obtain a functional dependency between the final saturation and the Bond number. In order to check this predicted dependency, the final saturation SF
nwwas measured experimentally (circles) and numerically (stars) for a range of Bond numbers and shown in Figure 9. From our theoretical prediction we expect
SFnw∝Bo0.097, (21)
This corresponds to the dashed line in this figure. The agreement between both simulations and experiments and this theoretically predicted scaling seems satisfactory. The spread of the final saturation is seen to narrow in as the Bond number increases, which is associated with the finite size effects being suppressed and the increasing dominance of the width𝜎 as the limiting factor.
6. Discussion
6.1. Extensions in Three and One Dimensions
This type of argumentation can be extended to three dimensions (3-D). Instead of considering partitioning of square boxes, we now consider cubes which on average occupy (lc∕a)Dcpores. This leaves us with the general relation
SF nw∝Bo
Figure 10. Final saturation and corresponding Bond number for four
different soil samples, for different fluid pairs in a given medium. The Bond number was here varied by changing the wetting phase. The soil types in these experiments by Nouri et al. (2014) are Persian Gulf Sand (PGS), sandy loam (SL), silty clay (SiC), and silty loam (SiL). The striped lines indicate the power law slope obtained from the theoretical prediction.
where D is 2 or 3 depending on the case considered, 2-D or 3-D. Here the critical exponent𝜈 = 0.88 in 3-D from percolation theory (Adler et al., 1990), and the fractal dimension obtained from IP is found to be
Dc = 2.5 (Wilkinson & Willemsen, 1983). Comparative experimental measurements have also been made (Chen et al., 1992; Nsir et al., 2012; Yan et al., 2012) ((Toussaint et al., 2012) for a review), finding compatible
Dcvalues. Hence, we expect in 3-D,
SF nw∝Bo
0.23. (23)
Data in 3-D with detailed capillary-pressure relationships and systemat-ically changing Bond number are more scarce than in 2-D, as it is easier to change the orientation of the 2-D cell than it is to perform 3-D experi-ments where the gravitational field is changed and the wetting properties are kept fixed. Doing so would require to perform the experiments in a given medium and with a given fluid pair in a centrifuge, which is an interesting perspective for future work. To check nonetheless the level of consistency or inconsistency between the predicted 3-D relation from Equation 23 and the experiments, the proposed prediction was compared with measurements conducted by Nouri et al. (2014). Here saturation and pressure were measured using a hanging column apparatus for four dif-ferent soil types: namely, persian gulf sand (PGS), sandy loam (SL), silty clay (SiC), and silty loam (SiL). For every soil type drainage experiments were performed for four different wetting phases. We determined the final volumetric content of each wet-ting fluid as function of the soil texture by digitizing the presented data and extracwet-ting the resulwet-ting final air saturation. We note that the displacement of petroleum by air was extremely low and resulted in very small saturation variations even by applying very high capillary pressure values. The reason for this abnor-mal behavior is not yet known; we therefore used only the well-documented experimental data obtained for kerosene, diesel, water, and gasoline. The Bond number was calculated for each fluid pair and soil type, using the given surface tension for each of the four wetting fluids and the density contrast between the wet-ting fluid and air, the mean grain size diameter (d50, the median value of the diameters) as the typical pore size, and setting𝛼 = 𝜋∕2. The experimental data from Nouri et al. (2014) were then analyzed for each soil type separately as shown in Figure 10. This is justified by the large degree of nonuniformity of the differ-ent grain size distributions. The only uniform porous medium is that of the Persian Gulf Sand whose linear trend gives a slope which is the closest to the theoretical one (0.23), although the number of points is lim-ited to allow a precise agreement—only a trend can be evaluated. This limitation is due to the difficulty of changing the fluid pair for every point related to an experiment performed.
As the process relies on disorder in thresholds, a large dispersion from experiment to experiment is expected. Further, the capillary number is assumed to be negligible in the derived relation. In these experiments, this approximation is not necessarily perfectly valid. In addition, the wetting angle is probably different between fluid pairs. Furthermore, the finite size of the sample will influence the final saturation (Moura et al., 2015). Some limitations of classical soil physics experiments to determine large-scale multiphase flow have been discussed in Hunt et al. (2013). Hence, this comparison between this experimental data and the theoreti-cal prediction shows some moderate consistency but stays limited. This does not validate nor invalidate the proposed model in 3-D but rather shows the limitations to apply it in small-scale laboratory experiments. This also shows that large enough systems have to be used experimentally to determine a capillary-pressure relation that can be used in large-scale simulations, or alternatively, that the experimental tests performed should allow to extract the parameters in the model proposed here, such as the average capillary pressure threshold term 2𝛾/R and use the proposed model for the large-scale simulations. Checking better the suit-ability of the proposed model in 3-D in its range of validity could be done using experiments in a centrifuge where gravity is systematically changed, which is a perspective of future work.
Eventually, the general Equation 22 also holds in one dimension (1-D), which is an academically trivial case but interesting to look at for the sake of checking the generality of the arguments. Indeed, in this case, all pores are along a single line and are invaded one after the other from the top. Hence, the final saturation is
1. In such case, D = 1, and since all cells are occupied behind the front (composed of one pore), the fractal dimension of the invaded cluster is also Dc = 1. In this case,𝜈 = 1 (Stauffer & Jayaprakash, 1978) and Equation 22 predicts SF
nw =1independently of Bo, which is in agreement with the fact that all cells along the linear network are eventually occupied with the invader, that is, that indeed SF
nw=1.
6.2. Average Capillary Pressure
Here, we have considered the capillary pressure as determined experimentally, between the outlet at the wetting fluid and the inlet pressure in the nonwetting one. By contrast, in theoretical or numerical studies, the pressure saturation relationship is often expressed for a quantity defined as the difference between the average pressure in one fluid at the representative elementary volume (REV) scale and the average pressure in the other fluid at the same scale (Hassanizadeh & Gray, 1990, 1993a, 1993b; Hassanizadeh et al., 2002; Reeves & Celia, 1996). This average pressure difference can also be approximated for the current simula-tions and experiments, in order to use in simulasimula-tions the quantities determined experimentally. This would allow to use experiments to determine the characteristic capillary threshold (2𝛾/R) present in Equation 14. That could be obtained from experiments, or from the characterization of the capillary threshold distribu-tion f (P) and determinadistribu-tions of the percoladistribu-tion threshold pc: either approximate ones or precise ones by characterization of the pore connectivity and IP simulations on such a network. One could then use the model proposed below in Equation 30 or Equation 31 as a large-scale average capillary-pressure relation-ship in reservoir models, rather than using directly the measured relation ΔP(Snw) in hanging columns as a direct large-scale model of average capillary-saturation relationship.
Since the variation of the pressure under the approximately horizontal interface is hydrostatic, from Equations 9 and 15, the pressure at distance z′from the bottom is thus
P(z′) =P
outlet− Δ𝜌g(sin 𝛼)z′=Pa− ΔP − Δ𝜌g(sin 𝛼)z′=Pa−𝑓−1(pc) + Δ𝜌g(sin 𝛼)(l − z′), (24) with ΔP = Pa−Poutletand l the front average position.
Hence, averaging over the region of the defending fluid connected to the outlet, one can define the average wetting fluid pressure in this zone as ̄P and the difference between the average pressures in the nonwetting fluid and the wetting one, that is, in these experiments between the atmospheric pressure and the average wetting fluid pressure Δ ̄P = Pa− ̄P, obtaining:
̄P = 1 l∫ l 0 P(z′)dz′=P a−𝑓−1(pc) + Δ𝜌g(sin 𝛼) l 2=Pa−𝑓 −1(p c) + 𝛾LBo 2a2 ( 1 −Snw SF nw ) (25) and Δ ̄P =𝑓−1(p c) +𝛾LBo 2a2 (S nw SF nw −1 ) . (26)
Eventually, another way to perform the space average of the pressure in both phases is to consider the whole space, including the trapped fluid region behind the front, and not only the connected fluid con-sidered above. This alternative definition of average wetting fluid pressure can then be defined as ̄P′ =
1
L∫ L
0 ΔP(z′)dz′. In order to evaluate this average, one can approximate the wetting fluid pressure in the
trapped clusters above the front, in the zone where l< z′< L, as the percolating pressure threshold, P(z′) =
Pa−𝑓−1(p c). Thus, ̄P′= l L̄P + ( 1 − l L ) (Pa−𝑓−1(pc)) =Pa−𝑓−1(pc) + Δ𝜌g(sin 𝛼)l 2 2L (27) and Δ ̄P′=P a− ̄P′=𝑓−1(pc) − Δ𝜌g(sin 𝛼) l2 2L =𝑓 −1(p c) +𝛾LBo 2a2 (S nw SF nw −1 )2 . (28) 6.3. Dynamic Effects
Dynamic effects also affect the average pressure gradient and the shape of the interface during drainage. In a situation similar to the one studied so far, that is, with a low viscous fluid invading the cell, so that viscosity destabilizes the front, and the lightest fluid entering on top of the densest fluid, so that gravity stabilizes the
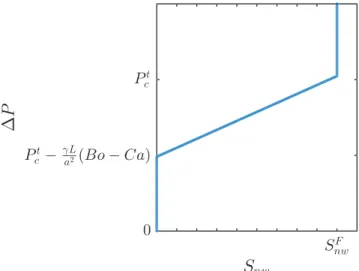
Figure 11. Figure shows our modeled general pressure-saturation law
represented by three linear branches.
front, Méheust et al. (2002) showed that the front root-mean-square width still follows the same scaling law, with a generalized Bond number Bo∗=
Bo − Ca. All the other arguments developed above are expected to hold. Since the results only depend on the average pressure gradient and the presence of the disorder, one thus expects that
SF
nw∝ (Bo − Ca)
[−𝜈∕(𝜈+1)](Dc−D), (29)
when Bo> Ca, that is, when the situation is intrinsically stable. This is expected to hold both in 2-D and 3-D, replacing D by 2 or 3 and Dcand𝜈 by their proper values for each dimension.
In three dimensions, the Bond number is defined as Bo = Δpgrav∕Δpcap, where Δpgravis evaluated in the average flow direction, that is, with v the average flow velocity, Δpgrav=𝜌(g · v)∕v, so that Bo = 𝜌(g · v)a∕(v𝛾). Conversely, when Ca> Bo, the situation becomes unstable, and the front splits in fingers that grow in a ballistic way. In such case, a scaling law can also be obtained between the residual saturation and the system size, as shown in Løvoll et al. (2011). This study also proposed a relationship between pressure and saturation related to this unstable situation. Eventually, the scaling law in Equation 29 allows to propose a track for future applications: Since the residual saturation depends on the capillary number at which a drainage takes place, it can be used as a marker of the flux that took place during this drainage: Measuring the residual saturation and knowing the Bond number (characterizing the fluid densities, surface tension, and pore sizes), this equation allows to estimate
Caduring the drainage. In situations where a drainage took place, this can give a precious estimator to evaluate the conditions at which the flow took place. This could lead to interesting applications in geology, where fluids mix in porous media, as, for example, around a magma reservoirs, in hydrology, or to determine the speed of a past flow during an underground contamination. We propose this as a perspective of future research.
Some limits of this estimation will naturally affect this estimator. Notably, in a few hours, film flow can lower further the residual saturation (as, e.g., shown by Moura et al. 2019), and for longer times, evaporation and transport as vapor phase (Or et al., 2013) will also affect it. This estimator could thus be suitable for fluid pairs where the evaporation and reconfigurations after the first drainage stay limited, such as cases where one of the fluids hardens due to cooling after an initial multiphase flow or in laboratory experiments where the measurements are done shortly after the primary drainage.
6.4. General PS Law Expected for Drainage
Combining Equations 14, 29, and 20, one obtains a general approximate law for primary drainage, arising from the hydrostatic effects in the system, the fractal properties of the trapped clusters and of the invasion front, that can be represented by three linear branches, as displayed in Figure 11.
When ΔP< Pt c−
𝛾L
a2(Bo − Ca), there is no pore invaded and
Stotnw≃0, (30)
where Pt c = 𝑓
−1(p
c)is the capillary pressure threshold whose occupancy probability𝑓(Ptc)is equal to the percolation threshold pcfor the porous media network considered, depending on its connectivity.
When Pt c− 𝛾L a2(Bo − Ca)< ΔP < P t c, ΔP = Pt c+ 𝛾L a2(Bo − Ca) ( Stot nw
[Min(W ∕a, L∕a, (Bo − Ca)−𝜈∕(𝜈+1))](Dc−D) −1
)
, (31)
When ΔP> Pt
c, eventually,
Snw=SFnw≃ [Min(W ∕a, L∕a, Bo
where𝜈 and Dcare the critical percolation exponent and the capillary fingering dimension for the spatial dimension D (3-D or 2-D).
This behavior corresponds to the observed one in the experiments and simulations, in Figures 4, 5, and to the behavior studied in Moura et al. (2015) in the case of Bo = 0, Ca = 0.
In addition, for a system with straight boundaries and exit filters, there is also a curvature at the beginning of the Pressure-Saturation curve and at the end, related to the deformation of the invasion front from an initial straight shape to a shape characteristic of percolation invasion in a gradient close to the inlet and conversely, from such shape to a straight shape against the semipermeable exit filters. Consequently, the entrance pres-sure,R2𝛾
min with R the minimum curvature of the interface in the largest pore throat size, is always smaller than Pt
c. Such effects of curvature are nonetheless related to the initial and final imposed shape of the inter-face in tests and should be absent in a REV in an open system, with no imposed shape of the front at the entrance and exit of that REV. This would be the natural situation for an REV in a reservoir simulation, where neither semipermeable filters are present between REVs nor initial saturation jumps can be found along artificial planar boundaries between REVs. The asymptotic behavior described above in Equations 30, 31, and 32 should then be better adapted for such natural situations. Experimentally determined pres-sure saturation relationships, usually obtained using hanging columns or setups with semipermeable filters at the exit and initially totally saturated, as in the experiments shown here, are subject to such artifacts. They should thus be corrected for these curvatures related to the boundary effects in order to be used in reservoir models.
7. Conclusions
PS relationships are essential in soil science, hydrology, and for other communities who model multiphase flow in reservoirs and porous media using Darcy equations. To quantify PS curves in the laboratory with the porous plate (or diaphragm) method, researchers generally use soil samples with a height of only sev-eral tens of centimeters. The obtained relationships are thus potentially strongly affected by the boundary effects introduced by the semipermeable membrane, depending on the pore sizes and on the Bond number associated to it. In our work, we highlight the influence of gravity on the form of PS curves during primary drainage. The overall pressure difference between the two fluids is therefore influenced by the hydrostatic pressure difference across the wetting fluid phase. For a system unaffected by boundary effects, the PS rela-tion during such drainage is then entirely specified by a characteristic capillary pressure that can be obtained from percolation threshold pcfor the occupancy probability and the cumulative distribution of capillary pressure thresholds f as f−1(p
c), a straight line with a slope given by (𝛾L/a2)BoSFnw, and a final saturation,
SF nw= Bo
[(nu∕(1+nu))(D−Dc)]. We further show in this study that an IP scheme generates PS curves consistent
with experimental measurements on a REV, for varying Bond numbers. By using a pore-scale description of the system under the influence of gravity, we are able to collapse the PS curves onto a single master curve. Furthermore, a functional dependency between the final saturation, the strength of the gravitational com-ponent (Bond number), the correlation length𝜈 from percolation, and the fractal dimension of capillary fingering is obtained for 2-D and 3-D. For the 2-D case we find a good fit with our experimental and numer-ical results. For the 3-D relation we compared with experiments conducted by Nouri et al., which showed a limited compatibility with the predicted relationship and hinted to possible limitations of small-scale exper-iments to obtain large-scale capillary-pressure relationships. This leads to tracks to possible future works in centrifuge to probe further the model in 3-D in its range of validity. Furthermore, knowing the final air saturation obtained from water retention curves, using the theoretical relation of Equation 22, it is pos-sible to predict the final nonwetting saturation when other wetting fluids than water are displaced by air during primary gravity-stabilized drainage. With these elements together, one predicts an approximate cap-illary pressure-saturation relation as function of dimension, capcap-illary and Bond numbers, and of the system dimension. Such prediction is done between the air pressure and wetting fluid pressure measured at the bottom. The theoretically corresponding difference between the average pressures in both phases is also derived. Knowing the pore size distribution and the characteristics of the fluid pair and the wetting proper-ties of the system, our results give a guideline for simulations and upscaling of the saturation from small to large scales.