HAL Id: hal-02887715
https://hal.archives-ouvertes.fr/hal-02887715
Submitted on 2 Jul 2020
HAL is a multi-disciplinary open access
archive for the deposit and dissemination of
sci-entific research documents, whether they are
pub-lished or not. The documents may come from
teaching and research institutions in France or
abroad, or from public or private research centers.
L’archive ouverte pluridisciplinaire HAL, est
destinée au dépôt et à la diffusion de documents
scientifiques de niveau recherche, publiés ou non,
émanant des établissements d’enseignement et de
recherche français ou étrangers, des laboratoires
publics ou privés.
14C activity in dissolved mineral carbon and identified
organic matter in the Loire estuary (France)
Michel Fontugne, Naïma Sadouni, Alain Saliot, Françoise Siclet, Ioanna
Bouloubassi, Christine Hatté
To cite this version:
Michel Fontugne, Naïma Sadouni, Alain Saliot, Françoise Siclet, Ioanna Bouloubassi, et al.. 14C
activity in dissolved mineral carbon and identified organic matter in the Loire estuary (France).
Radioprotection, EDP Sciences, 2002, 37 (C1), pp.C1-775-C1-780. �10.1051/radiopro/2002202�.
�hal-02887715�
14
C activity in dissolved mineral carbon and identified organic matter
in the Loire estuary (France)
M. Fontugne, N. Sadouni1, A. Saliot1, F. Siclet2,1. Bouloubassi1 and C. Hatte
Laboratoire des Sciences du Climat et de l'Environnement, UMR 1572 du CEA/CNRS, Domaine du CNRS, 91198 Gif-sur-Yvette cedex, France
1 Laboratoire de Biogéochimie et Chimie Marines, Université Pierre et Marie Curie,
UMR 7094 du CNRS, 4 place Jussieu, 75252 Paris cedex 05, France
2 EDF R&D, Service Environnement et Production,
6 quai Watier, 78400 Chatou, France
Abstract. Bottom sediments, fluid mud and suspended solids and dissolved mineral carbon were sampled during 8 cruises at dates corresponding to various tidal and hydrological conditions. Evaluation of the organic matter sources in particles and surface sediments into the Loire Estuary has been performed using molecular markers. The results obtained show that the natural organic matter is an admixture of terrigenous and algal components. The terrigenous signature derived from land plants is present in the whole estuary and reflect a uniform dispersal of terrestrial inputs. The production of biogenic material by aquatic photosynthetic organisms is higher in the fluvio-estuarine zone and decreases seaward. In addition to natural organic matter, a contamination from fossil fuels and components derived from pyrolysis has been assessed. Organic carbon in suspended matter and sediments show homogenous 1 4C values (0.3± 0.2Bq/g) confirming a soil origin. At the opposite, 1 4C activity of
dissolved mineral carbon is higher ranging between 150 to 200% of modern carbon activity and clearly indicates a noticeable contribution from reactors. Radiocarbon concentrations decrease seaward and are strongly correlated with salinity reflecting hydrodynamic and stratification processes in the marine estuary.
1. INTRODUCTION
The Loire estuary is of particular interest since it receives the discharges of 14 nuclear reactors located along the Loire river and its tributaries, and contains a large stock of particulate organic matter where 14C can be trapped. Organic matter present in estuaries derived from several sources, both natural and anthropogenic. These various inputs are different in their chemical nature and reactivity with respect to chemical species such as metals and radionuclids. Thus organic components play potentially a key role in the transport of radionuclids between continent and ocean. In order to give insight into the various pools of organic matter, the lipid biogeochemical marker tool has been chosen, which allows to quantify some main components : natural allochthonous derived from continental plants and soils, autochthonous associated with the algal and bacterial activities and anthropogenic, originating from fossil hydrocarbons, from the pyrolysis of organic matter and from faecal contamination. A combination of various markers allows to distinguish between these various contributions. Hydrocarbons, alcohols, sterols and fatty acids are the most commonly used [1,2].
This study aims to estimate 1) the different organic matter contributions, 2) the radiocarbon distribution in the estuary as a function of the different hydrodynamics patterns encountered m the estuary and 3) repartition between the organic and mineral carbon phases in the Loire estuary in order to estimate the importance 1 4C storage in sediments.
Article published by EDP Sciences and available at http://www.radioprotection.org or http://dx.doi.org/10.1051/radiopro/2002202
Cl-776 RADIOPROTECTION - COLLOQUES
2. MATERIAL AND METHODS
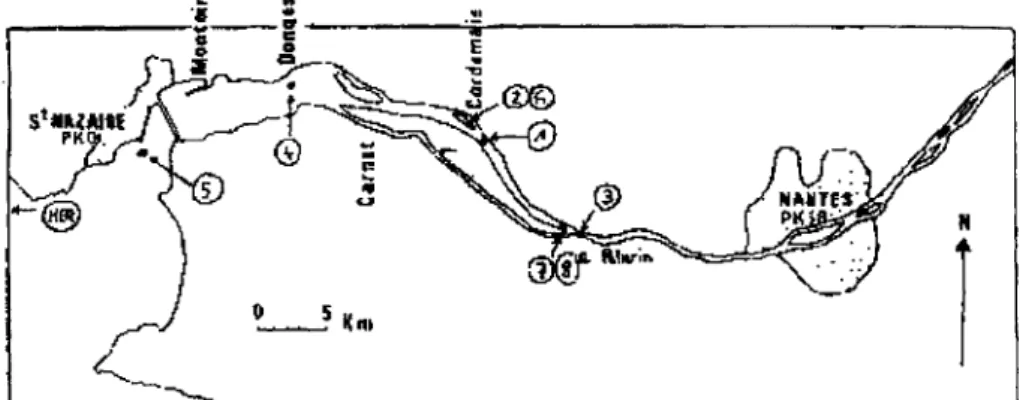
Samples were collected in 1998 and 1999 at different locations in the estuary in order to reflect the different hydrological patterns encountered in the estuary (fig-1). Periods of sampling during 1998 are July (samples 1, and 2) September ( samples 3 and Mer) and in 1999, February (samples 4 and 5), May (samples 6) July (samples 7) and end of September (samples 8).
Figure 1- Location of the sampling sites
2.1. Organic matter identification
At each station, particles obtained by in-situ water pumping and centrifugation, and superficial sedimentscollected using a grab or a surface corer were extracted by a mixture of organic solvents to recover total free lipids. The lipid extract was then separated into various fractions by column chromatography. Each fraction was analysed using a combination of gas chromatography (GC) and GC/mass spectrometry. For details, see Sadouni et al. [3]. The distribution of the various contributions can be first examined along the estuary, as a function of depth, river flow and tide by considering the concentration of the various tracers expressed as a function of total suspended matter or total organic carbon, OC. The latter reference is chosen. Another approach consists to convert some model marker concentrations in organic carbon using conversion factors given in the recent literature, which finally permits to evidence the respective changes in the organic matter speciation along the estuary with reference to OC. Conversion factors selected here are: long-chain fatty acids in the carbon range 24-30 for the natural allochthonous terrestrial inputs [4], polyunsaturated fatty acids with 20 and 22 carbon atoms for the algal carbon [5], branched fatty acids with 15 and 17 carbon atoms for the bacterial carbon [4], and the sterol coprostanol for the faecal carbon [6]. The difference between the total organic carbon and the sum of the characterised fractions, named mixed, consists of mixed inputs, anthropogenic contributions and macromolecular compounds.
2,2Isotopicstudies
Water samples were poisoned using HgCl2 to prevent bacterial degradation of organic matter. Carbon dioxide was extracted from waters using procedures described by Bard et al. [7]. Stable carbon isotopic ratios of organic matter and total dissolved inorganic carbon (DIC) were measured using VG Optima mass spectrometer. Results are expressed versus PDB standard with an absolute precision of 0.1 %0 for organic samples and 0.15%0 for DIC. Organic carbon contents were measured using a Carlo Erba NA 1500 Elementary Analyser with a relative precision of 1%. 1 4C activity of DIC was determined using Accelerator Mass Spectrometry (AMS) facilities at Gif and 1 4C activity of particulate organic matter and sediment was measured using B-counting method. Results are expressed in Percent Modern Carbon [8] (100% pMC is the 1 4C activity of year 1950 equivalent to 0,226Bq/g).
3, RESULTS AND DISCUSSION 3.1 Organic matter characterization
The results obtained show that the natural organic matter is an admixture of terrigenous, algal and microbial components. The terrigenous signature as a function of organic carbon is present in the whole estuary and reflects a uniform dispersal of terrestrial inputs. The production of biogenic material by aquatic microorganisms is high in the fluvio-estuarine zone and decreases seawards. In addition to natural organic matter, a contamination from fossil oils and components derived from pyrolysis is also present. The distribution profiles of inputs from fossil oils show a relatively homogeneous input along the estuary with some snap shots in the internal part of the estuary. Concentrations of coprostanol vary by a factor of ~6 along the estuary, with snap shots in the internal estuary.
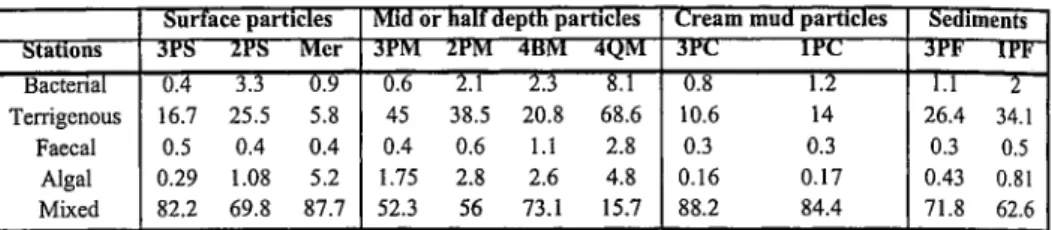
Table 1 shows the contributions of different characterisable organic matter components to the total organic carbon in %. The natural terrigenous component is predominant in all types of particle, but highly variable, from a few to ~ 70% of OC. The vertical distribution of this component evidences its high correlation with fine particles at mid-depth. The marine reference is characterised by a rather low contribution due to the dilution by the algal marine carbon. The terrigenous component shows marked differences by a factor of 3 between high tide and low tide during high flood in the internal estuary. In sediments we notice an enrichment at Le Pellerin (26%) and at Cordemais (34%). The algal component derived from photosynthesis of diatoms varies between 0.1 and ~ 5% of OC. Higher values are found in the surface particles at the marine reference, whereas lower values are observed in bottom particles. Small-size particles at mid-depth are also characterised by a high biological activity as found for the terrigenous component. The total phytoplanktonic component evaluated from chlorophyll a concentrations is higher, from 5 to up to 30%, enhancing that other microorganisms than diatoms can develop in different part of the estuary. The bacterial component represents 0.4 to ~ 8% of OC. Higher variations occur in mid-depth particles with a maximum at high flood at the marine reference. There is a good correlation between algal and bacterial components. The faecal carbon is low, less than 3% along the estuary.
Cl-778 RADIOPROTECTION - COLLOQUES
Table 1- Contributions of different characterisable organic matter components to the total organic carbon in %. Surface particles Mid or half depth particles Cream mud particles Sediments
Stations 3PS 2PS Mer 3PM 2PM 4BM 4QM 3PC I P C JPF 1PF" Bacterial Terrigenous Faecal Algal Mixed 0.4 3.3 0.9 16.7 25.5 5.8 0.5 0.4 0.4 0.29 1.08 5.2 82.2 69.8 87.7 6.6 2.1 2.3 8.1 45 38.5 20.8 68.6 0.4 0.6 1.1 2.8 1.75 2.8 2.6 4.8 52.3 56 73.1 15.7 Ô.8 1.2 10.6 14 0.3 0.3 0.16 0.17 88.2 84.4 1.1 2 26.4 34.1 0.3 0.5 0.43 0.81 71.8 62.6
3.2 Dissolved inorganic carbon
Results are reported in table 2. Different procedures were used during sampling, however no differences between centrifuged, filtered or not filtered samples were observed. 51 3CDIC ranges between -0.1 (marine source) and -17.6%o. Four samples (2PM,4BM, 6PF 7PS) were obviously contaminated due to a incomplete poisoning. Sample 3PC was also discarded because of contamination by carbonate micro-particles. According to previous studies [9], 81 3CDIC is strongly correlated (r=0.95, n=30) with salinity reflecting mixing between marine and fluvial waters.
Table 2 - Organic carbon contents, 1 4C activity and stable carbon isotope composition of dissolved inorganic carbon (DIG),
suspended particulate organic matter and sediments. Nomenclature of sample: P &Q and B refer to high and low tide respectively, F & J for intermediate patterns. S, M, C, F refers to surface, half-depth, mud cream, bottom (sediment) samples respectively. D i s s o l v e d I n o r g a n i c C a r b o n P a r t i c u l a t e O r g a n i c C a r b o n S e d i m e n t s Sample pMC % 6" C %o Sample %Corg p M C % s"c %. Sample %Corg pMC % s"c 1. 1PM 1 2 7 . 8 ± 0 . 9 - 6 . 8 1 1 P C 4 . 1 1 2 4 . 6 ± 0 . 6 - 2 6 . 6 2 P A I M B O E U F 1 P S 1 3 4 . 2 1 0 . 9 - 9 . 0 5 1 P F 2 . 9 1 3 3 . 0 ± 1 . 2 - 2 6 . 0 2 1CP0 2 . 3 1 2 5 . 7 t 0.5 •25.10 2 P M 1 8 5 . 4 ± 1.1 - 1 1 . 5 8 1 P M 3 . 2 1 2 4 . 5 ± 0 . 9 - 2 5 . 7 5 1 C P 2 1.9 1 2 1 . 1 ± 0.8 .26.01 2 P S 1 8 8 . 9 ± 1 - 9 . 2 8 1 P S 3 . 8 1 2 8 . 5 ± 0 . 9 - 2 8 . 3 0 1 C P 3 0 . 7 8 6 . 4 t 0.5 •25.S« 3 P C 1 6 0 . 2 i 1.3 - 3 . 4 6 2 P C 2 . 9 1 2 6 . 1 ± 0.7 - 2 6 . 5 5 1 C P 4 0 . 6 8 7 . 5 1 0.7 •25.51 3PM (Filtré) 1 8 2 . 2 ± 1.1 - 1 0 . 4 4 2 P F N D 1 2 7 . 4 ± 0.7 - 2 5 . 6 3 M I G R O N 3 P S ( A p . Centrif.) 1 7 9 . 8 ± 1 . 2 • 1 0 . 4 5 2 P M 3 . 0 1 2 9 . 8 ± 0.5 - 2 5 . 5 8 1 C M 1 2 . 2 1 2 8 . 0 ± 0.5 .25.09 3 P S (Av. Centrif.) 1 8 2 . 9 i 1.1 - 1 0 . 3 3 2 P S 3 . 1 1 3 8 . 0 ± 0.7 - 2 5 . 6 8 1 C M 2 N D 1 2 4 . 8 1 0.6 •26.00 3 P S (Filtré) 1 8 2 . 9 1 1 - 1 0 . 3 8 3 P C 4 . 0 1 3 8 . 6 ± 0.3 - 2 6 . 6 5 1 C M 3 3 . 1 1 2 6 . 9 ± 0.6 -26.25 •IBM 1 1 5 . 6 ± 0 . 8 - 1 4 . 7 6 3 P F 2 . 9 1 2 6 . 4 ± 0.5 - 2 5 . 6 5 B E L L E V U E 4 Q C 1 2 3 . 4 t 0.9 - 6 . 1 6 3 P M 2 . 3 1 4 9 . 1 1 0.9 - 2 6 . 3 2 B . 1 2 . 8 1 3 8 . 4 t 0.5 •26.30 4 Q F 1 3 3 . 4 t 1 . 8 - 1 0 . 1 5 3 P S 2 . 3 1 4 7 . 6 ± 0 . 6 - 2 6 . 6 3 B. 2 P O N T A M O N T 2 . 1 1 3 2 . 4 t 0.5 •26.01 4 0 . M 1 1 5 ± 0.8 - 3 . 5 4 4 8 M 3 . 4 1 3 3 . 5 ± 0 . 7 - 2 6 . 0 1 T H O U A R É 4 Q S 1 3 5 . 5 ± 0 . 9 - 9 . 9 9 4 Q C 1.7 1 3 3 . 5 ± 0 . 7 - 2 6 . 3 1 T H O U A R E 1 2 . 3 1 4 9 . 8 t 0.9 •25.09 5 J S 1 1 0 ± 0 . 8 - 3 . 6 1 4 Q F 2 . 2 1 3 1 . 4 ± 0 . 7 - 2 6 . 4 3 T H O U A R E 2 N D 1 2 4 . 1 t 0.9 r.l 5 P C 1 1 5 . 3 ± 0 . 8 2 . 0 0 4 Q M 1.1 1 2 5 . 0 ± 0 . 6 - 2 6 . 3 0 T H O U A R E 3 2 . 1 1 5 3 . 1 i 0.7 •26.50 5 P S 1 0 9 . 8 ± 0.8 - 4 . 1 1 5 J S 0 . 7 1 1 6 . 7 t 0 . 8 - 2 7 . 5 6 T H O U A R E 4 1.9 1 3 9 . 6 ± 0.9 •26.07 6FM 1 5 2 ± 1 - 1 0 . 0 6 5 P C 2 . 4 1 2 9 . 6 t 0 . 6 - 2 6 . 1 4 T H O U A R É 6 P C 1 3 4 . 2 ± 0 . 9 - 1 2 . 0 4 5 P F 2 . 5 1 2 6 . 6 ± 0 . 5 - 2 5 . 8 6 P A I M B O E U F C H . 6 P F 1 6 1 . 3 t 1.1 - 1 7 . 4 6 5 P S 2 . 6 1 2 5 . 0 ± 0 . 8 - 2 7 . 2 9 1 C Q 2 1.4 1 2 8 . 7 ± 0.6 •26.66 6 P M 1 3 9 . 4 t 0 . 8 - 1 0 . 3 9 6 F M 2 . 0 1 2 1 . 1 ± 0 . 4 - 2 6 . 3 9 M E R 6 P S 1 4 4 . 6 ± 0 . 9 - 1 0 . 3 7 6 P C 1.8 1 2 7 . 2 ± 0.6 - 2 6 . 5 6 M E R 3 . 3 1 0 1 . 9 ± 0.6 •20.06 7FM 1 9 4 . 4 ± 1 9 . 8 6 6 P F 2 . 4 1 2 3 . 8 0.7 - 2 6 . 5 8 C a n . M a r t i n l e r e 7 F S 1 9 2 . 8 ± 1.1 - 9 . 6 8 7 F M 2 . 6 1 2 9 . 9 ± 0 . 6 - 2 6 . 5 1 3 C E 1 2 . 7 1 2 7 . 6 ± 0.9 -25.94 7 P C 1 5 6 . 9 ± 0 . 9 - 1 1 . S 3 7 F S 2 . 5 1 3 3 . 1 ± 0 . 6 - 2 6 . 4 7 3 C E 2 1.2 1 1 6 . 3 ± 0.7 -26.49 7 P M 1 9 4 . 1 ± 1.1 - 1 0 . 2 4 7 P C 2 . 6 1 2 7 . 2 ± 0.6 - 2 5 . 9 9 3 C E 3 2 . 0 1 3 2 . 0 ± 0.9 •25.86 7 P S 1 4 9 . 4 ± 1 - 1 5 . 9 5 8 B C 2 . 9 1 3 1 . 3 t 0 . 4 - 2 6 . 4 0 C h e n . N a v i g a t i o n -25.41 8BM 1 2 8 . 3 ± 0 . 9 - 1 0 . 1 6 8 B F 2 . 1 1 3 2 . 1 1 0 . 6 - 2 6 . 1 8 3 C F 1 1.3 9 6 . 8 t 0.7 -25.41 8 F M 1 5 3 . 2 ± 1 - 1 0 . 7 2 8 F M 3 . 5 1 3 3 . 1 ± 0 . 5 - 2 6 . 4 2 4 C F 1 2 . 3 1 2 4 . 2 i 0.4 •26.05 8 F S 1 3 4 . 4 ± 0 . 8 - 9 . 5 6 8 F S 3 . 4 1 3 7 . 1 t 0.4 - 2 6 . 2 9 4 C G 1 2 . 0 1 2 3 . 0 1 0.6 •26.14 S P C 1 4 6 . 7 t 1 - 1 0 . 4 5 8 P M 2 0 6 . 4 ± 1 - 1 0 . 6 5 B P S 2 0 3 . 3 ± 1.2 - 1 1 . 0 8 MER 1 0 7 . 2 1 0 . 7 - 0 . 1 9
l4CDic activity varies between 107 and 206% the highest values being encountered for low salinity waters. Excluding the marine value (MER sample) the mean value is 154,6%. Due to stratification of water at the mouth of estuary, surface samples activity present higher activity than bottom ones that reflect marine influences. Due to diversity of hydrological pattern and sampling periods (different tide periods, flood or low water) no relationship between our 1 4C data and hydrological parameters may be established, however it can be considered as a general rule that water 1 4CDi c activity decreases with increasing salinity. All the l 4CDi c values are higher than the present natural equilibrium value (PMc=l 10) between atmospheric C 02 and fluvial waters, and, higher than surface marine waters <pMC =105). These observations clearly indicate 1 4C inputs from the nuclear reactors located upstream in the Loire river.
3 . 3 Organic carbon in suspended matter and sediments
Results are reported in table 2. Organic carbon contents of suspended matter ( S M ) range from 0.7 to 4,1% with a mean value of 2,6% in good agreement with concentrations measured [10] in the macro-tidal Gironde estuary ( S W France). The L 4C activity in organic carbon of sediment and suspended matter
(SM) show smaller variations compared to 1 4CDIC activity and range between 86,5 to 153 and 116,7 to 149,1% respectively. The mean values from surface sediment and suspended matter are quite similar:130.3 ± 9.8 %o and 130.4± 6.9% respectively. The generd trend, as observed for I 4CDIC, is that deep SM samples present lower 1 4C activity compared to surface water ones. This is in agreement with what is known about estuarine dynamics (re-working of surface sediments, mixing between old S M of the "bouchon vaseux" and recently produced organic matter, and re-deposition). The 1 4C activity of organic carbon is significantly lower than that observed from dissolved inorganic carbon but higher than present atmospheric I 4C activity (110%). This results from the mixing of S M from different origins: soil erosion, vegetation production on the river-banks and phytoplankton, marine organic carbon and erosion of the geological substratum. These different sources, contributing with unknown proportions to the S M load, have different radiocarbon activity ranging from 0% (geological formation) to 200%o from soils which have been formed at the beginning of the sixties' during the atmospheric thermonuclear experiments. However, comparison with 1 4C activities measured [11] in sediment and S M of the Gironde suggested that Loire estuary S M are predominantly from pedological origin.
4. C O N C L U S I O N S
The distribution of 1 4C in the Loire estuary clearly shows that organic and mineral carbon are differently affected by 1 4C releases from nuclear reactors. Mineral carbon (DIC) show higher C activity ranging between 100 and 200% of pre-nuclear period natural abundance. The 1 4C distribution is strongly linked with salinity variation reflecting mixing processes between marine and fluvial waters. Radiocarbon concentrations in water depend on stratification processes in the estuary and amplitude of tide and river flow. At the opposite, organic carbon in surface sediment and suspended matter present radiocarbon activity rather constant compatible with that given by recent soil erosion. The lower C activity values compared to the dissolved organic carbon suggest that phytoplankton recently produced has not a significant input in the organic matter stock or is weakly affected by 1 4C from nuclear origin. These
Cl-780 RADIOPROTECTION - COLLOQUES
latter points are supported by the predominance of organic matter derived from continental plants and soils and a rather limited contribution for algae and microorganisms.
The study was supported by Contrat Collaboration EDF/CNRS (Electricité De France/ Centre National de la Recherche Scientifique).
References
[I] Yunker, M.B., Macdonald R.W., Veltkamp D.J. and Cretney W.J., Mar. Chem. 49 (1995) 1-50. [2] Saliot A., Derieux S., Sadouni N., Bouloubassi L, Filiaux J., Dagaut J., Momzikoff A., GondryG., Guillou C , Breas O., Cauwet G. and Déliât G., Estuar. Coast Shelf Sci.(2001) in press.
[3] Sadouni N., Saliot A. and Bouloubassi I. Caractérisation de la matière organique dans les particules et les sédiments de l'estuaire de la Loire. Rapport du projet Radioécologie Loire et Estuaire (2001) 43 pp.
[4] Canuel E.A. and Martens C.S., Org. Geochem. 5 (1993) 563-577.
[5] Volkman J.K., Jeffrey, S.W., Nichols, P.D., Rogers, G.I. and Garland, C D . , J. expMar. Biol. Ecol. 128 (1989) 219-240.
[6] Quéméneur, M. Devenir des acides gras et des sterols issus des effluents urbains après leur rejet dans les environnements littoraux. Thèse 3e m e cycle de l'Université de Bretagne occidentale, Brest, (1992) 231 pp.
[7] Bard E., Arnold M., Toggweiler J.R., Maurice P., Duplessy J-C, Radiocarbon 31 (1989) 5 1 0 5 2 2 . [8] Stuiver M., Pollach H., Radiocarbon 19 (1977) 355-363.
[9] Duplessy J.C. (1972) La géochimie des isotopes stables du carbone dans la mer. Thèse Univ. Paris 6, 196 pp.
[10] Fontugne M.R., Jouanneau J.M., Estuar. Coast. Shelf Sci. 24 (1987) 377-387. [II] Jouanneau J.M., Mar. Chem. 21 (1987) 189-197.