HAL Id: hal-01233139
https://hal.archives-ouvertes.fr/hal-01233139
Submitted on 3 Jul 2017
HAL is a multi-disciplinary open access
archive for the deposit and dissemination of
sci-entific research documents, whether they are
pub-lished or not. The documents may come from
teaching and research institutions in France or
abroad, or from public or private research centers.
L’archive ouverte pluridisciplinaire HAL, est
destinée au dépôt et à la diffusion de documents
scientifiques de niveau recherche, publiés ou non,
émanant des établissements d’enseignement et de
recherche français ou étrangers, des laboratoires
publics ou privés.
Syndecan-1 alters heparan sulfate composition and
signaling pathways in malignant mesothelioma
Ghazal Heidari-Hamedani, Romain R Vivès, Amal Seffouh, Nikolaos A
Afratis, Arie Oosterhof, Toin H van Kuppevelt, Nikos K Karamanos, Muzaffer
Metintas, Anders Hjerpe, Katalin Dobra, et al.
To cite this version:
Ghazal Heidari-Hamedani, Romain R Vivès, Amal Seffouh, Nikolaos A Afratis, Arie Oosterhof, et al..
Syndecan-1 alters heparan sulfate composition and signaling pathways in malignant mesothelioma.
Cellular Signalling, Elsevier, 2015, 27 (10), pp.2054-67. �10.1016/j.cellsig.2015.07.017�. �hal-01233139�
Syndecan-1 alters heparan sulfate composition and signaling pathways
in malignant mesothelioma
Ghazal Heidari-Hamedani
a,⁎
, Romain R. Vivès
b,c,d, Amal Seffouh
b,c,d, Nikolaos A. Afratis
e, Arie Oosterhof
f,
Toin H. van Kuppevelt
f, Nikos K. Karamanos
e, Muzaffer Metintas
g, Anders Hjerpe
a,
Katalin Dobra
a, Tünde Szatmári
aaKarolinska Institutet, Department of Laboratory Medicine, Division of Pathology, Stockholm, Sweden bUniversity of Grenoble Alpes, IBS, F-38044 Grenoble, France
c
CNRS, IBS, F-38044 Grenoble, France
d
CEA, IBS, F-38044 Grenoble, France
e
University of Patras, Department of Chemistry, Biochemistry, Biochemical Analysis & Matrix Pathobiology Res. Group, Lab. of Biochemistry, Patras, Greece
f
Radboud University Medical Centre, Radboud Institute for Molecular Life Sciences, Department of Biochemistry, Nijmegen, The Netherlands
g
Eskisehir Osmangazi University Medical Faculty, Department of Chest Diseases, Eskisehir, Turkey
a b s t r a c t
a r t i c l e i n f o
Article history: Received 18 May 2015
Received in revised form 20 July 2015 Accepted 20 July 2015
Available online 23 July 2015 Keywords:
Syndecan-1
Malignant mesothelioma Transcription factor
Mitogen-activated protein kinase (MAPK) Receptor tyrosine kinase
Syndecan-1 is a proteoglycan that acts as co-receptor through its heparan sulfate (HS) chains and plays important roles in cancer. HS chains are highly variable in length and sulfation pattern. This variability is enhanced by the SULF1/2 enzymes, which remove 6-O-sulfates from HS. We used malignant mesothelioma, an aggressive tumor with poor prognosis, as a model and demonstrated that syndecan-1 over-expression down-regulates SULF1 and alters the HS biosynthetic machinery. Biochemical characterization revealed a 2.7-fold reduction in HS content upon syndecan-1 over-expression, but an overall increase in sulfation. Consistent with low SULF1 levels, trisulfated disaccharides increased 2.5-fold. ERK1/2 activity was enhanced 6-fold. Counteracting ERK acti-vation, Akt, WNK1, and c-Jun were inhibited. The net effect of these changes manifested in G1 cell cycle arrest. Studies of pleural effusions showed that SULF1 levels are lower in pleural malignancies compared to benign con-ditions and inversely correlate with the amounts of syndecan-1, suggesting important roles for syndecan-1 and SULF1 in malignant mesothelioma.
© 2015 The Authors. Published by Elsevier Inc. This is an open access article under the license CC BY-NC-ND (http://creativecommons.org/licenses/by-nc-nd/4.0/).
1. Introduction
Syndecans are transmembrane heparan sulfate proteoglycans (HSPGs) that contain a core protein with a large N-terminal extracellu-lar domain to which heparan sulfate (HS) chains covalently attach
[1–3]. HSPGs play crucial roles as co-receptors in various signaling path-ways by cooperating with receptor tyrosine kinases (RTKs) and altering signal transduction[2,4,5]. The HS chains of syndecans act as high af fin-ity binding sites for various soluble growth factors, such asfibroblast growth factor (FGF), vascular endothelial growth factor (VEGF), and heparin binding-epidermal growth factor (HB-EGF), and facilitate their presentation to receptors[6–8]. These interactions between HS and biological effectors modify the stability, availability, and/or activity of HS binding partners by affecting their local concentrations and controlling their diffusion[9,10]. HS chains consist of repeating disac-charide units of N-acetyl-glucosamine (GlcNac) and uronic acid (glucu-ronic acid, GlcA, or idu(glucu-ronic acid, IdoA) bound to serine residues on the
core proteins through a tetrasaccharide linkage. Synthesis of the HS chain continues with chain elongation, followed by a series of enzymatic mod-ifications, including deacetylation, epimerization, and sulfation, which re-sult in broad diversity in the HS structure and lead to a varying capacity to bind molecules, such as growth factors, cytokines, chemokines, enzymes, matrix proteins, and numerous cell surface receptors[11]. In addition, several post-synthetic changes can occur at the cell surface and affect HS structure and function: i) fragmentation of HS by heparanase into oligosaccharides of different lengths, regulating the release of HS-bound ligands[12]; ii) selective removal of the 6-O-sulfate groups from HS chains by the two isoforms of extracellular endosulfatases, SULF1 and SULF2; and iii) shedding of the core protein ectodomain with the HS chains from the cell surface by sheddases. The shed syndecans may act as competitive inhibitors for membrane HSPGs or alter growth factor gra-dients in the neighborhood of the cell[13].
Syndecan-1 (SDC1) has dual roles in different cancer types by being either an inhibitor or promoter of tumor progression[14]. It is involved in cell proliferation, adhesion, migration, and angiogenesis, but its ex-pression diverges in various tumor types[14–16]. Generally, SDC1 ex-pression is higher in epithelial malignancies than in mesenchymal
⁎ Corresponding author.
E-mail address:Ghazal.heidari.hamedani@ki.se(G. Heidari-Hamedani).
http://dx.doi.org/10.1016/j.cellsig.2015.07.017
0898-6568/© 2015 The Authors. Published by Elsevier Inc. This is an open access article under the license CC BY-NC-ND(http://creativecommons.org/licenses/by-nc-nd/4.0/).
Contents lists available atScienceDirect
Cellular Signalling
tumors. Modification of the 6-O-sulfate content of HS has also been as-sociated with altered biological properties and tumor progression, with 6-O-sulfation being crucial in growth factor binding and activity such as shown for FGF, where 6-O-sulfation is essential for the formation of the FGF2/FGFR/HS signaling complex and its mitogenic activity[17–20]. Studies have implied that, similar to SDC1 levels, SULF1 levels are dys-regulated in cancer. The action of SULF1 may be also different in the con-text of tumors; in some tumor types SULF1 expression is decreased, whereas in others it is increased[10]. Because SDC1 acts by binding a wide range of heparin-binding growth factors and their corresponding receptors through its polysaccharide chains[21–24], HS chain modi fica-tions should be studied in different tumor types.
Malignant mesothelioma (MM) is one of the most aggressive mes-enchymal tumors. It is difficult to diagnose, and has poor prognosis
[25]. SDC1 expression is generally low in MM compared to epithelial cancers, and its expression in these tumors correlates with epithelioid differentiation and better prognosis[26]. Previously, we showed that over-expression of SDC1 has profound effects on the main signal trans-duction pathways in a mesothelioma cell line, regulating cell growth and cell cycle progression. Enzymes important to the HS sulfation pattern were also affected by SDC1 over-expression[27], leading to the hypothesis that higher SDC1 levels may result in HS structural rear-rangements, which in turn affect the growth factor binding properties of the whole HSPG pool. These alterations may contribute to the effects of SDC1 on cell proliferation and cell cycle distribution.
The aim of this study was to examine in detail the effect of SDC1 on the HS chain composition of proteoglycans and the mechanisms through which these changes subsequently affect signaling pathways in mesothelioma cells. To verify the general applicability of ourfindings at clinical level, we monitored the relationship between soluble SDC1 and SULF1 in pleural effusions from cancer patients.
2. Materials and methods
2.1. Cell line and cell culture conditions
Human malignant mesothelioma cells with epithelioid morphology (STAV-AB) were used. This cell line was chosen based on its low endog-enous SDC1 expression[28]. Cells were grown in RPMI 1640 Glutamax medium (Life Technologies Inc., Paisley, UK) supplemented with 10% human AB serum. Incubation was performed in a humidified atmo-sphere containing 5% (v/v) CO2 at 37 °C. SDC1 was stably
over-expressed by transfection with a plasmid vector carrying the human full-length SDC1 gene as described previously[29]. Cells transfected with the same plasmid vector carrying no constructs were used as negative mock controls in all experiments. Stable overexpression was obtained by Geneticin selection (G418; Roche Diagnostics GmbH, Mannheim, Germany).
2.2. Microarray analysis
Microarray analysis of STAV-AB cells over-expressing SDC1 vs. cells transfected with empty vector was performed using the GeneChip® Human Gene 1.0 ST Array (Affymetrix Inc., Santa Clara, CA, USA) as de-scribed previously[27]. A fold change of≤1.5 or N1.5 and differential ex-pression were considered with a q-value of≤0.05.
2.3. Reverse-transcription polymerase chain reaction
Quantitative real-time reverse-transcription polymerase chain reac-tion (qRT-PCR) was used to investigate the expression of different genes involved in HS chain synthesis and different HSPGs. Total RNA was isolated from sub-confluent cells using the high pure RNA isolation kit (Roche, Mannheim, Germany) according to the manufacturer's instruc-tions. The yield and purity of the RNA were estimated spectrophotomet-rically by measuring the UV absorbance at 260 and 280 nm with a
NanoDrop spectrophotometer (NanoDrop Technologies Inc.). cDNA was synthesized using afirst strand cDNA synthesis kit (Amersham Pharmacia Biotech., Little Chalfont, Buckinghamshire, UK). Three independent RNA isolates were reverse transcribed for the subsequent qPCR using the Platinum® SybrGreen qPCR SuperMix-UDG kit (Invitrogen, Carlsbad, CA, USA). The primer sets for target genes were obtained from CyberGene AB (Sweden) (Table 1). Primers were designed using Primer3 software (Steve Rozen, Helen J. Skaletsky, Primer3,http://www-genome.wi.mit. edu/genome_software/other/primer3.html.,1998)and gene sequences from GenBank (NCBI). All reactions were performed in a total volume of 10μL in an iCycler machine (BioRAD) in triplicate. The relative quantity of each target was normalized to GAPDH as a reference gene using the ΔΔCt method.
2.4. Preparation and disaccharide analysis of heparan sulfate chains by reverse-phase ion-pair high-performance liquid chromatography (RPIP-HPLC) analysis
Preparation and purification of HS chains from cells over-expressing SDC1 and control STAV-AB cells were performed as described previous-ly[30,31]. Briefly, cell culture medium was collected and cell layers ex-tensively digested with trypsin (50 min at 37 °C). After centrifugation, supernatants were applied to a DEAE-Sephacel column (2 mL) equili-brated in 20 mM phosphate pH 6.5. The column was then extensively washed with 20 mM phosphate pH 6.5 and 0.3 M NaCl. GAG chains were step-eluted with 20 mM phosphate pH 6.5 and 1 M NaCl. Recov-ered samples were desalted over a Pd-10 column, lyophilized, and stored at−20 °C prior to analysis.
GAG samples were resuspended in 100 mM sodium acetate (pH 7.1) and 0.5 mM calcium and HS were exhaustively digested to disaccha-rides by incubation with heparinase I (10 mU, Grampian enzymes, Orkney, UK) overnight at 30 °C, followed by a second incubation with heparinase II and heparinase III (10 mU each, Grampian enzymes) for 24 h at 37 °C. Compositional analysis was then performed by RPIP-HPLC as described previously[32]. Samples were applied to a Luna 5u C18 reversed phase column (4.6 × 150 mm, Phenomenex) equilibrated at 1.1 mL/min in 1.2 mM tetra-N-butylammonium hydrogen sulfate and 8.5% acetonitrile, and then resolved using a NaCl gradient (0–8 mM in 10 min, 8–30 mM in 1 min, 30–56 mM in 11.5 min, 56–106 mM in 1.5 min, and 106 mM for 6 min) calibrated with disaccharide standards (Calbiochem). On-line post-column disaccharide derivatization was achieved by the addition of 2-cyanoacetamide (0.25%) in NaOH (0.5%) at aflow rate of 0.35 mL/min, followed by fluorescence detection (exci-tation 346 nm, emission 410 nm). Due to a low amount of recoverable material, HS purification and digestion were performed by pooling ex-tracts from three independent cultures.
Table 1
Primer sequences used for qPCR.
Gene ID Primer sequences (5′ to 3′) Product length
HS6ST1 CAAGACGCAGTACCTGTTCG TACAGCTGCATGTCCAGGTC 243 HS2ST1 ATGGGGCTCCTCAGGATTAT GCTCAATTTCTCGGACTTCG 163 PAPSS1 GCTGGACAAAGGATGACGAT TCCTTCCCTGTTTCTGGATG 239 PAPSS2 AGGTCTCTCTGGTGCTGGAA GCTTAGCCACCTCAGCAATC 182 EXT1 TCAACACCATCCCTCCTCTC ACAGCGAGAATCCTTGTGCT 179 NDST1 CCCAGTGGCCCTAAAGTACA GCACCATGTCCATCACTTTG 212 SULF1[27] AAGGTTAATCAGCCCCGTCT/ ACCAAGAACCCGTCACTTTG 227 GAPDH[76] ACATCATCCCTCTACTGG AGTGGGTGTCGCTGTTGAAGTC 260
2.5. High-performance capillary electrophoresis (HPCE) analysis
Preparation and enzymatic degradation of cells' over-expression SDC1 and control STAV-AB cells were performed by detaching the cells, and after removing the medium, digesting them for 6 min in 0.05% trypsin at 37 °C. The mixture was centrifuged at 2200 g and the trypsin-resistant proteoglycans in the pellet further digested in a 20 mM acetate buffer (pH 7.0) containing 1μmol calcium acetate and 0.3 units each of heparinase I (heparin lyase I, EC 4.2.2.7), heparinase II (heparin lyase II, no EC number), and heparinase III (heparin lyase III, EC 4.2.2.8) per milligram of polysaccharide (dry weight) at 37 °C overnight[33]. Enzymatic degradation was terminated by boiling the samples for 1 min. After 10 min of centrifugation at 13,000 g, superna-tants were analyzed by HPCE. Analysis was performed on an HP3DCE
in-strument (Agilent Technologies, Waldbronn, Germany) with a diode array detector. Separation and analysis were carried out on an uncoated fused silica capillary tube (50μm i.d., 64.5 cm total length, 56 cm effec-tive length) at 25 °C. The operating buffer for HS standard disaccharides and sample analysis was 15 mM sodium orthophosphate/phosphoric acid buffer at pH 3.5filtered through a 0.2-μm membrane filter and degassed in an ultrasonic bath. Electrophoresis was performed at 30 kV reversing polarity[34]. Before each run, the capillary tube was washed with 0.1 M NaOH for 1 min, with water for injection for 2 min, and with the operating buffer for 5 min. After each analysis, the capillary was post-conditioned with water for 2 min.
The operating buffer replenishment mode of the CE instrument was used during electrophoresis. Samples were introduced hydrodynami-cally using the pressure injection mode. Detection was performed at 232 nm[35]. Peak areas were recorded and evaluated using the HP Kayak XA software system HP3DCE ChemStation. Identification and
quantification of the Δ-disaccharide content in samples were performed using precisely known amounts of disaccharide standards dissolved in heparanase digestion buffer as working solutions. Heparinases, all from Flavobacterium heparinium, and the HS-derivedΔ-disaccharide standards were purchased from Sigma (St. Louis, MO, USA).
2.6. Fluorescence activated cell sorting (FACS) analysis
2.6.1. Detection of heparan sulfate-modulating enzymes, ERK1/2, Akt, and ETS-1 expression and activity
For cell surface staining, cells were detached using an enzyme-free cell dissociation buffer (Gibco, 13151-014) for 15 min, and then were scraped if necessary. Cells were collected, counted, andfixed in 2% buffered form-aldehyde. Incubation with primary antibodies against total and phosphor-ylated ERK1/2, Akt, and ETS-1 or corresponding isotype controls at the same concentration (Table 2) was performed for 40 min at 4 °C. After washing, cells were stained with Alexa 488-conjugated goat anti-rabbit
or goat anti-mouse secondary antibody for 15 min at room temperature (RT). Intracellular staining was performed by detaching the cells using a 0.05% trypsin-EDTA dissociation reagent (Gibco, 15400-054) for 3 min. Cells werefixed and permeabilized with 2% formaldehyde, followed by 90% methanol for 10 min, and the same staining protocol used as de-scribed above.
Before growth factor stimulation, cells were starved overnight in a serum-free medium before staining and were incubated for 6 h in a me-dium supplemented with VEGF and PDGF-AB (5 ng/mL, Peprotech, NJ, USA) or 5 min with FGF2 (10 ng/mL, PeproTech, NJ, USA).
2.6.2. Sulfatase-1 activity assays
The expression of different HS epitopes at the surface of cells over-expressing SDC1 was detected by phage display-derived anti-HS antibodies produced in a VSV-tag version to recognize epitopes with different sulfation patterns (Table 3). Cells were detached using a cell dissociation buffer (Gibco) or scraped, resuspended in FACS buffer, and incubated 30 min at 4 °C with antibodies against different HS epi-topes in 1/50 dilution. For the detection of bound antibodies, cells were incubated in 100μL of FACS buffer containing 1/10 mouse mono-clonal anti-VSV tag glycoprotein, clone P5D4 (Sigma-Aldrich, V-5507) at 4 °C for 30 min. After washing, cells were incubated in a FACS buffer containing 1/200 Alexa488 goat anti-mouse IgG (H + L) antibody (Mo-lecular Probes, A-11001) for 15 min at RT. For negative controls, the pri-mary antibody was omitted.
Recombinant SULF1 was produced as described previously by transfecting FreeStyle 293-F cells (Invitrogen) with a pcDNA3.1/Myc-His(−) plasmid encoding SULF1 [36,37]. To study the activity of SULF1, cells over-expressing SDC1 and control mock-transfected cells were starved overnight. The culture medium was then replaced by 1 mL of medium supplemented with 2.5μM MgCl2and 20μL of
recom-binant SULF1 and incubated for an additional 2.5 h. Cells were harvested and stained for HS epitopes as described above. For all experiments, cells were analyzed in 250μL PBS using a FACSCalibur cytometer (Becton Dickinson) and CELLQuest software. For each analysis set, at least three independent experiments were performed, with at least 6000 cells counted for each sample.
2.7. Immunocytochemistry
Cells were grown to 70% confluence in eight-well Lab-Tek II chamber slides (Thermo Scientific, 154941) and were fixed with 3% paraformal-dehyde for 10 min. For intracellular staining, cells were subsequently permeabilized with 0.1% Triton X-100 (Sigma, St Louis, MO, USA) for10 min at RT. Non-specific binding was blocked with a 3% normal goat serum for 30 min at RT, and cells were incubated (overnight at 4 °C) with primary antibodies or corresponding isotype control (Table 2) in PBS/1% bovine serum albumin. Slides were rinsed and incu-bated for 30 min at RT with Alexa 488 conjugated secondary antibody diluted in 1% BSA. Slides were then counterstained with Hoechst 33342 dye (Life Technologies, H3570) and mounted using Dako fluores-cent mounting medium (S3023). Laser scanning microscopy was per-formed using a Nikon Eclipse Ti confocal microscope and NIS Elements AR imaging software. Images were processed using ImageJ 1.47 software.
Table 2
Antibodies and negative controls used.
Antibody Company Dilution
Anti-p44/42 MAPK (Erk1/2) rabbit monoclonal(137 F5) Cell Signaling 1/100 Anti-phospho-p44/42 MAPK (Erk1/2) (Erk1/2)
(Thr202/Tyr204) XP® rabbit monoclonal (D13.14.4E)
Cell Signaling 1/200 Anti-Akt(C67E7) rabbit monoclonal Cell Signaling 1/100 Anti-phospho-Akt (Ser473)(D9E) XP®rabbit
monoclonal
Cell Signaling 1/100 Anti-ETS1 mouse monoclonal (8A8) Abcam 1/200 Anti-ETS1(phospho T38) rabbitpolyclonal Abcam 1/200 Anti-sulfatase-1 rabbit polyclonal Abcam 1/50
Anti-HS6ST1 rabbit polyclonal Abcam 1/500
Anti-HS2ST1 mouse monoclonal(G-10) Santa Cruz Biotech.
1/10
Mouse IgG1 isotype control Dako –
Rabbit IgG isotype control Cell Signaling – F(ab′) fragment of Alexa488 goat α-mouse IgG (H + L) Invitrogen 1/800 Alexa488 goatα-rabbit IgG (H + L) Invitrogen 1/400
Table 3
VSV-tagged phage display-derived scFv anti-heparan sulfate antibodies[77]. Anti-HS antibody HS modifications
HS4C3 N-sulfation, 3-O-, 6-O-, 2-O-sulfation HS4E4 N-sulfation, N-acetylation, C5-epimerization AO4B08 N-sulfation,C5-epimerization 2-O-, 6-O-sulfation RB4EA12 N-acetylation, N-sulfation, 6-O-sulfation
NS4F5 N-sulfation,C5-epimerization, 2-O-sulfation, 6-O-sulfation EV3C3 N-sulfation, C5-epimerization, 2-O-sulfation
2.8. Binding of exogenous sulfatase-1 to cells over-expressing syndecan-1 Cells over-expressing SDC1 and corresponding control cells were grown to 70% confluence in eight-well Lab-Tek II chamber slides for 48 h, and then were washed and incubated in 200μL of conditioned medium from SNAP-tagged SULF1-expressing 293-F cells at 4 °C. SNAP-tagged SULF1 was prepared similarly to recombinant SULF1 after insertion of the SNAP-coding sequence at the N-terminus of the SULF1 sequence. After 1 hour incubation with SNAP-tagged SULF1, cells were washed with culture medium without serum and were incubated in 5μM SNAP-surface 488 (Bio-Labs, S9124S) ac-cording to the manufacturer's instructions at 4 °C. Cells werefixed in 3% paraformaldehyde for 10 min, counterstained with Hoechst 33342 dye (Life Technologies, H3570), and mounted in Dako mount-ing medium. Cell-bound SULF1 was visualized and compared to cells without SULF1 incubation. Laser scanning microscopy was per-formed using a Nikon Eclipse Ti confocal microscope and NIS Ele-ments AR imaging software. Images were processed using ImageJ 1.47 software.
2.9. Proteome profiler arrays
To profile the RTK phosphorylation status of cells over-expressing SDC1, we used the human phospho-RTK aRRAY kit (R&D Systems, Inc.). To investigate the activation status of downstream signaling path-ways, we also analyzed the phosphorylation of 43 kinases using the pro-teome profiler human phospho-kinase array kit (R&D Systems, Inc.). For both kits, cells over-expressing SDC1 and corresponding controls were stimulated for 6 h with a mixture of growth factors containing recombi-nant human VEGF (5 ng/mL) (Peprotech, NJ, USA) and PDGF-AB (5 ng/mL) (Peprotech, NJ, USA) in complete medium. The protein con-centrations of cell lysates were measured using the bicinchoninic acid (BCA) assay (Thermo Scientific, IL, USA, cat. no. 23225). Equal amounts of total protein in cell lysates were mixed with a cocktail of biotinylated detection antibodies and added to nitrocellulose membranes coated with primary antibodies. Following streptavidin-HRP and chemilumi-nescent detection, the amount of analyte at each spot was recorded with a CCD camera (FluorChem™ SP, Alpha Innotech, USA) and optical pixel densities were analyzed using the ImageJ open source image anal-ysis program.
2.10. Nuclear extraction
In order to prepare nuclear extracts containing activated transcrip-tion factors, the active motif nuclear extractranscrip-tion kit (Rixensart, Belgium, cat. no. 40010) was used according to the manufacturer's in-structions. Briefly, 2 × 10⁶cells were stimulated for 6 h with a mixture
of VEGF (5 ng/mL, Peprotech, NJ, USA) and PDGF-AB (5 ng/mL, Peprotech, USA) in a complete medium. Cells were collected in ice-cold PBS containing phosphatase inhibitors, and then were resuspended in hypotonic buffer containing detergents. After removal of the cyto-plasmic fractions, cell nuclei were lysed in the lysis buffer containing protease inhibitors and 10 mM DTT. Nuclear proteins were solubilized in this buffer and the protein concentrations were measured using the BCA assay and using optical densities at 562 nm.
2.11. Transcription factor assay
The activity of transcription factors was detected using the TRansAm™ MAPK family kit (Active Motif, CA, USA). The kit is designed specifically to study the MAPK-regulated transcription factors ATF-2, c-Jun, c-Myc, MEF-2, and STAT-1a. Briefly, this kit is an ELISA-based assay in which the activated transcription factors from the nuclear extract bind coated oligonucleotides. The amount of bound factor is then quan-tified using antibodies specific for each factor in its active form. Optical densities were measured at 450 nm and compared to 655 nm as the ref-erence wavelength.
2.12. Soluble syndecan-1and sulfatase-1 enzyme-linked immunosorbent assay (ELISA) of pleural effusions
Sixty-six pleural effusions comprising 17 adenocarcinomas (four breast carcinomas, four ovarian carcinomas, four lung carcinomas, two colorectal carcinomas, one renal carcinoma, one esophageal carcinoma and one from unknown primary tumor), 37 malignant mesotheliomas, and 12 benign effusions were used to measure soluble SDC1 and SULF1 levels. Forty-two effusions were collected at the Department of Pathology and Cytology, Karolinska University Hospital in Huddinge, Sweden, between 2007 and 2013. Twenty-four MM effusions were col-lected at the Chest Disease Department of Eskisehir Osmangazi Univer-sity in Eskisehir, Turkey, between 2002 and 2004. The samples were collected before any treatment was given. Inclusion criteria have been
Fig. 1. SDC1 alters the expression of HS synthesizing and modifying enzymes. (a) RNA expression of different compounds involved in HS synthesis and modification following SDC1 over-expression. Black bars represent microarray results at a q value of≤0.05; gray bars represent RT-PCR validation; (b) expression of different proteins involved in HS biosynthesis and mod-ification following SDC1 over-expression, measured by fluorescence activated cell sorting (FACS). All experiments were done in triplicates; error bars represent standard error of the mean (SEM). Significance was assessed by one sample t-test. Asterisk indicates significance at p ≤ 0.05.
previously described[38–40]. All effusions in the malignant group contained a varying number of malignant cells with admixture of benign mesothelial cells and inflammatory cells. All diagnoses were established according to the guidelines of cytological diagnosis of malignant effusions
[41]and verified by histopathology, immunohistochemistry, ultrastruc-tural or biomarker analyses. The benign effusions consisted of pleuritis ex-udates, reactive mesothelial hyperplasia and/or displayed low biomarker level for hyaluronan (HA). The percentage of malignant cells was estimat-ed considering cytomorphological and immunohistochemical parameters independently by two expert pathologists (A. Hjerpe and K. Dobra). Discrepant cases were resolved through discussion. The median age of mesothelioma patients was 67 (32–83) years, while for the benign or bio-marker negative patients 72 (58–86) years.
The study was approved by the ethical review board of Stockholm, Sweden (2009/1138-31/3), and the ethical review board of Eskisehir University, Turkey. All patients provided informed consent.
All samples were centrifuged at 1700 g for 10 min and acellular super-natants were stored at−80 °C. SDC1 and SULF1 were measured using ELISA kits, Human CD138 (syndecan-1) (Gen-Probe Diaclone, France, cat. no. 950.640.192) and Human SULF1 (QAYEE-Bio, Beijing, China, cat. no. QY-E02238), respectively. ELISAs were performed according to the manufacturers' instructions. Effusions were diluted 1:3 for SDC1 analysis and 1:5 for SULF1 measurements using dilution buffers as blanks. Patient samples were analyzed in duplicate. Investigators were blinded to patient diagnoses. Optical densities were determined using a spectrophotometer (BioTek's PowerWave HT, Winooski, VT, USA) at 450 nm.
2.13. Survival analysis
Survival times were available for a sub-set of patients. To establish if the level of SULF1 correlates with the survival of mesothelioma patients, survival analysis was performed with cut-off values based on the highest and most significant hazard ratio using the online web applica-tion Cut-off Finder[42]as previously described[38]. With determined cut-offs, the Kaplan–Meier survival analysis was applied. The log-rank (Mantel–Cox) test compared survival curves and estimated hazard ra-tios and p-values.
2.14. Cell cycle analyses
Cells were seeded in 12-well plates at a density of 105cells/well.
After 24 h, the medium was removed and substituted with 500μL of fresh medium containing 2.5 mM MgCl2. Ten microliters of recombinant
Fig. 2. SDC1 alters expression of different antibodies recognizing variously sulfated regions of HS chains. The expression of antibodies was detected using mouse monoclonal anti-VSV tag glycoprotein followed by Alexa 488-conjugated goat anti-mouse antibody and quanti-fied by FACS analysis. Results are expressed in fold change (FC) of HS epitopes in SDC1 over-expressing cells compared to control cells. Experiments were done in triplicates; error bars represent standard error of the mean (SEM). Significance was assessed by one sample t-test. Asterisk indicates significance at p ≤ 0.05.
Fig. 3. Exogenous SULF1 specifically reverts the effect of SDC1 over-expression on RB4EA12 antibody. Cells were incubated 2 h in a serum free medium with or without SULF1, stained with antibody RB4EA12 (a, b) or HS4E4 (c). Average of 3 experiments (a) and representative FACS histogram plots (b, c) are shown. The expression of the HSRB4EA12epitope (a, b) in SDC1 over-expressing cells (gray line) is higher than control
cells (dashed line), and is reverted to the level of control cells in SDC1 over-expressing cells supplemented with exogenous SULF1 (black line). On the HS4E4 antibody (c), an epi-tope not requiring O-sulfation, a slight elevation is seen due to SDC1 over-expression com-pared to control cells (light plots), however, addition of SULF1 does not revert this effect (shaded plots).
SULF1 was added to the respective wells twice every 12 h. Cells were trypsinized, centrifuged,fixed in 1 mL of 70% cold ethanol in test tubes, and incubated at 4 °C overnight. Cells were washed in PBS and re-suspended in 500μL staining solution containing 50 μg/mL propidium iodide (Sigma-Aldrich, MO, USA) and 100μg/mL RNAse A (Sigma-Al-drich, MO, USA). The cells were incubated for 30 min at 37 °C. The cell cycle distribution was acquired for 10,000 cells for each sample using a FACSCalibur cytometer (Becton Dickinson, CA, USA) with ModFit LT software (Verity Software House, ME, USA).
2.15. Statistical analysis
Statistical analyses were performed using GraphPad Prism version 6.01 for Windows (GraphPad Software, San Diego California USA,
www.graphpad.com). Normal distribution was tested by D'Agostino & Pearson's omnibus normality test. Significance was analyzed using the two-tailed Student's t-test, two-way ANOVA, or Mann–Whitney non-parametric test depending on the comparisons and distribution pattern. Significance was considered at p b 0.05. The correlation between soluble SDC1 and SULF1 in paired effusions was analyzed using a two-tailed Pearson correlation.
3. Results
3.1. Syndecan-1 over-expression alters the expression of HS biosynthetic/ modifying enzymes
To investigate the impact of SDC1 on HS biosynthetic and modifying machinery, we studied the RNA and protein levels of fundamental
components involved in this process. The RNA levels of HS biosynthetic and modifying enzymes (EXT1, NDST1, HS2ST1, HS6ST1, SULF1) and the sulfate donor synthase PAPSS1 were altered after SDC1 over-expression (Fig. 1a). The most dramatically altered enzyme was SULF1, which was down-regulatedN50-fold at the RNA level, whereas the synthesized protein was down-regulated 1.8-fold compared to the control (Fig. 1b). The expression of HS2ST1 protein was slightly elevated in the SDC1-over-expressing cells. In contrast, NDST1 and HS6ST1 were down-regulated at the RNA level, though we did not observe any signif-icant changes in protein expression (Fig. 1b).
3.2. Syndecan-1 over-expression alters the sulfation pattern of HS chains To check how changes in HS synthetizing and modifying enzymes affect the sulfation pattern of HS chains, we used antibodies against var-ious sulfated saccharide motifs and performed further precise analyses of the disaccharide content.
In agreement with SULF1 down-regulation and the altered expres-sion of the enzymes involved in HS synthesis, the use of phage-displayed antibodies indicated modifications in the HS structure. Bind-ing of the antibody RB4EA12, which preferentially recognizes N- and 6-O-sulfated saccharide motifs, was significantly elevated in cells over-expressing SDC1, suggesting higher contents of 6-O- and N-sulfation (Fig. 2). Moreover, addition of SULF1 to the culture medium reverted this effect of the RB4EA12 antibody (Fig. 3).
The chromatographical analysis of HS from control cells and cells over-expressing SDC1 also revealed clear changes in polysaccharide ex-pression and structure. First, SDC1 over-exex-pression resulted in lower amounts of HS, with a 2.5 to 2.7-fold reduction in both medium and
Fig. 4. Composition analysis of HS chains from cells over-expressing SDC1 revealed clear changes in polysaccharide expression and structure compared to control. Quantification (a, b) and structural analysis (c) by RPIP-HPLC of HS purified from medium (M0, white bars) and cell lysates (C0, gray bars) of control STAV-AB cells, and from medium (MS1, black bars) and cell lysates (CS1, dashed bars) of SDC1-transfected STAV-AB cells. Error bars represent SEM of triplicate analysis.
cell samples (Fig. 4a, b). However, the overall sulfation of these chains was higher (~ 20%), with notable increases in N-sulfation and 6-O-sulfation (Table 4). A detailed analysis of disaccharide content (Fig. 4c) showed that the main changes occurred for 6-O-sulfated disaccharides, which is consistent with the reduced expression of SULF1 in these cells. The disaccharide [ΔUA(2S)–GlcNS(6S)] is the major substrate of SULF and was the most affected, with an increase of ~2.5-fold accompanied by a decrease in [ΔUA(2S)–GlcNS] (the product of the enzyme reaction), though not to the same extent. In contrast, the other 6-O-sulfated disac-charides [ΔUA–GlcNS(6S)] and [ΔUA–GlcAc(6S)], which are poor sub-strates for the enzyme[36], were decreased, suggesting the existence of cellular compensatory mechanisms to sustain an even amount of 6-O-sulfation. Notably, very little difference was observed between cell surface and extracellular HS in the culture medium. Thisfinding is in agreement with the principle of a universal biosynthetic machinery being responsible for HS assembly on all proteoglycans, as the extracel-lular environment contains not only shed syndecans, but also other HSPGs. The identity of the disaccharides was also verified by HPCE anal-ysis. Due to a low amount of sample, just a few types of sulfated disac-charides were detected by this method, but the results were similar to those of the previous method: a significant increase in mono N-sulfated disaccharides and decrease in [ΔUA(2S)–GlcNS] and [ΔUA– GlcNS(6S)] disaccharides in cells over-expressing SDC1 (data not shown).
3.3. Syndecan-1 over-expression enhances binding of exogenous sulfatase-1 to the cells
In order to examine the binding capacity of HS chains with altered sulfation pattern in SDC1 over-expressing cells, exogenous SNAP-tagged SULF1 was used to probe cell surface HS for SULF binding se-quences. Cells over-expressing SDC1 bound significantly more of the ex-ogenous enzyme. This result indicates the presence of larger amounts of intact 6-O-sulfated HS motifs, which is consistent with the reduced ex-pression of endogenous SULF1 (Fig. 5). Notably, the cells grown under serum-free conditions at 37 °C internalized some of the added SULF1 within a few hours (data not shown).
3.4. Syndecan-1 modulates multiple intracellular signaling pathways To study whether changes in HS chains lead to alterations in down-stream signaling we measured the phosphorylation status of different kinases and receptors after growth factor stimulation. Among the 41 studied mitogen-activated protein kinase (MAPK)-related components, 18 phosphorylated members of this family, mainly transcription factors, were detected in all three experiments.
Using two independent methods, the activity of EGFR was found consistently higher in cells over-expressing SDC1 compared to controls, although the variability between experiments was too large to give sta-tistical significance. Phospho-kinase array showed 1.8 ± 0.3 fold higher EGFR activity in SDC1 over-expressing cells (mean ± SEM), (Fig. 6), while the difference was 1.6 ± 0.5 fold using the phospho-RTK array. The other RTKs were not influenced.
Downstream of the signaling pathways, ERK1/2 phosphorylation was slightly increased (1.2 ± 0.16), whereas the phosphorylation of protein kinases WNK1 and Akt 1/2/3 were decreased in cells over-expressing SDC1 compared to control cells (0.6 ± 0.09, and 0.3 ± 0.08 fold change, respectively) (Fig. 6). Flow cytometry analysis confirmed the elevated levels of both total and phospho-ERK1/2 (1.74-fold and 6.1-fold, respectively), in cells over-expressing SDC1 compared to con-trol cells (Fig. 7a–b). These findings were verified by immunocytochem-istry (Fig. 7c). Similarly, inhibition of Akt expression and activity was also confirmed by FACS analysis; we measured 0.48 ± 0.025 and 0.5 ± 0.0018-fold changes for total and phospho Akt, respectively (Fig. 8).
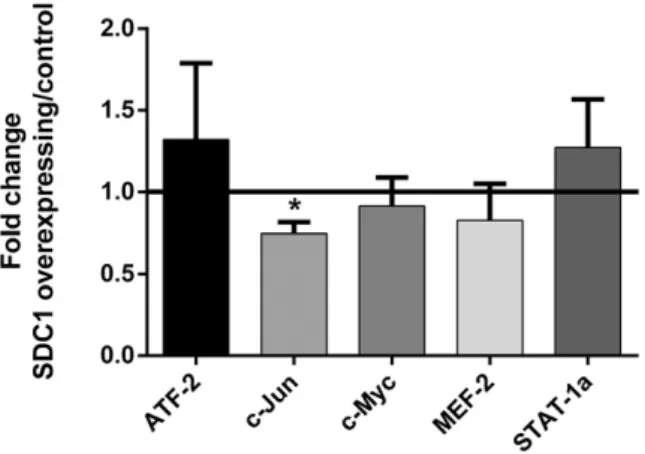
Downstream of phospho-kinases, among the ERK1/2 (MAPK) regu-lated transcription factors, the activity of c-Jun was inhibited by SDC1 over-expression (mean fold change ± SEM; 0.74 ± 0.07,Fig. 9). Fur-thermore, in cells over-expressing SDC1, the expression of the ETS-1 transcription factor increased by 1.62 ± 0.15 fold, but its activity was not affected (Fig. 10).
3.5. Both syndecan-1 over-expression and exogenous sulfatase-1 affect the cell cycle
To check if cell cycle is affected by SDC1 and SULF1, we investigated the cell cycle distribution in cells over-expressing SDC1 and mock con-trols in the absence and presence of SULF1. Cells that overexpressed SDC1 showed a significantly larger proportion of cells in G0/G1 phase compared to the mock-transfected ones (66.5 ± 2.3 vs. 61.3 ± 0.7, re-spectively), with correspondingly less cells in S- and G2/M phases (26.3 ± 2.9 vs. 30.7 ± 0.7 and 7.2 ± 0.6 vs. 8 ± 0.0, respectively). Sur-prisingly the exposure to exogenously added SULF1 decreased the pro-portion of S- and G2/M cells, both in the SDC1 overexpressing cells (to
Fig. 5. Cells over-expressing SDC1 bind more exogenously added SULF1. Cells were seeded on slides, incubated with SNAP-tagged SULF1 for 30 min andfluorescently tagged with Alexa 488 SNAP substrate. Cell's nuclei were counterstained with Hoechst dye and ana-lyzed with a laser confocal microscope. (a) Bound SULF-1 was quantified based on two dif-ferent experiments,five random images each containing at least 10 cells/image. Total pixel intensity/cell was evaluated in the green channel and analyzed with ImageJ software. Sig-nificance was assessed by Mann–Whitney t-test. (b) Representative confocal micrograph showing cell-surface bound SULF1 (green) and cell nuclei (blue).
Table 4
Structural analysis of HS composition from control and SDC1 transfected STAV-AB cells: sulfation content (number of sulfates per 100 disaccharides).
Control SDC1 over-expressing
Medium Cells Medium Cells
N-Sulfation 49.7 50.8 58.3 61.6
2-O-sulfation 30.3 30.8 31.6 36.7
6-O-sulfation 23.6 25.3 32.1 35.8
22.7 ± 0.7 and 5.2 ± 0.5) and in the mock transfected controls (to 26.9 ± 0.6 and 7.9 ± 0.1), while the proportion of G0/G1 cells increased correspondingly (to 72.1 ± 1.1 and 65.1 ± 0.7) (Fig. 11).
3.6. Sulfatase-1 expression is low in malignant pleural effusions
In order to test the applicability of ourfindings in clinical settings and the potential role of SULF1 as a biomarker in malignant mesotheli-oma, we measured its levels in pleural effusions. SULF1 levels were sig-nificantly lower in malignant pleural effusions (mean ± SEM; 49.3 ± 3.3; n = 56) compared to benign conditions (118.5 ± 8.7; n = 10;
pb 0.0001,Fig. 12a). Within the malignant group, SULF1 was signi fi-cantly lower in pleural effusions from mesothelioma patients (39.9 ± 2.8; n = 39) compared to effusions from adenocarcinoma patients (69.3 ± 5.3; n = 17; pb 0.0001,Fig. 12b). By simultaneously measuring the level of soluble SULF1 and SDC1 in pleural effusions from mesothe-lioma patients, we found a fair, though not significant, inverse correla-tion between SULF1 and SDC1 expression (r =−0.43; p = 0.13; n = 13,Fig. 12c).
Pleural effusions contained in average 40% tumor cells (ranging from 10 to 80%). Soluble SDC1 strongly correlated with the tumor burden represented by the proportion of tumor cells (r = 0.8; p = 0.006)
Fig. 6. Phospho-kinase profile of SDC1 over-expressing cell lysates compared to the control. Cells were stimulated with VEGF + PDGF, and equal amounts of total proteins in cell lysates were mixed with a cocktail of detection antibodies and added on membranes coated with primary antibodies. Chemiluminescence was detected for each spot with a CCD camera. (a) Rep-resentative images of human phospho-kinase arrays of 300μg cell lysate from SDC1 over-expressing cells (top) and controls (bottom). Eighteen proteins in duplicates were detected in all three experiments. Duplicates represent following proteins in numerical order: P38a (1); ERK1/2 (2); JNK1/2/3 (3); GSK-3a/b (4); EGFR (5); MSK1/2 (6); Akt1/2/3 (7); CREB (8); B-ca-tenin (9); STAT2 (10); STAT5a (11); STAT6 (12); STAT5b (13); Chk-2 (14); C-Jun (15); STAT3 (16); WNK1 (17); and HSP60 (18). (b) Three independent experiments were performed in duplicates. Fold changes were calculated based on the average optical density values of each analyte obtained from SDC1 over-expressing cells divided by the average optical density values of control cells. Asterisk represents a significant difference (p-value b 0.05) and # indicates p-value = 0.06. p-Values are from Student's t-tests. Lines represent mean and error bars rep-resent standard error of the mean (SEM). Analyses were performed and graphs were created using the GraphPad Prism software.
above a cut-off of 235 ng/mL (Fig. 13). However, no correlation was found between SULF1 levels and tumor burden.
SULF1 levels did not correlate to the survival of malignant mesothe-lioma patients (r = 0.12; p = 0.5, data not shown). Using the cut-off value of 36.57 ng/mL based on the highest and most significant hazard ratio, median survival time of mesothelioma patients with SULF1 level higher than 36.57 ng/mL was 10 months, while in those with lower SULF1 levels it was slightly lower, 6 months. However, this difference was not statistically significant (hazard ratio 0.76; 95% CI = 0.37 to 1.6; p = 0.47; Supplementary Fig. 1).
4. Discussion
The cancer-related significance of SDC1 has been established in a wide range of tumors, including mesothelioma, breast, colorectal,
gastric, pancreatic, prostate, lung, endometrial, and ovarian cancers, as well as squamous cell carcinoma of the head and neck[26,43]. However, the net effect exerted by SDC1 is largely tissue-specific and depends on the sub-cellular localization of proteoglycans, the ratio of shed and cell-bound SDC1, tumor–matrix interactions, and the concentrations of available growth factors and mitogens in the tumor microenvironment. Generally, mesothelioma cells express low levels of SDC1 and cells with higher levels of membrane-bound SDC1 undergo epithelioid differenti-ation, associated with a better prognosis than sarcomatoid mesothelio-ma with little or no expression of this proteoglycan[26]. We previously demonstrated that SDC1 inhibits tumor cell growth, proliferation, and migration in MM cells[29,44]. Furthermore, our recent study indicates that soluble SDC1 can serve as a diagnostic and prognostic marker for pleural malignancies, such as mesothelioma and metastatic adenocarci-noma[38].
Fig. 7. The level and the activity of ERK1/2 are elevated due to SDC1 over-expression. Cells over-expressing SDC1 and control cells were stimulated with FGF2, stained with ERK1/2 and phospho ERK1/2. The expression and activity of ERKs were quantified by fluorescence activated cell sorting (FACS) (a, b) and immunostaining followed by confocal microscopy (c). (a) Average geometrical mean of thefluorescent intensities of three experiments, based on FACS analysis. Results are represented as average fold changes +/− SD. The statistical significance of the difference between total and phospho-ERK was assessed by Student's t-test. Asterisk represents a significant difference (p-value b 0.05). (b) A representative FACS histogram plot, where dotted lines represent intensity of control cells, whereas black line represents SDC1 over-expressing cells. (c) Immunostaining followed by confocal microscopy, green indicating ERK1/2 or pERK1/2 detected by Alexa 488, and blue represents nuclei stained with Hoechst dye.
SDC1 is a prominent co-receptor that interacts with large networks of HS-binding proteins (HSBPs), known as the HS interactome, and is in-volved in various cellular processes[45,46]. All these processes begin with physical docking of the biological effectors to saccharide motifs within the HS chains. Therefore, the modification of such motifs has a crucial impact on the biological functions of HSPGs by modulating the binding capacity and/or specificity of HSBPs and altering downstream signaling pathways[47,48], leading to potential inhibitory or stimulato-ry effects on tumor growth. However, the impact of SDC1 expression on the structural and functional properties of HS in mesothelioma, and its implications on intracellular signaling pathways, have never been investigated.
In this context, the present study demonstrates for thefirst time that SDC1 over-expression affects the composition of HS chains through alter-ations in both biosynthetic and post-synthetic modification processes.
HS biosynthesis and turnover are strictly regulated processes involv-ing many enzymes interrelated to each other[49,50]. In the course of their synthesis in Golgi, HS chains are elongated by exostosins (EXT1-2). The N-deacetylase–N-sulfotransferases (NDST 1–4) continue the biosyn-thetic process by replacing the acetyl group of GlcNAc with a sulfate group, introducing HSN-sulfation. In subsequent steps, the corresponding O-sulfotransferases (HS2ST1, HS6ST1–3, HS3ST1–7) preferentially add their sulfate groups to an already N-sulfated motif[51,52]. Finally, mature HS chains at the cell surface can be modified by extracellular HS 6-O endosulfatases (SULF1 and 2), which can selectively remove 6-O sulfate groups from the polysaccharide[53]. Therefore, the edition of a precise HS sulfation pattern relies on a tight balance between these biosynthetic and post-synthetic enzymatic processes. Previous studies have suggested a dynamic interplay between all of these enzymes that may add further complexity to the system. Over-expression of EXT1 or EXT2 inhibits or enhances NDST1 expression, respectively, with opposite consequences on HS sulfation[54]; NDST1-deficient mice exhibit general HS under-sulfation, suggesting that NDST1 plays a dominant role in the regulation of HS synthesis[32,55]. Moreover, over-expression or knock-down of SULFs has been shown to lead to alterations in the 6-O-sulfation pattern, and 2-O and N-sulfations are also significantly affected[56–58]. Taken to-gether, the results indicate that postulating direct cause–effect relation-ships between variations in biosynthetic enzyme expression and HS structure is questionable.
Here, we characterized HS from intact and SDC1-over-expressing me-sothelioma cells using three complementary approaches: transcriptional
analysis of HS biosynthesis enzymes, mapping of saccharide epitopes using phage-display anti-HS antibodies, and biochemical determination of HS composition by disaccharide analysis. These strategies revealed clear changes in HS structure upon SDC1 over-expression that can con-tribute to altered signaling. We show that the expression of enzymes from nearly every step of HS biosynthesis and post-synthesis are delicate-ly affected by SDC1. One possible mechanism of these effects could be a negative feed-back in the cells expressing more SDC1, resulting in slower biosynthetic processes, as suggested by thefinding that both EXT1 and NDST1 are transcriptionally down-regulated. Disaccharide analysis showed that HS chains were less abundant in cells over-expressing SDC1, which may be due in part to decreased synthetic capacity of the HS biosynthetic machinery in cells over-expressing the SDC1 protein core, and in part due to the decreased amount of EXT1 and NDST1 en-zymes leading to the assembly of shorter HS chains. Such a phenomenon has been observed in xyloside-treated cells[31]. In addition, SDC1 over-expression could result in the down-regulation of other HSPGs[27,29].
Transcriptional analysis showed that the expression of both HS6ST1 and SULF1 decreased upon SDC1 over-expression. This may be another indication of a slower biosynthesis and turnover of HS in these cells, par-ticularly of 6-O-sulfated moieties. Our results indicate that modifications of 6-O-sulfation on HS chains were qualitative rather than quantitative. The overall 6-O-sulfate content remained unchanged, but disaccharide analysis revealed a drastic increase in [ΔUA(2S)–GlcNS(6S)] and decrease in [ΔUA–GlcNS(6S)] and [ΔUA–GlcNAc(6S)]. Enhanced [ΔUA(2S)– GlcNS(6S)] is a direct consequence of SULF1 down-regulation, as this spe-cific disaccharide is a preferential substrate of the enzyme. However, this increase was only partially compensated by a decrease in [ΔUA(2S)– GlcNS], the product of SULF1 desulfation. Thisfinding indicates that the observed modifications cannot be attributed exclusively to a depletion of SULF1 enzymatic activity, but also involvesfine tuning of the HS struc-ture through the biosynthesis machinery. Recently, a study on colorectal cancer cells over-expressing SULFs reported an increase in GlcNAc(6S)-containing disaccharides as a cellular response that compensates for the enzymatic driven decrease in [ΔUA(2S)–GlcNS(6S)] [59]. Our data support such complementary behavior, here in the context of SULF1 down-regulation by SDC1. The results obtained with anti-HS phage-display antibodies are in full agreement with thesefindings; an enhanced signal was observed for RB4EA12 antibody, which recognizes 6-O-sulfated and N-6-O-sulfated epitopes, respectively, furthermore a relative in-crease was noticed for NS4F5, which has specificity towards [ΔUA(2S)–
Fig. 8. The level and the activity of Akt are inhibited by SDC1 over-expression. Cells over-expressing SDC1 and control cells were stimulated, stained with total- and phospho Akt1/2/3, the expression and activity of Akt were quantified by fluorescence activated cell sorting (FACS). (a) Average geometrical mean of the fluorescent intensities of three experiments, based on FACS analysis. Results are represented as average fold changes +/− SEM. The one sample t-test with a theoretical mean of 1 was applied for significance. Asterisk represents a significant difference (p-valueb 0.05). (b) A representative FACS histogram plot, where dotted lines represent intensity of control cells, whereas black line represents SDC1 over-expressing cells.
GlcNS(6S)] trisulfated disaccharide, a very sensitive signature of SULF activity[36].
We also found that the HS chains of cells over-expressing SDC1 were more N-sulfated and 2-O-sulfated. The latter result was expected, as we observed an increase in HS2ST expression at both the transcriptional and protein levels. However, no such correlation could be made be-tween enhanced N-sulfation of HS and decreased expression of NDST1. Explanations for this may be that, in contrast to HS2ST, NDSTs display three other isoforms that may contribute to compensatory mechanisms. In addition, we did not observe any significant down-regulation of NDST1 at the protein level. Finally, increased N-sulfation could also be the result of the down-regulation of EXT1, which has been reported to inhibit NDST1 activity[54].
To confirm our hypothesis that many of the observed changes in HS chain composition in cells over-expressing SDC1 is related to the sub-stantial down-regulation of SULF1 expression, we showed that the binding of exogenous SULF1 to HS chains is more extensive in cells over-expressing SDC1 and that treatment with SULF1 can revert the binding of 6-O-sulfate-dependent RB4EA12 antibody. As mentioned
above, SULF1 post-synthetically removes the 6-O-sulfate groups of HS chains and plays conflicting roles as an oncogene or tumor suppressor in various cancers. The 6-O-sulfation level has been reported to change throughout the different stages of malignancy, resulting in an altered HS structure and function[18–20]. Growth factor binding and presentation to cognate receptors can be differentially regulated according to the HS sulfation pattern, as exemplified for FGF-2; binding of HS to the growth factor is 2-O-sulfation-dependent, whereas binding to FGF2-receptor is 6-O-sulfation-dependent.
Consequently, modifications of the HS 6-O-sulfation status by SULFs are critical in tumor cell survival, proliferation, and metastasis. Our find-ing that SDC1 over-expression directly inhibits SULF1 and leads to in-creased HS 6-O-sulfation suggests functional consequences regarding the binding of growth factors and the regulation of intracellular signal-ing pathways, as previously observed for VEGFR[60], amphiregulin[61], and FGFR[62]. In our study, this is illustrated by a subtle enhancement of EGFR activity in cells over-expressing SDC1 and concomitant activa-tion of the downstream ERK1/2 pathway. However, the ultimate effect of SDC1 over-expression is the inhibition of proliferation[29]retaining the cells in G0/G1, thus we hypothesize that other inhibitory mecha-nisms may be involved that are triggered by SDC1, but are independent of HS chain modifications. This hypothesis is supported by two main findings: first, the G1 arrest observed in SDC1 over-expressing cells could not be rescued by SULF1 addition. Second, despite the ERK activa-tion, downstream ERK-related transcription factors are inhibited. We analyzed the expression and activity of ETS-1, as we previously found that it is the only transcription factor affected at the RNA level by both
Fig. 11. Cell cycle distribution is altered after exogenous SULF1 addition to syndecan-1 over-expressing cells and controls. Cell cycle analyses were performed by PI staining, 24 h after SULF1 addition usingflow cytometry. Columns represent mean percentage of cells in each phase of the cell cycle ± SD (n = 3). p-values are calculated by two-way ANOVA test. Asterisks indicate statistically significant differences (*p b 0.05, **p b 0.01, ***pb 0.001, ****p b 0.0001). SD = standard deviation.
Fig. 10. SDC1 over-expression increases the level of ETS1 but its activity is not influenced. Cells over-expressing SDC1 and control cells were stimulated for 5 min with FGF2, stained with ETS1 and phosphoT38 ETS1. The expression and phosphorylation of ETS1 were quantified by fluorescence activated cell sorting (FACS). (a) Represents the average of three experiments, based on the geometrical mean of the intensities measured by FACS. Results are average fold changes +/− SD. The one sample t-test with a theoretical mean of 1 was applied for signif-icance. Asterisk represents a significant difference (p-value b 0.05). (b) A representative FACS plot; gray line represents control cells, and black line SDC1 over-expressing cells. Fig. 9. MAPK regulated transcription factor activity is altered in SDC1 over-expressing cells
compared to the control. Cells' nuclear extracts were added to the 96 well-plate with coat-ed oligonucleotides. The amount of bound transcription factor was quantificoat-ed using anti-bodies specific for each activated transcription factor form and optical densities were determined. Four independent experiments were performed in triplicates. Fold changes were calculated based on the average optical density values of SDC1 over-expressing cells and were obtained from each experiment for each transcription factor, divided by the average optical density values of control cells. Asterisk represents a significant differ-ence (p-value≤ 0.05). p-Values are calculated by two tailed Student's t-tests. Lines repre-sent mean and error bars reprerepre-sent standard error of the mean (SEM).
the over-expression and silencing of SDC1[27]. ETS-1 is a known onco-gene which is activated by ERK1 at threonine-38 residue. We found that, though the level of ETS-1 is elevated in cells over-expressing SDC1, its phosphorylation at threonine-38 was not influenced. Considering the elevated ETS1 expression and unchanged phosphorylation, we conclude that ETS-1 activation was inhibited via a signaling pathway independent
of ERK1/2. c-Jun activity is also inhibited by SDC1 over-expression. Previ-ously it was shown that c-Jun is activated by both the ERK1/2 and JNK pathways[63]. As a member of the activator protein-1 (AP-1) family, c-Jun activity is also necessary for the expression of cyclin D1, which elicits G1/S transition and cell cycle progression[64]. Our previousfindings from a transcriptomic array also showed low cyclin D1 levels after SDC1 over-expression[27]. The low c-Jun activity could partly explain the absence of downstream effects upon ERK1/2 activation and the G1/S arrest of meso-thelioma cells over-expressing SDC1.
Additionally, several key factors from other signaling pathways were inhibited downstream of RTKs in the signaling cascade. WNK1, a regula-tor kinase of MAPK in EGFR signaling, was moderately inhibited by SDC1 over-expression. WNK kinases affect multiple signaling pathways in-volved in proliferation and are known to be apoptosis inhibitors[65]. WNK1 has been reported to be fundamental for EGF signaling via activa-tion of ERK5[66]. Suppressed ERK5 activation and hampered cell growth have been reported in vivo after WNK1 down-regulation[67]. The low activity of WNK1 caused by SDC1 can be another mechanism by which the effects of ERK1/2 activation are attenuated. Furthermore, our data show that SDC1 is a potent inhibitor of Akt1/2/3 activity. This is particularly interesting in light of the studies showing that the PI3K/ AKT pathway plays a critical role in MM, in which Akt is generally highly activated[68,69]and depends on RTKs, whereas MAPK activation was shown to be independent of receptor activation status[70]. Moreover, Akt1/2/3 is an important factor in the G1/S transition checkpoint. Inhi-bition of PI3K activity in different MM cell lines led to significant G1 cell cycle arrest and the suppression of cell proliferation associated with down-regulation of cyclin D1[71]. Our results support the idea
Fig. 13. High levels of soluble SDC1 in malignant pleural effusions correlate with the percent-age of tumor cells. Higher soluble SDC1 levels exceeding a cut-off level of 235 ng/mL positive-ly correlate with tumor burden represented by the percentage of tumor cells in malignant pleural effusions. Tumor cell percentage was estimated using cytomorphological and immu-nohistochemical parameters, the level of soluble syndecan-1 was measured by ELISA. Cut-off values for“high” (n = 9) and “low” (n = 13) SDC1 expression were the same with the one identified in our previous study[38]using the online web application Cut-off Finder[42]. R and p-values were calculated using Pearson correlation.
Fig. 12. Soluble SULF1 is present in lower levels in malignant tumors and negatively correlates with soluble SDC1 in pleural malignancies. (a) Soluble SULF1 levels were significantly lower in pleural effusions from malignant tumors compared to benign effusions. (b) Within the malignant tumors, pleural effusions from mesothelioma patients had significantly lower levels of SULF1 compared to adenocarcinoma patients. p-values are calculated from Kruskal–Wallis tests. Lines represent mean and error bars represent standard error of the mean (SEM). (c) Pear-son correlation analysis was used to assess the relationship between soluble SDC1 and SULF1 in paired sample effusions from 13 mesothelioma patients.
that the G1 arrest in cells over-expressing SDC1 can be mediated by Akt inhibition. Thereby we provide new evidence of the importance of Akt signaling in MM cell proliferation and cell cycle.
In light of the effects of the signaling events caused by SDC1 over-expression, the inhibition of different signaling pathways at multiple levels may counteract the initial ERK activation. This is also manifested by a general inhibition of the MAPK/ERK pathway downstream of ERK: ETS1, c-Jun, and ultimately cell cycle and proliferation.
The level of SULF1 is lower in malignant pleural effusions than be-nign effusions. Thisfinding is in line with several cancers that have been reported to express low levels of SULF1, including ovarian cancer, hepatocellular carcinoma, kidney, gastric, and bladder cancers[10], im-plying a tumor suppressor nature of SULF1[72,73]. However, another study has reported that SULF1 is elevated at the transcriptomic level in mesothelioma, which could partly be involved in chemo-resistance
[74]. The low level of SULF1 in pleural malignancies may result in higher HS 6-O-sulfation, which may in turn result in increased growth factor binding and growth promotion. Within the malignant group, mesothe-lioma samples had a lower level of SULF1 than adenocarcinoma, which may reflect the highly malignant behavior of this cancer. This observa-tion is in agreement with our in vitrofindings of elevated ERK1/2 levels and activity and enhanced growth factor binding capacity. Yet we could not show a significant correlation between the level of SULF1 and pa-tient survival; papa-tients with higher SULF1 level had slightly longer me-dian survival time, though this association was not significant. Testing the role of SULF1 as a prognostic marker needs a larger clinical material. Our results, however, indicate that SULF1 potentially can be included in a panel of diagnostic markers to distinguish adenocarcinomas from mesotheliomas.
Comparisons in a cohort of pleural effusions from mesothelioma pa-tients indicated that soluble SDC1 was inversely correlated to SULF1. We have previously reported that pleural effusions from mesothelioma patients contain higher levels of shed SDC1 compared to benign pleural effusions and these high levels of shed SDC1 correlate to shorter survival
[38], while high levels of membrane-bound SDC1 has been associated to better prognosis[26]. The localization of SDC1 is crucial: In malignant mesothelioma SDC1 is expressed mainly at the membrane of the tumor cells with epitheloid phenotype and in the epithelial component of biphasic mesotheliomas which are associated with a less aggressive biological behavior and longer survival. Noteworthy, shed SDC1 may act in opposite way as membrane HSPGs by interfering with the growth factor gradients in the environment of tumor cell[13]. Whether lowered level of SULF1 is specifically due to shed or membrane-bound SDC1 in mesothelioma patients remains to be elucidated, nevertheless these findings support our in vitro observations that SDC1 inhibits SULF1 in malignant mesothelioma cells. One disclosed mechanism of SULF1 down-regulation in different tumor types is silencing by hyper-methylation of its promoter[75]. Here, we provide evidence of a novel inhibitory mechanism controlled by SDC1 expression. Taken together we show here that cell surface SDC1 inhibits SULF1 expression in vitro and causes a cell cycle arrest in G1 phase. In clinical material shed SDC1 inversely correlates with SULF1, adding further evidence to the notion that soluble- and cell-surface SDC1 may counteract each other, influencing tumor cell behavior.
5. Conclusions
This study supports a crucial role of SDC1 in modifying thefine struc-ture and sulfation pattern of proteoglycans, mainly through down-regulation of SULF1, affecting downstream signaling. The results pro-vide new epro-vidence that enhanced proteoglycan core protein expression alsofinely modulates HS expression and structure by interfering with HS biosynthetic/modifying enzymes. By performing complex HS bio-chemical characterization using three different approaches, we provide further evidence of a complex interplay between HS biosynthesis and post-synthetic modifications. Furthermore, this work contributes to
elucidating the intricate role of SDC1 in signaling by revealing that SDC1 acts through the PI3K and MAPK signaling pathways in MM cells, ultimately leading to cell cycle disruption by G1 arrest. Our results suggest a potential role as a diagnostic marker of SULF1 in pleural malig-nancies and provide further insight into the complex role of SDC1 and SULF1 in cancer.
Supplementary data to this article can be found online athttp://dx. doi.org/10.1016/j.cellsig.2015.07.017.
Acknowledgments
This work was supported by the AFA Insurance (120263), the Swed-ish Research Council (K2012-99X-21999-01-3), the SwedSwed-ish Cancer Foundation (130491), and the French National Agency for Research (ANR; ANR-12-SVSE-008). We thank Prof. Steve Rosen for kindly pro-viding the PcDNA3/Myc/His/HSULF1 vector, Dr P. Despres and S. Paulous for providing the SNAP-containing shuttle vector. We acknowl-edge the help we received for RPIP disaccharide analysis from Associate Professor Dorothe Spillmann. We also thank Åsa-Lena Dackland for her kind assistance withflow cytometry.
References
[1] M. Bernfield, R. Kokenyesi, M. Kato, M.T. Hinkes, J. Spring, R.L. Gallo, E.J. Lose, Annu. Rev. Cell Biol. 8 (1992) 365–393.
[2] M. Bernfield, M. Gotte, P.W. Park, O. Reizes, M.L. Fitzgerald, J. Lincecum, M. Zako, Annu. Rev. Biochem. 68 (1999) 729–777.
[3] X. Xian, S. Gopal, J.R. Couchman, Cell Tissue Res. 339 (2010) 31–46.
[4] Y. Choi, H. Chung, H. Jung, J.R. Couchman, E.S. Oh, Matrix Biol. 30 (2011) 93–99.
[5] S. Sarrazin, W.C. Lamanna, J.D. Esko, Cold Spring Harb. Perspect. Biol. 3 (2011).
[6] M.J. Kwon, B. Jang, J.Y. Yi, I.O. Han, E.S. Oh, FEBS Lett. 586 (2012) 2207–2211.
[7] K. Lambaerts, S.A. Wilcox-Adelman, P. Zimmermann, Curr. Opin. Cell Biol. 21 (2009) 662–669.
[8] G.R. Johnson, L. Wong, J. Biol. Chem. 269 (1994) 27149–27154.
[9] L. Duchesne, V. Octeau, R.N. Bearon, A. Beckett, I.A. Prior, B. Lounis, D.G. Fernig, PLoS Biol. 10 (2012) e1001361.
[10] R.R. Vives, A. Seffouh, H. Lortat-Jacob, Front. Oncol. 3 (2014) 331.
[11] J. Kreuger, L. Kjellen, J. Histochem. Cytochem. 60 (2012) 898–907.
[12] V. Masola, M.F. Secchi, G. Gambaro, M. Onisto, Curr. Cancer Drug Targets 14 (2014) 286–293.
[13] D. Barbouri, N. Afratis, C. Gialeli, D.H. Vynios, A.D. Theocharis, N.K. Karamanos, Front. Oncol. 4 (2014) 4.
[14] E. Garusi, S. Rossi, R. Perris, Cell. Mol. Life Sci. 69 (2012) 553–579.
[15] M. Palaiologou, I. Delladetsima, D. Tiniakos, Histol. Histopathol. 29 (2014) 177–189.
[16] T. Szatmari, K. Dobra, Front. Oncol. 3 (2013) 310.
[17]D.A. Pye, R.R. Vives, J.E. Turnbull, P. Hyde, J.T. Gallagher, J. Biol. Chem. 273 (1998) 22936–22942.
[18] F.H. Blackhall, C.L. Merry, E.J. Davies, G.C. Jayson, Br. J. Cancer 85 (2001) 1094–1098.
[19]G.C. Jayson, M. Lyon, C. Paraskeva, J.E. Turnbull, J.A. Deakin, J.T. Gallagher, J. Biol. Chem. 273 (1998) 51–57.
[20] M. Delcommenne, H.G. Klingemann, Hum. Antibodies 21 (2012) 29–40.
[21] A. Purushothaman, T. Uyama, F. Kobayashi, S. Yamada, K. Sugahara, A.C. Rapraeger, R.D. Sanderson, Blood 115 (2010) 2449–2457.
[22] G. Su, S.A. Blaine, D. Qiao, A. Friedl, J. Biol. Chem. 282 (2007) 14906–14915.
[23] C.M. Alexander, F. Reichsman, M.T. Hinkes, J. Lincecum, K.A. Becker, S. Cumberledge, M. Bernfield, Nat. Genet. 25 (2000) 329–332.
[24] C. Seidel, M. Borset, O. Hjertner, D. Cao, N. Abildgaard, H. Hjorth-Hansen, R.D. Sanderson, A. Waage, A. Sundan, Blood 96 (2000) 3139–3146.
[25] E.K. Park, K. Takahashi, T. Hoshuyama, T.J. Cheng, V. Delgermaa, G.V. Le, T. Sorahan, Environ. Health Perspect. 119 (2011) 514–518.
[26] S. Kumar-Singh, W. Jacobs, K. Dhaene, B. Weyn, J. Bogers, J. Weyler, E. Van Marck, J. Pathol. 186 (1998) 300–305.
[27]T. Szatmari, F. Mundt, G. Heidari-Hamedani, F. Zong, E. Ferolla, A. Alexeyenko, A. Hjerpe, K. Dobra, PLoS One 7 (2012) e48091.
[28] K. Dobra, M. Andang, A. Syrokou, N.K. Karamanos, A. Hjerpe, Exp. Cell Res. 258 (2000) 12–22.
[29]F. Zong, E. Fthenou, J. Castro, B. Peterfia, I. Kovalszky, L. Szilak, G. Tzanakakis, K. Dobra, Cell Prolif. 43 (2010) 29–40.
[30] M. Pegeot, R. Sadir, I. Eriksson, L. Kjellen, J.P. Simorre, P. Gans, H. Lortat-Jacob, Glycobiology 25 (2015) 151–156.
[31]E. Vassal-Stermann, A. Duranton, A.F. Black, G. Azadiguian, J. Demaude, H. Lortat-Jacob, L. Breton, R.R. Vives, PLoS One 7 (2012) e47933.
[32] J. Ledin, W. Staatz, J.P. Li, M. Gotte, S. Selleck, L. Kjellen, D. Spillmann, J. Biol. Chem. 279 (2004) 42732–42741.
[33]N.K. Karamanos, P. Vanky, G.N. Tzanakakis, A. Hjerpe, Electrophoresis 17 (1996) 391–395.
[34] N.K. Karamanos, A. Hjerpe, Methods Mol. Biol. 171 (2001) 181–192.
[36] A. Seffouh, F. Milz, C. Przybylski, C. Laguri, A. Oosterhof, S. Bourcier, R. Sadir, E. Dutkowski, R. Daniel, T.H. van Kuppevelt, T. Dierks, H. Lortat-Jacob, R.R. Vives, FASEB J. 27 (2013) 2431–2439.
[37] E. Chabrol, A. Nurisso, A. Daina, E. Vassal-Stermann, M. Thepaut, E. Girard, R.R. Vives, F. Fieschi, PLoS One 7 (2012) e50722.
[38] F. Mundt, G. Heidari-Hamedani, G. Nilsonne, M. Metintas, A. Hjerpe, K. Dobra, Biomed. Res. Int. (2014) http://dx.doi.org/10.1155/2014/419853(Article ID 419853, 11 pages).
[39] R. Otvos, A. Szulkin, C.O. Hillerdal, A. Celep, E. Yousef-Fadhel, H. Skribek, A. Hjerpe, L. Szekely, K. Dobra, Genes Cancer 6 (2015) 119–128.
[40]F. Mundt, G. Nilsonne, S. Arslan, K. Csuros, G. Hillerdal, H. Yildirim, M. Metintas, K. Dobra, A. Hjerpe, PLoS One 8 (2013) e72030.
[41] A. Hjerpe, V. Ascoli, C.W. Bedrossian, M.E. Boon, J. Creaney, B. Davidson, A. Dejmek, K. Dobra, A. Fassina, A. Field, P. Firat, T. Kamei, T. Kobayashi, C.W. Michael, S. Onder, A. Segal, P. Vielh, Acta Cytol. 59 (2015) 2–16.
[42] J. Budczies, F. Klauschen, B.V. Sinn, B. Gyorffy, W.D. Schmitt, S. Darb-Esfahani, C. Denkert, PLoS One 7 (2012) e51862.
[43] G.W. Yip, M. Smollich, M. Gotte, Mol. Cancer Ther. 5 (2006) 2139–2148.
[44] F. Zong, E. Fthenou, F. Mundt, T. Szatmari, I. Kovalszky, L. Szilak, D. Brodin, G. Tzanakakis, A. Hjerpe, K. Dobra, PLoS One 6 (2011) e14816.
[45] D. Xu, J.D. Esko, Annu. Rev. Biochem. 83 (2014) 129–157.
[46] A. Ori, M.C. Wilkinson, D.G. Fernig, J. Biol. Chem. 286 (2011) 19892–19904.
[47] P.S. Ma, S.L. Beck, R.W. Raab, R.L. McKown, G.L. Coffman, A. Utani, W.J. Chirico, A.C. Rapraeger, G.W. Laurie, J. Cell Biol. 174 (2006) 1097–1106.
[48] J. Reiland, D. Kempf, M. Roy, Y. Denkins, D. Marchetti, Neoplasia 8 (2006) 596–606.
[49] A.C. Rapraeger, Curr. Opin. Cell Biol. 5 (1993) 844–853.
[50] J.J. Phillips, Oncotarget 3 (2012) 568–575.
[51] B. Gorsi, S.E. Stringer, Trends Cell Biol. 17 (2007) 173–177.
[52] J. Bengtsson, I. Eriksson, L. Kjellen, Biochemistry 42 (2003) 2110–2115.
[53] H. Arai, H. Nakayama, H. Ito, A. Fujita, M. Ikehara, G. Tanaka, F. Oshita, K. Yamada, I. Nomura, K. Noda, A. Mitsuda, Y. Kameda, Kyobu Geka 56 (2003) 593–596.
[54] J. Presto, M. Thuveson, P. Carlsson, M. Busse, M. Wilen, I. Eriksson, M. Kusche-Gullberg, L. Kjellen, Proc. Natl. Acad. Sci. U. S. A. 105 (2008) 4751–4756.
[55] K. Grobe, M. Inatani, S.R. Pallerla, J. Castagnola, Y. Yamaguchi, J.D. Esko, Development 132 (2005) 3777–3786.
[56]X. Ai, A.T. Do, M. Kusche-Gullberg, U. Lindahl, K. Lu, C.P. Emerson Jr., J. Biol. Chem. 281 (2006) 4969–4976.
[57]A.A. Alhasan, J. Spielhofer, M. Kusche-Gullberg, J.A. Kirby, S. Ali, J. Biol. Chem. 289 (2014) 20295–20306.
[58] W.C. Lamanna, M.A. Frese, M. Balleininger, T. Dierks, J. Biol. Chem. 283 (2008) 27724–27735.
[59] C.M. Vicente, M.A. Lima, E.A. Yates, H.B. Nader, L. Toma, Mol. Cancer Res. (2014)http://dx.doi.org/10.1158/1541-7786.MCR-14-0372.
[60] W. Ji, J. Yang, D. Wang, L. Cao, W. Tan, H. Qian, B. Sun, Q. Qian, Z. Yin, M. Wu, C. Su, PLoS One 6 (2011) e23274.
[61] K. Narita, J. Chien, S.A. Mullany, J. Staub, X. Qian, W.L. Lingle, V. Shridhar, J. Biol. Chem. 282 (2007) 14413–14420.
[62] J. Lai, J. Chien, J. Staub, R. Avula, E.L. Greene, T.A. Matthews, D.I. Smith, S.H. Kaufmann, L.R. Roberts, V. Shridhar, J. Biol. Chem. 278 (2003) 23107–23117.
[63] G. Pearson, F. Robinson, T.B. Gibson, B.E. Xu, M. Karandikar, K. Berman, M.H. Cobb, Endocr. Rev. 22 (2001) 153–183.
[64] M. Cargnello, P.P. Roux, Microbiol. Mol. Biol. Rev. 75 (2011) 50–83.
[65] S. Moniz, P. Jordan, Cell. Mol. Life Sci. 67 (2010) 1265–1276.
[66] B.E. Xu, S. Stippec, L. Lenertz, B.H. Lee, W. Zhang, Y.K. Lee, M.H. Cobb, J. Biol. Chem. 279 (2004) 7826–7831.
[67] X.T. Sun, L.Y. Gao, R.K. Yu, G.C. Zeng, J. Neurochem. 99 (2006) 1114–1121.
[68]R. Kanteti, I. Dhanasingh, I. Kawada, F.E. Lennon, Q. Arif, R. Bueno, R. Hasina, A.N. Husain, W. Vigneswaran, T. Seiwert, H.L. Kindler, R. Salgia, PLoS One 9 (2014).
[69] L.V. de Assis, J. Locatelli, M.C. Isoldi, Biochim. Biophys. Acta 1845 (2014) 232–247.
[70] S. Zhou, L. Liu, H. Li, G. Eilers, Y. Kuang, S. Shi, Z. Yan, X. Li, J.M. Corson, F. Meng, H. Zhou, Q. Sheng, J.A. Fletcher, W.B. Ou, Br. J. Cancer 110 (2014) 2479–2488.
[71] I. Mikami, F. Zhang, T. Hirata, J. Okamoto, K. Koizumi, K. Shimizu, D. Jablons, B. He, Oncol. Rep. 24 (2010) 1677–1681.
[72] J.P. Lai, D.S. Sandhu, A.M. Shire, L.R. Roberts, J. Gastrointest. Cancer 39 (2008) 149–158.
[73] Y. Wang, A.K. Rishi, W.J. Wu, L. Polin, S. Sharma, E. Levi, S. Albelda, H.I. Pass, A. Wali, Mol. Cell. Biochem. 357 (2011) 83–94.
[74]O. Melaiu, A. Cristaudo, E. Melissari, M. Di Russo, A. Bonotti, R. Bruno, R. Foddis, F. Gemignani, S. Pellegrini, S. Landi, Mutat. Res. 750 (2012) 132–140.
[75] Z. Chen, J.Q. Fan, J. Li, Q.S. Li, Z. Yan, X.K. Jia, W.D. Liu, L.J. Wei, F.Z. Zhang, H. Gao, J.P. Xu, X.M. Dong, J. Dai, H.M. Zhou, Int. J. Cancer 124 (2009) 739–744.
[76] Y. Takada, F. Shinkai, S. Kondo, S. Yamamoto, H. Tsuboi, R. Korenaga, J. Ando, Biochem. Biophys. Res. Commun. 205 (1994) 1345–1352.
[77]T.J. Wijnhoven, E.M. van de Westerlo, N.C. Smits, J.F. Lensen, A.L. Rops, J. van der Vlag, J.H. Berden, L.P. van den Heuvel, T.H. van Kuppevelt, Glycoconj. J. 25 (2008) 177–185.