HAL Id: hal-01129040
https://hal.archives-ouvertes.fr/hal-01129040
Submitted on 11 Mar 2015HAL is a multi-disciplinary open access archive for the deposit and dissemination of sci-entific research documents, whether they are pub-lished or not. The documents may come from teaching and research institutions in France or abroad, or from public or private research centers.
L’archive ouverte pluridisciplinaire HAL, est destinée au dépôt et à la diffusion de documents scientifiques de niveau recherche, publiés ou non, émanant des établissements d’enseignement et de recherche français ou étrangers, des laboratoires publics ou privés.
Ion track grafting: A way of producing low-cost and
highly proton conductive membranes for fuel cell
applications
Marie-Claude Clochard, T Berthelot, C Baudin, N Betz, Emmanuel Balanzat,
G Gébel, A Morin
To cite this version:
Marie-Claude Clochard, T Berthelot, C Baudin, N Betz, Emmanuel Balanzat, et al.. Ion track grafting: A way of producing low-cost and highly proton conductive membranes for fuel cell applications. Journal of Power Sources, Elsevier, 2010, 195, pp.223-231. �10.1016/j.jpowsour.2009.07.016�. �hal-01129040�
Ion track grafting: a way of producing low-cost and highly proton conductive membranes for Fuel Cell applications
M-C Clochard1*, T. Berthelot1, C. Baudin1, N. Betz†1, E. Balanzat2, G. Gébel3, A. Morin4
1. CEA - DSM/IRAMIS/LSI Ecole Polytechnique 91128 Palaiseau 2. CEA - DSM/IRAMIS/CIMAP BP 5133 14040 Caen
3. CEA - DSM /INAC/SPrAM CEA-Grenoble 4. CEA - DRT/Liten/DTH/LCPEM CEA-Grenoble 17 rue des Martyrs, 38054 GRENOBLE Cedex 9
*Corresponding author: Marie-Claude Clochard, Laboratoire des Solides Irradiés, CEA/DSM/IRAMIS/LSI, Ecole Polytechnique, 91128 Palaiseau - Tel : +33 (0) 1 69 33 45 26 - Fax : +33 (0) 1 69 33 45 54 - E-mail : marie-claude.clochard@polytechnique.edu
Abstract
Proton conductive individual channels through a PVDF matrix have been designed using the ion track grafting technique. The chosen polyelectrolyte, a sulfonated polystyrene (PSSA), has been radiografted all along the linear and cylindrical ion tracks of irradiated PVDF leading to the creation of privileged paths for proton conduction from the anode to the cathode without inducing any further porosity. Consequently, such ion track grafted PVDF-g-PSSA membranes have good gas permeation properties against H2 and O2 and keep this gas barrier
property up to 10 bars. A degree of grafting of 140wt% was chosen to ensure a perfect coverage of PSSA onto PVDF-g-PSSA surface and allows a sufficient exchange with the active layers of the Membrane Electrolyte Assembly (MEA). Fuel cell test has been performed during three days feeding the cell with pure H2 and O2, at the anode and cathode
side respectively. Temperature has been progressively increased from 50 to 80°C and performance has been evaluated by recording polarisation curves and electrochemical Impedance Spectroscopy at different current densities. From these last measurements, it has been possible to determine the resistance of the MEA during the fuel cell tests and, then to evaluate the conductivity of the membrane. The proton conductivities of such membranes have been estimated to be ranged between 36 mS.cm-1 and 61 mS.cm-1 depending on the conditions. These values are similar to that of perfluorosulfonated membrane such as Nafion in the same conditions.
Keywords : Ion track grafting; radiografting; swift heavy ions; proton conductivity; polymer
1. Introduction
One of the challenges of the twenty first century is to find the right membrane for fuel cell application, notably to develop non pollutant cars. The ideal membrane should satisfy to the following requirements: O2/H2 permeability lower than perfluorosulfonated membrane
such as Nafion, that is to say lower than 5 barrer at 80°C when fully humidified, high proton conductivity 10-2-10-1 S/cm at high temperature and low water content, especially above 80°C, chemical stability in the fuel cell conditions, especially versus oxidation, reduction, hydrolysis (working temperature 80°C-90°C, ideally 120°C, high H2, O2, H2O2 activities, low
pH~1, both high and low potential ~0 V at the anode and ~1,2V at cathode), and radical attack, especially those coming from the decomposition of H2O2 produced at the anode,
cathode, low swelling, high mechanical stablity and low-cost. Even the most common polymer electrolyte membranes used in fuel cells applications, the Nafion membranes from Dupont, do not fulfil completely these drastic requirements. Theses membranes consist of a hydrophobic fluorocarbon backbone assuring the mechanical support and hydrophilic sulfonic side chains for proton transfer. Despite some serious inconvenient such as a high cost (250 €/m2
), a water swelling shortening the membrane life time and conductivity losses at high temperature, the Nafion from Dupont is still the reference today. No new membrane is really able to reach its fuel cell test performances and life time.
Many other type of membranes have already been tested: i) non-fluorinated membranes1: sulfonated copolymers of polystyrene-polybutadiene, polyethersulfone, polyphenylenesulfone2, polyetherketone1,3-5, polyarylene ethers6, polyimides7, polybenzimidazole4,8, polyacrylates9-11 , oxadiazole-based polymers12 and ii) fluorinated membranes: TFE copolymers and many radiografted polystyrene or styrene derivatives onto fluorinated polymer such as ETFE or PVDF13-21. Even if some of them are promising, the general problem is the instability of the materials shortening the life times under fuel cell test
conditions22-25. Consequently, the trend is to reinforced theses new polymer electrolyte membranes either by adding some crosslinkers or by introducing an inorganic filler to improve the polymer membrane structure26-29. Radiation grafted membranes is widely investigated because of the double effect: i) functionalisation with proton conductive entities and ii) crosslinking if the radiation dose is higher than the dose gel of the polymer or if a radiation sensitive crosslinker such as di-vinyl benzene is used during the formulation.
Until now, ionising radiations such as electrons, -rays or X-rays ionising radiations have been used to radiograft homogeneously polymer foil18,30,31. The LSI in collaboration with the CIMAP uses a less studied kind of ionising radiation for polymer electrolyte membranes synthesis, the swift heavy ions (SHI) beam. Indeed, ions induce all along their trajectory through the solid a continuous trail of excitations and ionisations leading to formation of tracks called the latent tracks. The final heterogeneous solid is then formed of latent tracks (or highly damaged cylindrical zones) and pristine areas. The latent tracks are radically active and allow the copolymerisation with vinyl monomers. Ion track grafting was first performed by Monnin and Blanford in 197332 for detection of nuclear tracks. Since this pioneer work, a large majority of related publications has been written by N. Betz from the LSI33-37. Her unique experience in this field is still pursued today in our team.
The idea 38 was to keep the future proton exchange membrane stability by playing with SHI properties allowing to leave some pristine fluorinated polymer parts as a support matrix and to design proton conductive channels by radio-induced track grafting inside this same PVDF matrix (Figures 1). PVDF is a very appropriate material because of its high chemical resistance, its good mechanical properties and its hydrophobic fluorocarbon backbone. The channels consist of high density of proton conductive entities interpenetrated with PVDF
chains. All theses proton conductive entities are covalently bound to the PVDF support. Such membranes are estimated to cost no more than 10$/m2.
The present paper relies on fuel test performances of 40µm thick PVDF-g-PSSA polymer electrolyte membranes obtained from SHI track grafting. Electrochemical impedance spectroscopy (EIS) was used in parallel especially to determine the influence of the working parameters, such as outlet gas pressure, on the resistance of the MEA.
2. Experimental
2.1 Swift Heavy Ion radiation grafting : poly(PVDF-g-PS)
Prior to use, the 9 µm thick PVDF films produced by Solvay (Belgium) were extracted in a Soxhlet apparatus with toluene, during 24 hours. After drying at 60°C under vacuum for a night, the samples were irradiated in an helium atmosphere at the GANIL (Caen, France) with
78Kr31+ (Kr = 10 MeV.amu-1). The electronic stopping power of the Kr ions was 40
MeV.cm2.mg-1. The fluence was 1010ions/cm2.
The irradiated films were grafted with pure styrene for one hour at 60°C according to a process previously reported36. The grafting yield is given by Yw=(Wf-Wi)/Wi (%) where Wf
and Wi are the sample weights after and before grafting, respectively.
2.2 Functionalization : poly(PVDF-g-PSSA)
After swelling during 20 min in dichloromethane (CH2Cl2) at room temperature, the grafted
fluoropolymers, noted poly(PVDF-g-PS) were immersed in a chlorosulfonic acid solution at 10% for 30 min in order to add sulfonic acid groups (SO3H) on the phenyl ring of the
polystyrene. The chlorosulfonation proceeds by two successive reactions: the first one total and the second reversible, leading to the formation of sulfonate (SO3H) and chlorosulfonate
(SO2Cl) groups. A basic hydrolysis (NaOH 1 M, RT, 2h) is then performed to act on the
reversible reaction to convert the SO2Cl groups in SO3Na ones. Na+ are exchanged by H+ by
immersion in H2SO4 1M during 3h at room temperature in order to recover the sulfonic acid
groupps. After washing three times in deionised water, PVDF-g-PSSA membranes are dried gently at 50°C under vacuum for a night. The hydrolysis was followed using EDS probe coupled to FESEM. The hydrolysis was considered to be complete when the Cl ions K-ray signal was completely suppressed. The functionalization rate was around 60%.
2.3 Ion Exchange Capacity
The ion exchange capacity (IEC) is measured following a conventional rout. The membranes were first immersed in 1 M NaCl solution for 24 h at room temperature. The released protons were titrated against 0.01 M NaOH solution using phenolphthalein indicator. The IEC of the graft copolymer membranes was calculated using the following equation:
m N V. 1) -(meq.g IEC OH
where V is the volume of NaOH at the equivalence, NOH is the normality of NaOH and m the
total weight of polymer.
2.4 Water uptake
Water uptake was determine by weighing vaccum-dried membrane and fully equilibrated membrane with water. The membrane sample was wiped with an adsorbent paper to remove the excess of water and the sample was weigted. The water uptake was determined as follows:
100 . m m -m (wt%) uptake Water i i f
2.5 MEA preparation
Before starting the fuel cell test, the ion track grafted PVDF-g-PSSA membrane was fully hydrated by immersion in ultrapure water for 2 hours. The membrane was then directly piled up into a 5 cm² single cell designed by Quintech between two commercial gas diffusion electrodes E-LAT LT 140EW-SI from BASF. These electrodes are made with 30 wt% Pt/C and the catalyst loading of each is 0,5 mg/cm². The stress on the membrane has been calculated taking into account the compressive behaviours of the electrode and of the gasket and is about 1 MPa.
2.6 Fuel cell test
Fuel cell tests have been performed in co-flow configuration using a home made fuel cell test bench feeding the cell with pure H2 and O2 at the anode and cathode sides, respectively. The
relative humidity of each gas was controlled thanks to a bubbler and modified by the temperature of and by regulation of the temperature of the water. Relative humidity is calculated thanks to the following formula, that is to say, the ratio of the theoretical partial pressures of water at the temperature of the bubbler and at the cell temperature.
%RH = P0(Tbubbler)/P0(Tcell)
Tbubbler is the temperature of the bubbler
Tcell is the single cell test temperature.
The gas flows were kept constant at 40 ml/min for both hydrogen and oxygen up to 800 mA/cm²; So, the gas stoechiometries depend on the current density below this value and correspond to about 1,5 and 3 at 800 mA/cm² for H2 and O2 respectively. Above 800 mA/cm²
hydrogen gas flow was increased to keep a constant stoechiometry of 1,5.
The temperature of the single cell was controlled and progressively increased from 50°C to 80°C. The tests were performed at a pressure of 2 absolute bars for each temperature. During
the test, the temperature of the bubblers was kept constant around 30°C whatever the cell temperature. So, the relative humidity decreased as the cell temperature was increased. A test has also been performed at 80°C, 4 absolute bars and 100% relative humidity for each gas. The performance was measured in each condition by recording a polarisation curve. The current density was linearly with a scanning rate depending on the conditions. The cell was operated continuously during 50 hours.
2.6 Electrochemical Impedance Spectroscopy measurements
Electrochemical Impedance Spectroscopy (EIS) measurements have been performed in galvanodynamic mode with a Biologic potentiostat/impedancemeter VMP2 with a 20 A booster. The complex impedance was measured between 10 kHz and 0,3 Hz in each experimental conditions at different current densities. For each frequency decade, 10 measurements were made and the amplitude was at maximum 10% of the value of the current. For each frequency, the values were recorded after waiting 4 periods and were average on 4 periods.
3. Results and discussion
3.1 Ion track grafted PVDF-g-PSSA membranes
The ion track grafting technique allows the creation of channels of grafted polyelectrolyte all along the linear ion tracks inside a thin PVDF film (Figure 1). This structuration of the matter is very interesting to generate privileged paths for proton conduction without inducing any further porosity. Consequently, such membranes have good gas permeation properties against H2 and O2 and keep this gas barrier property up to 10 bars. Similar PVDF-g-PSSA
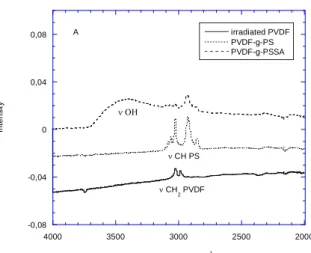
membranes have been already synthesized and characterized in our group for mainly biomedical purposes by FTIR39,40, XPS35,41, X-ray scattering and scanning electron studies31,42. The grafting heterogeneity of fluoropolymers irradiated by swift heavy ions in comparison to -ray was then well defined. In the present study, a high grafting yield of Yw=140wt% was chosen in order to radiograft not only inside the latent tracks but also to cover completely the membrane surface31 in order to have the maximum interfacial exchange with the active layer of the PEMFC. At this grafting level, the initial 9µm thick PVDF in beta phase reach 40µm of total thickness. The translucent initial PVDF aspect turns to a white shiny colour in the grafted PS part (Figure 2).
The FTIR spectra of the PVDF-g-PSSA obtained are in good agreement to that obtained previously40 and show under FTIR total reflexion mode a 100% covering of PS with the disappearance of PVDF CH2 stretching vibration bands at 2985 cm-1 and 3025 cm-1 (Figure 3)
in favour to the typical PS bands in that region.
IEC values are indicative of the actual ion exchange sites available for proton conductivity. The higher values of IEC are then desirable to achieve higher proton conductivity in polymer electrolyte membranes. Ion track grafted PVDF-g-PSSA membrane with 140 wt% of PS content exhibited a IEC of 2.97 meq.g-1, which is three times higher than that of Nafion®117 (table 1). The water uptake of ion track grafted PVDF-g-PSSA is also presented in table 1. The water uptake was found two times inferior of the value of Nafion®117. This is maybe due to the high stiffness of the polymer matrix which could limit the swelling of the membrane because of the internal stress induced by the volume increased of the hydrophilic part (The matrix is supposed to have no interaction with water).
The test was started at rather low temperature, that is to say around 30°C, in order to avoid dehydration of the membrane which could occure . The pressure was progressively increased up to 2 absolute bars with a flow of 40ml/min of fully humidified pure H2 and O2. The open
circuit voltage (OCV) reached the value of 980 mV within less than 3 minutes, then decreased to finally stabilise around 860 mV. This phenomena is not explained but is usually observed whatever the membrane. This could be due to the cross-over of H2. The stabilised OCV was
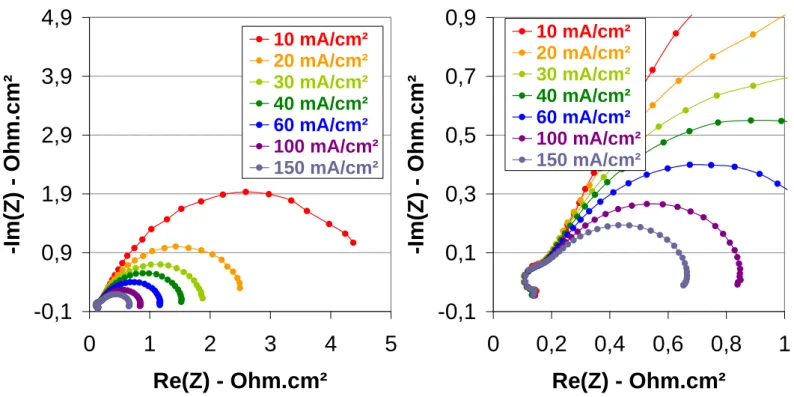
quite low but no evidence of membrane leakage has been observed. Then, the current has been very slowly increased up to 40 mA/cm² and the voltage was around 610 mV. The performance was very low, so cell temperature had been increased up to 50°C and after 45 minutes in this condition, that is to say, 50°C, 2 absolute bars and 35% RH, a polarisation curve had been recorded (Figure 4). The open circuit voltage was about 835 mV without any evidence of membrane failure and the performance was really poor: 6,5 mA/cm² at 700 mV. Three hypotheses are drawn to explain these results: high interface resistance between the membrane and the electrodes, a lack of hydration of the membrane or even of the ionomer within the active layer. So, impedance spectroscopy measurements have been performed in order to better understand the imitating phenomena (Figure 5).
For frequencies, raging from 2 to 10 kHz, the opposite of the imaginary part of the impedance (-Im(Z)) takes negative values. This is ascribed to inductive phenomena that can be due to the porous structure of the gas diffusion layers or the active layers. This is usually observed on the impedance spectra recorded on a running fuel cell. Whatever the current density, the first semi-circle intercepts the abscise axis for a frequency of approximately 2 kHz, that is to say that the imaginary part of the impedance is equal to zero. In this range of frequency, this is ascribed to a pure ohmic behaviour. So, the specific resistance correspond to the sum of all the ohmic phenomena, that is to say ionic resistance of the membrane, electronic resistance of the electrodes and of the single cell test fixture components, interface resistance between all
the electronic conducting cell components. We will make the hypothesis that the electronic resistance of the cables, the single cell test fixture components and the interfaces between them are negligible compared to the resistances within the MEA (components and interfaces: RMEA). It will be considered to be equal to the impedance values measured at ~2 kHz. It
appears clearly that RMEA does not depend on the current density and is about 56 mOhm, that
is to say 280 mOhm.cm² (Figure 5). The electronic resistance of the one electrode (Relec) is
lower than 10 mOhm.cm²1 and the contact resistance between the electrode and the monopolar plate (Rcontact) is about 5 mOhm.cm²2. So, the ionic resistance of the membrane and
membrane/electrodes interfaces (Rmembrane+Rinterfaces) is about 250 mOhm.cm². This value is
much lower than the one calculated from the slope of the linear part of the polarisation curve: ~5500 mOhm.cm². So, it is not possible to evaluate the membrane or either the MEA resistance from the polarisation curve. If we assume that there is no contact interface, that the surface (S) is 5 cm² and that the water content within the membrane is homogeneous on the whole surface area and within the thickness, we can calculate the conductivity of the membrane (), knowing its thickness (e~40 µm) thanks to the equation: Rmembrane=e/S. This
conductivity is about 1,6x10⁻² S/cm which is lower than PFSA membrane3. This value of conductivity is very high if we consider that the membrane swelling is the same in the running fuel cell at 50°C than in water at 25°C, that is to say about 5 water molecule per sulfonic acid group. Indeed, for the same water content the proton conductivity of Nafion® is only mS/cm at 80°C.. This could probably be explained by the structure of these membranes with proton conducting channel through the surface of the membrane. However, this proton conductivity can not explain the very low performance and we have to consider the contributions of all the overpotentials, that is to say all the phenomena to understand the results. We can do this from the value of the impedance at low frequency when the imaginary part of the impedance is
1 S. Escribano, J.F. Blachot, J. Etheve, A. Morin, R. Mosdale, J. Power Sources 156 (2006) 8. 2
I. Nitta, T. Hottinen , O. Himanen, M. Mikkola, J. Power Sources 171 (2007) 26.
null. For example, at 15 mA/cm² the impedance value is 1 Ohm, that is to say that the specific resistance is about 5000 mOhm.cm², which is in better agreement with the one calculated from the slope of the polarisation curve.
In the Niquist plot, two contributions appears clearly on the spectra (Figure 5). These are not true semi-circle maybe because of the heterogeneities within the electrochemical behaviour on the whole electroactive area. The first contribution with a characteristic frequency of about 200 Hz increases with the current density. It could be ascribed to concentration overpotential and more precisely to an increase of the anodic overpotential. It is quite surprising at this very low current density but may be due to the drying of the anode caused by the electroosmosis of water from the cathode to the anode and by a lack of water back-flow from the cathode to the anode side. The second contribution with a characteristic frequency of a few Hz decreases as the current density increases. In this frequency range, it is generally ascribed to the charge transfer phenomena at the cathode side4. So, it is linked to the activation overpotantial of the oxygen reduction reaction (ORR). This specific charge transfer resistance is about 1000 mOhm.cm² at 60 mA/cm². This is a very high value, probably because the cathode is not well hydrated since the current density is very low. So, the very low performances at the beginning of the test are, at least, partly due to charge transfer overpotentials, of course at the cathode side but also probably at the anode side. This could also be due to a bad membrane electrode interface which does not give an ohmic contribution at high frequency.
A second polarisation curve has been recorded after about 17 hours in these conditions (50°C, 2 absolute bars and 35% RH) even if the equilibrium has not been reached (Figure 5). The performances considerably increased during this conditioning step as well as the open circuit voltage which reached about 920 mV. The increase of voltage at fixed current density is very slow compared to perfluorosulfonated membrane which usually reaches the equilibrium in
approximately 8 hours using this type of electrode. This behaviour has never been observed before using this kind of commercial electrodes so it can be hardly ascribed to this component. It could be due to interfaces between the membrane and the electrodes which are improved progressively during the operation or to a progressive hydration of the anode side due to the increase of water back-flow and also of the cathode side.
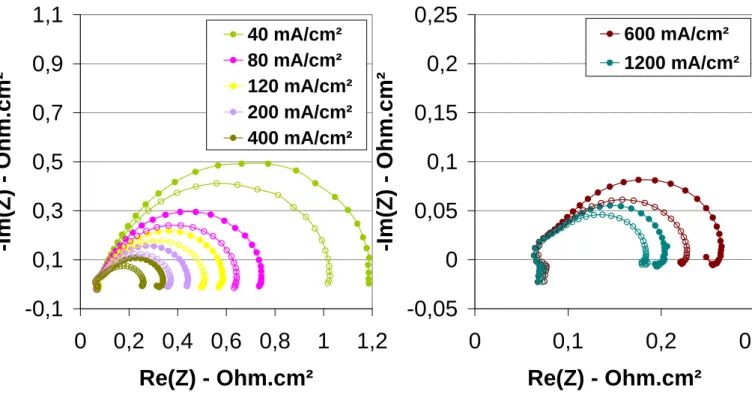
It can be seen on impedance spectra in the Niquist plot 2 contributions (Figure 6). The first one with a characteristic frequency of 1 kHz does not depend of the current density and corresponds probably to the loading of the electrochemical double layer. This contribution does not appear on the spectra recorded after 45 minutes in these conditions. Indeed, at the beginning of the test, the ionomer in the active layer maybe at the cathode side but most probably at the anode side is not well hydrated and, as a consequence, the electroactive surface area is very low. This could explain the low OCV measured at the beginning of the test whereas the membrane showed no significant cross-over. The second contribution with a characteristic frequency of a few Hz which decreases as the current density increases is ascribed to the charge transfer at the cathode side. The semi-circle with a characteristic frequency of about 200 Hz does not appear after 17 hours, probably because of a better hydration the anode side thanks to the back-diffusion of water from the cathode to the anode. The specific resistance of the MEA was about 110 mOhm.cm² after 17 hours and is lower than at the very beginning of the test (Figure 7). It could be due either to the increase of membrane conductivity, either to a decrease of the contact resistance between the membrane and the electrodes. The corresponding proton conductivity of the membrane of 5x10⁻² S/cm, assuming the hypotheses described above.
The performance progressively increased with the temperature up to 70°C whereas the relative humidity at the gas inlets decreased from 35% at 50°C to 15%RH (Figure 8). From the polarisation curves, it seems that the increase in performance is mainly due to a decrease
of the overpotentials at low current density. Indeed, at 40 mA/cm², the cell voltages are respectively 742, 790 and 822 mV at 50, 60 and 70°C. In this range of current density, the overpotentials are generally ascribed to the activation overpotantial of the ORR. However, at 40 mA/cm², it appears from the impedance spectra that there is no significant difference in the activation resistance measured at 50 and 60°C. The difference in the specific resistance ascribed to the charge transfer of the ORR is more important between 60 and 70°C, respectively 1460 and 1060 mOhm.cm². So, there is not a direct link between this charge transfer specific resistance and the performance. There is a continuous modification of the shape of the impedance spectra in the frequency range usually ascribed to the double layer (1 to 10 kHz). It could be due to a modification of the membrane electrode interface or to the hydration of the anode active layer. The specific resistance of the MEA decreases as the temperature increases: 80 and 75 mOhm.cm² at 60 and 70°C respectively. However, the increase in performance could not only be ascribed to this decrease of the MEA specific resistance since it would correspond to an increase of 14 mV of the cell voltage at 400 mA/cm² between 50 and 70°C. This could be due to an increase in membrane proton conductivity which was about 8x10⁻² S/cm and 9x10⁻² S/cm at 60 and 70°C respectively if calculated with the latter hypotheses. The increase in membrane conductivity can be explained by an increase of water content induced by the increase of the water back-flow from the cathode to the anode side with temperature. This will also lead to an increase of hydration of the ionomer at the anode side and consecutively to a reduction of the anodic overpotential. The performance started to decrease when the cell temperature was increased at 80°C since the relative humidity was as low as a 10%RH. Even if no electrochemical characterisations have been performed, it was probably due to a drying of the membrane. So, the relative humidity has been increased up to 100%RH in order to avoid this phenomenon. As it can be seen on Figure 9, performance increases with the pressure at 80°C, 100%RH and are much
higher than those recorded at 70°C. OCV is respectively 920, 970 1006 mV, at 70°C, 80°C 100%RH 2 and 4 bars. There is no significant change in MEA specific resistance between 2 and 4 bars at 80°C 100%RH but the charge transfer resistance of the ORR decreases as the pressure increases. This behaviour is expected since the concentration of the reactants, especially oxygen increases with pressure, whereas the hydration of the membrane is not modified since the gases are fully humidified. These evolutions of the impedance spectra with the operating conditions are in agreement with those of the polarisation curves. At 80°C 4 bars with pure and fully humidified H2 an O2, the cell voltage is 670 mV at 1 A/cm².
4. Conclusion
Grafted PVDF-g-PSSA membrane have been tested in fuel cell continuously during 50 hours in different operating conditions up to 80°C using pure H2 and O2. The performance slowly
increases with time and with temperature up to 70°C. The proton conductivity calculated from the MEA specific resistance, neglecting the resistance of the cell and taking into account electrodes and electrodes/bipolar plate interface resistances, is 8x10⁻² S/cm. This value is quite similar to the one of Nafion membrane in the same operating conditions. It is a very high value regarding the number of water molecule per sulfonic acid group which is about 5 when the membrane is fully hydrated. Indeed, the conductivity of Nafion with this water content is only about ?? S/cm at 80°C. This could be due to the unique structure of this membrane which have straight and large (~50 nm) proton conducting channels. However, the performances in a running fuel cell are lower than with a Nafion of the same thickness. This difference in performance with Nafion and the behaviour of the membrane in the different operating conditions could be due to the interfacial resistance between the membrane and the electrodes and/or to the water back-flow from the anode to the cathode. Because of the chemical composition of the membrane and the scale of proton conducting channel structure which covers about 74% of the surface, the interface resistance between the membrane and
the commercial electrode which contains perfluorosulfonic acid (PFSA) ionomer could be higher than with a Nafion membrane. In addition, the membrane reacts as if the back-flow of water from the cathode to the anode is low, which leads to a drying of the anode and increases the overpotentials. Work is in progress in order to understand more clearly the behaviour of the membrane since we obtain very promising results with these first tests.
The proton exchange functionalities were based exclusively on sulfonic acid (-SO3H). Other
functionnalities have to be introduced to test the best candidate. As phosphoric acid (-PO3H2)
groups are already known to be more efficient at high temperature. A mixture of these two kinds of functions may enlarge membrane working temperature range. As discussed in this paper, higher the working temperature, better were the PEM performances and it may preserve cathodic flooding as well as catalyst poisoning. Consequently more chemistry is ongoing to test the bi-functionalisation all along the proton conductive channels 46.
Acknowledgement
This work was supported by CEA-DRT/LITEN (Grenoble, France) in the framework of NTE French program.
References
(1) Smitha, B.; Sridhar, S.; Khan, A. A. Journal of Membrane Science 2005, 259, 10-26. (2) Saarinen, V.; Kreuer, K. D.; Schuster, M.; Merkle, R.; Maier, J. Solid State Ionics
2007, 178, 533-537.
(3) Zhu, X.; Liang, Y.; Pan, H.; Jian, X.; Zhang, Y. Journal of Membrane Science 2008,
312, 59-65.
(4) Jones, D. J.; Rozière, J. Journal of Membrane Science 2001, 185, 41-58.
(5) Ramani, V.; Swier, S.; Shaw, M. T.; Weiss, R. A.; Kunz, H. R.; Fenton, J. M. J.
(6) Choi, D. H.; Lee, J.; Kwon, O.; Kim, J. Y.; Kim, K. Journal of Power Sources 2008,
178, 677-682.
(7) Lee, C. H.; Park, C. H.; Lee, Y. M. Journal of Membrane Science 2008, 313, 199-206.
(8) Wainright, J. S.; Wang, J. T.; Weng, D.; Savinell, R. F. J. Electrochem. Soc. 1995,
142, 121.
(9) Shen, Y.; Xi, J.; Qiu, X.; Zhu, W. Electrochimica Acta 2007, 52, 6956-6961. (10) Choi, J. K.; Lee, D. K.; Kim, Y. W.; Min, B. R.; Kim, J. H. Journal of Polymer
Science Part B - Polymer Physics 2008, 46, 691-701.
(11) Liu, B. H.; Li, Z. P.; Chen, L. L. Journal of Power Sources 2008, 180, 530-534. (12) Gomes, D.; Roeder, J.; Ponce, M. L.; Nunes, S. P. Journal of Power Sources 2008,
175, 49-59.
(13) Brack, H. P.; Wyler, M.; Peter, G.; Scherer, G. G. Journal of Membrane Science
2003, 214, 1-19.
(14) Huang, H. S.; Chen, C. Y.; Lo, S. C.; Lin, C. J.; Chen, S. J.; Lin, L. J. Applied
Surface Science 2006, 253, 2685-2689.
(15) Qiu, J.; Zhao, L.; Zhai, M.; Ni, J.; Zhou, H.; Peng, J.; Li, J.; Wei, G. Journal of
Power Sources 2008, 177, 617-623.
(16) Kim, Y. W.; Lee, D. O.; Lee, K. J.; Kim, J. H. European Polymer Journal 2008, 44, 932-939.
(17) Saarinen, V.; Himanen, O.; Kallio, T.; Sundholm, G.; Kontturi, K. Journal of Power
Sources 2007, 163, 768-776.
(18) Flint, S. D.; Slade, R. C. T. Solid State Ionics 1997, 97, 299-307.
(19) Lehtinen, T.; Sundholm, G.; Holmberg, S.; Sundholm, F.; Björnbom, P.; Bursell, M. Electrochemica Acta 1998, 43, 1881-1890.
(20) Souzy, R.; Ameduri, B.; Boutevin, B.; Gébel, G.; Capron, P. Solid State Ionics 2005,
176, 2839-2848.
(21) Kim, Y. W.; Choi, J. K.; Park, J. T.; Kim, J. H. Journal of Membrane Science 2008,
313, 315-322.
(22) Mattson, B.; Ericson, H.; Torell, L. M.; Sundholm, F. Electrochimica Acta 2000, 45, 1405-1408.
(23) Kundu, S.; Karan, K.; Fowler, M.; Simon, L. C.; Peppley, B.; Halliop, E. Journal of
Power Sources 2008, 179, 693-699.
(24) Prasanna, M.; Cho, E. A.; Lim, T.-H.; Oh, I.-H. Electrochemica Acta 2008, 53, 5434-5441.
(25) Mittal, V. O.; Kunz, H. R.; Fenton, J. J. Electrochem. Soc. 2006, 153, A1755-A1759. (26) Souzy, R.; Ameduri, B. Progress in Polymer Science 2005, 30, 644-687.
(27) Herz, H. G.; Kreuer, K. D.; Maier, J.; Scharfenberger, G.; Schuster, M. F. H.; Meyer, W. H. Electrochimica Acta 2003, 48, 2165-2171.
(28) Anis, A.; Banthia, A. K.; Bandyopadhyay, S. Journal of Power Sources 2008, 179, 69-80.
(29) Zhang, Y.; Zhang, H.; Bi, C.; Zhu, X. Electrochimica Acta 2008, 53, 4096-4103. (30) Hietala, S.; Skou, E. M.; Sundholm, F. Polymer 1999, 40, 5567-5573.
(31) Aymes-Chodur, C.; Betz, N.; Porte-Durrieu, M.-C.; Baquey, C.; Le Moël, A.
Nuclear Instruments and Methods in Physics Research B 1999, 377-385.
(32) Monnin, M. M.; Blanford, G. E. Science 1973, 181, 743-744.
(33) Betz, N.; Ducouret, C.; Le Moël, A. Nuclear Instruments and Methods in Physics
Research B 1994, 151-156.
(35) Betz, N.; Dapoz, S.; Guittet, M.-J. Nuclear Instruments and Methods in Physics
Research B 1997, 252-259.
(36) Betz, N.; Le Moël, A.; Duraud, J.-P.; Balanzat, E.; Darnez, C. Macromolecules
1992, 213-219.
(37) Betz, N.; Balanzat, E.; Le Moël, A.; Duraud, J.-P. Radiation Effects and Defects in
Solids 1993, 126, 221-224.
(38) Clochard, M.-C.; Berthelot, T. In CEA: France, 2007; p FR0757875.
(39) Ducouret, C.; Petersohn, E.; Betz, N.; Le Moël, A. Spectrochimica Acta 1995, 51A, 567-572.
(40) Dapoz, S.; Betz, N.; Le Moël, A. J. Chim. Phys. 1996, 58-63.
(41) Dapoz, S.; Betz, N.; Guittet, M.-J.; Le Moël, A. Nuclear Instruments and Methods in
Physics Research B 1995, 120-125.
(42) Gébel, G.; Ottomani, E.; Allegraud, J.-J.; Betz, N.; Le Moël, A. Nuclear Instruments
and Methods in Physics Research B 1995, 145-149.
(43) Pattamarat, K.; Hunsom, M. Korean J. Chem. Eng. 2008, 25, 245-252.
(44) Gébel, G.; Diat, O.; Escribano, S.; Mosdale, R. Journal of Power Sources 2008, 179, 132-139.
(45) Keh, H. J.; Ma, H. C. Journal of Power Sources 2008, 2008, 711-718. (46) Berthelot, T.; Clochard, M.-C. In CEA: France, 2007; p FR0757873.
Figure caption
Figure 1.Scheme of swift heavy irradiation of penetrating ions through a polymeric foil, the latent track formation and the subsequent ion grafting localized inside the latent track. Example: SEM micrograph of the cross-section of an ion-track grafted PVDF-g-PS membrane.
Figure 2. Photo of an ion track grafted PVDF-g-PSSA membrane (fluence 1010 ions/cm2) : white part corresponds to the radiografted part (grafting yield of 140 wt%), translucent part corresponds to the non-irradiated part (SHI beam width = 4cm)
Figure 3: FTIR spectra of the 78Kr31+ irradiated PVDF, ion grafted PVDF with Polystyrene
(PVDF-g-PS) –grafting yield Yw= 140 wt%- and subsequent sulfonation (PVDF-g-PSSA): (A)
4000-2000 cm-1, region (B) 2500-500 cm-1 region.
Figure 4. Polarisation curves recorded during the conditioning step, after 45 minutes and 17
hours of operation at 50°C with pure H2 and O2 at 2 bars and 35%RH.
Figure 5. Impedance spectroscopy measurements recorded during the conditioning step, after
45 minutes of operation at 50°C with pure H2 and O2 at 2 bars and 35%RH.
Figure 6. Impedance spectroscopy measurements recorded during the conditioning step after
17 hours of operation at 50°C with pure H2 and O2 at 2 bars and 35%RH.
Figure 7. Comparison of the impedance spectra recorded during the conditioning step after
after 45 minutes and 17 hours of operation at 50°C with pure H2 and O2 at 2 bars and
Figure 8. Comparison of polarisations curve recorded at 50, 60 and 70°C with pure H2 and
O2 at 2 bars.
Figure 9. Impedance spectroscopy measurements recorded at 40 mA/cm² and 50, 60 and
70°C with pure H2 and O2 at 2 bars.
Figure 10. Comparison of polarisations curve recorded at 80°C with pure H2 and O2 and
100%RH at 2 and 4 bars
Figure 11. Comparison of the impedance spectra recorded at 80°C with pure fully h umidified
H2 and O2 at 2 bars (full symbol) and 4 barrs (open symbols).
Table caption.
Table 1. IEC, water uptake and proton conductivities of ion track grafted PVDF-g-PSSA with 140 wt% PS content at various gas relative humidities, gas supplies and temperatures.
Figure 1.
Figure 2.
Figure 3. -0,08 -0,04 0 0,04 0,08 2000 2500 3000 3500 4000 irradiated PVDF PVDF-g-PS PVDF-g-PSSA In te n si ty Wavenumber (cm-1 ) CH PS CH2 PVDF A -0,1 0 0,1 0,2 0,3 0,4 0,5 0,6 0,7 500 1000 1500 2000 2500 irradiated PVDF PVDF-g-PS PVDF-g-PSSA In te n sity Wavenumber (cm-1) aromatic ring SO 3 w SO 2 w CC PS aromatic B
Figure 4. 400 500 600 700 800 900 1000 0 50 100 150 200 250 300 350 400
Current density (mA/cm²)
Ce ll volt age ( mV) After 45 minutes After 17 hours Figure 5 -0,1 0,9 1,9 2,9 3,9 4,9 5,9 6,9 7,9 8,9 0 1 2 3 4 5 6 7 8 9 Re(Z) - Ohm.cm² -I m( Z) - Ohm. cm² 4 mA/cm² 8 mA/cm² 16 mA/cm² 24 mA/cm² 32 mA/cm² 40 mA/cm² 50 mA/cm² 60 mA/cm² 20 mA/cm²
Figure 6 Figure 7
-0,1
0,1
0,3
0,5
0,7
0,9
0
0,2
0,4
0,6
0,8
1
Re(Z) - Ohm.cm²
-I
m(
Z)
-
Ohm.
cm²
10 mA/cm² 20 mA/cm² 30 mA/cm² 40 mA/cm² 60 mA/cm² 100 mA/cm² 150 mA/cm²-0,1
0,9
1,9
2,9
3,9
4,9
0
1
2
3
4
5
Re(Z) - Ohm.cm²
-I
m(
Z)
-
Ohm.
cm²
10 mA/cm² 20 mA/cm² 30 mA/cm² 40 mA/cm² 60 mA/cm² 100 mA/cm² 150 mA/cm²Figure 8. 400 500 600 700 800 900 1000 0 50 100 150 200 250 300 350 400
Current density (mA/cm²)
Ce ll volt age ( mV) 70°C_2barsa, 15%HR 60°C_2barsa, 20%HR 50°C_2barsa, 35%HR Figure 9.
-0,1
0,9
1,9
2,9
3,9
4,9
5,9
0
1
2
3
4
5
6
Re(Z) - Ohm.cm²
-I
m(
Z)
-
Ohm.
cm²
20 mA/cm² 20 mA/cm² 40 mA/cm² 40 mA/cm² 60 mA/cm² 60 mA/cm²-0,1
0,4
0,9
1,4
1,9
0
0,5
1
1,5
2
Re(Z) - Ohm.cm²
-I
m(
Z)
-
Ohm.
cm²
20 mA/cm² 20 mA/cm² 40 mA/cm² 40 mA/cm² 60 mA/cm² 60 mA/cm²Figure 10. 400 500 600 700 800 900 1000 1100 0 100 200 300 400 500 600 700 800 900 1000
Current density (mA/cm²)
Cell voltage (mV) 80°C_4bars, 100%HR 80°C_2bars, 100%HR 70°C_2barsa, 15%HR
-0,1
0,3
0,7
1,1
1,5
0
0,4
0,8
1,2
1,6
Re(Z) - Ohm.cm²
-I
m(
Z)
-
Ohm.
cm²
50°C, 35%RH 60°C, 20%RH 70°C, 15%RH-0,05
0
0,05
0,1
0,15
0
0,05
0,1
0,15
0,2
Re(Z) - Ohm.cm²
-I
m(
Z)
-
Ohm.
cm²
50°C, 35%RH 60°C, 20%RH 70°C, 15%RHFigure 11. Table 1. Polymer electrolyte membrane IEC (meq.g-1) Water uptake (wt%)
RH (%) Gas feed rate (Bar)
T (°C) (mS.cm-1)
Ion track grafted PVDF-g-PSSA 2.97 17 35 20 15 100 100 2 2 2 2 4 50 60 70 80 80 36 51 55 60 61 Nafion®117 0.95 40 ? ? ? ?