HAL Id: cea-01481107
https://hal-cea.archives-ouvertes.fr/cea-01481107
Submitted on 2 Mar 2017HAL is a multi-disciplinary open access
archive for the deposit and dissemination of sci-entific research documents, whether they are pub-lished or not. The documents may come from teaching and research institutions in France or abroad, or from public or private research centers.
L’archive ouverte pluridisciplinaire HAL, est destinée au dépôt et à la diffusion de documents scientifiques de niveau recherche, publiés ou non, émanant des établissements d’enseignement et de recherche français ou étrangers, des laboratoires publics ou privés.
SENSOR COUPLED TO A SUPERCONDUCTING Nb
FLUX TRANSFORMER
Raffaele Sinibaldi, Cinzia de Luca, Jaakko O. Nieminen, Angelo Galante,
Vittorio Pizzella, Piero Sebastiani, Myriam Pannetier-Lecoeur, Antonietta
Manna, Piero Chiacchiaretta, Gabriella Tamburro, et al.
To cite this version:
Raffaele Sinibaldi, Cinzia de Luca, Jaakko O. Nieminen, Angelo Galante, Vittorio Pizzella, et al.. NMR DETECTION AT 8.9 mT WITH A GMR BASED SENSOR COUPLED TO A SUPERCON-DUCTING Nb FLUX TRANSFORMER. Progress In Electromagnetics Research, EMW Publishing, 2013, 142, pp.389 - 408. �10.2528/PIER13070404�. �cea-01481107�
NMR DETECTION AT 8.9 mT WITH A GMR BASED SENSOR COUPLED TO A SUPERCONDUCTING Nb FLUX TRANSFORMER
Raffaele Sinibaldi1, 2, *, Cinzia De Luca1, 2,
Jaakko O. Nieminen1, 2, 3, Angelo Galante4, 5,
Vittorio Pizzella1, 2, Piero Sebastiani6,
Myriam Pannetier-Lecoeur7, Antonietta Manna1, 2,
Piero Chiacchiaretta1, 2, Gabriella Tamburro1, 2, Antonello Sotgiu4, 5, 6, Claude Fermon7,
Gian Luca Romani1, 2, and Stefania Della Penna1, 2
1Institute of Advanced Biomedical Technologies, “G. D’Annunzio”
University, Chieti 66100, Italy
2Department of Neuroscience and Imaging, “G. D’Annunzio”
University, Chieti 66100, Italy
3Department of Biomedical Engineering and Computational Science,
Aalto University School of Science, Espoo, Finland
4MESVA, Department of Life, Health & Environmental Sciences,
L’Aquila University, Via Vetoio 10, Coppito, L’Aquila 67100, Italy
5Laboratori Nazionali del Gran Sasso, Istituto Nazionale di Fisica
Nucleare, S.S. 17 bis km 18910, Assergi, L’Aquila 67010, Italy
6ITA S.r.l., Zona Industriale di Pile, SS17, Localit`a Boschetto,
L’Aquila 67100, Italy
7DSM/IRAMIS/SPEC, CNRS URA 2464, CEA Saclay, 91191 Gif sur
Yvette Cedex, France
Abstract—This study presents NMR signal detection by means of a superconducting channel consisting of a Nb surface detection coil inductively coupled to a YBCO mixed sensor. The NMR system operates at a low-field (8.9 mT) in a magnetically shielded room suitable for magnetoencephalographic (MEG) recordings. The main field is generated by a compact solenoid and the geometry of the pick-up coil has been optimized to provide high spatial sensitivity
Received 4 July 2013, Accepted 19 August 2013, Scheduled 8 September 2013
in the NMR field of view. The Nb detection coil is coupled to the mixed sensor through a Nb input coil. The mixed sensor consists of a superconducting YBCO loop with 2-µm constriction above which two Giant MagnetoResistance sensors are placed in a half-bridge configuration to detect changes of the bridge voltage as a function of the flux through the YBCO loop. The sensitivity of the receiving channel is calibrated experimentally. The measured spatial sensitivity is in agreement with the simulations and is ∼10 times better than that of the stand-alone mixed sensor. A NMR echo at 375 kHz shows a SNR only a factor 4 smaller than a tuned room temperature coil tightly wound around the sample, with a noise level which is a factor 3 better than for the volume coil. Our results suggest that mixed sensors are suitable for the integration of low-field MRI and MEG in a hybrid apparatus, where MEG and MRI would be recorded by SQUIDs and mixed sensors, respectively.
1. INTRODUCTION
Nuclear magnetic resonance (NMR) spectroscopy and magnetic resonance imaging (MRI) are pre-eminent techniques for determining the structure of organic compounds and for medical imaging. MRI has evolved towards ever-higher applied field strengths with the aim at increasing the signal to noise ratio (SNR). However, during the last decade, some advantages of working at very low static fields (below 100 mT) have been suggested [1, 2]. Such low-field NMR apparatuses, as compared to conventional high-field scanners, provide a higher frequency resolution of NMR lines [3, 4], are less prone to susceptibility artefacts, require only moderate relative homogeneity of the static field [5] and, notably, the possibility of exploiting enhanced T1 contrast at low-field strengths, e.g., for the detection of tumours, has been recently suggested [6]. Finally, low-field NMR apparatuses can be integrated with other medical modalities such as magnetoencephalography (MEG) [7–9].
At low magnetic fields, due to the low resonance frequency which leads to decreased SNR, standard room temperature detectors based on Faraday’s induction law become less effective with respect to high field set-ups. Therefore, much effort has been devoted to design and develop optimized sensors and prototypes relying on superconducting devices. Indeed, recent studies have demonstrated the feasibility of low-field NMR/MRI detection based on Superconducting QUantum Interference Devices (SQUID), relying on a measurement magnetic field ∼ 100 µT combined with a pulsed prepolarizing field ∼ 10 to 100 mT [9, 10]. The latter is needed to increase the magnetization of
the sample and hence the signal strength. High quality low-field NMR measurements have been also performed to access J-coupling effects in simple molecules dissolved in water using a precession field of about 100 nT and a prepolarizing field of 250 µT with a spectral resolution of 500 MHz [11], and to measure nuclear magnetic relaxation of pure water in the low-frequency regime from a few Hz up to 2 kHz [12].
The possibility of recording low-field NMR signals opens up the prospect of constructing instruments able to concurrently acquire MRI and MEG data. Such devices may substantially improve MEG source localization. Indeed, spatial resolution of MEG source localization is limited by errors in the co-registration of functional and anatomical data, the latter usually obtained with high-field MRI recorded in a separate session. The possibility of using the same SQUID sensors for MEG and MRI has already been demonstrated [7, 9].
Recently, mixed sensors (MS) have been proposed as an alternative for low-field NMR detection [13, 14]. MSs are based on giant magnetoresistive (GMR) sensors, which are field sensitive devices, and have been conceived to increase the sensitivity of GMR sensors through a flux to field transformer. This is a superconducting loop closed by a micrometer sized constriction, on which microscopic GMR spin valves are deposited [15, 16]. When an external field is applied through the superconducting loop, a supercurrent flows in the loop generating a very high coplanar magnetic field above and below the constriction. This field induces variations of the GMR resistances which are detected by a sensing current of the order of few mA. The advantage of using mixed sensors in low-field NMR/MRI lies in their robustness to applied fields, allowing operation in measurement fields larger than those usually adopted in SQUID based systems.
Here, we present an untuned superconducting receiver channel designed for low-field NMR at 8.9 mT compliant with MEG instrumentation. It comprises a niobium (Nb) flux transformer made by a large double-D gradiometric pick-up coil (≈ 80 mm radius) in series with a spiral input coil inductively coupled to the YBCO superconducting loop of a MS. The whole detection channel is operated in liquid helium although the MS loop is made of YBCO. Indeed, wire wound YBCO coils are not practicable, thus the pick-up loop has been wound using commercially available Nb wire. The apparatus is designed to be operated inside a magnetically shielded room (MSR), since the ultimate goal is to integrate it with MEG. The NMR is performed without prepolarization in a static magnetic field generated by a compact, low power copper solenoid working at room temperature.
2. OVERVIEW OF THE EXPERIMENTAL SET-UP
The superconducting channel described here for NMR signal detection has been designed to be compliant with a MEG system. Thus, the NMR set-up is placed in a MSR. Indeed, MEG devices operate inside MSRs which provide eddy current and magnetic shielding for reducing the environmental background field at high and low frequencies respectively. The superconducting detection channel is hosted in a low noise dewar for biomagnetic applications, originally designed for MEG (CTF Systems, Inc, model SST-160 custom). The MS and the pick-up coil are mounted on a non-magnetic fiberglass probe. The pick-up coil is designed to fit the curved bottom of the dewar tail and has a double-D-shape (see section “Pick-up loop design”). The distance between the inside and outside dewar bottoms is ≈ 1.5 cm.
The main magnetic field for NMR is generated by a room temperature solenoid coaxial with the dewar tail. The solenoid is end-compensated to improve the field homogeneity. It is ≈ 40 cm high, its external diameter is ≈ 31 cm and the internal diameter is ≈ 22 cm, matching the external diameter of the dewar tail. The field homogeneity is 150 ppm in a cubic Field of View (FOV) of ≈ 125 cm3.
The magnetic field of ≈ 8.9 mT is generated by a 3.85 A current requiring less than 60 W of power. Given the small FOV of the present set-up, other coil geometries could also be used for generation of the main field, however the solenoidal geometry is more efficient in terms of power consumption and produces a weak field on the MSR walls. In our case the stray magnetic residual field is ≈ 100 µT at ≈ 80 cm from the solenoid edge, corresponding to the distance to the MSR floor. Thanks to this geometry, it is possible to scale up the device to a system capable to host a human head, while still generating the same MRI field strength.
The NMR system is equipped with a room temperature transmitter coil and a receiver volume coil, the latter to be used as a reference. The transmitter and the receiver coils are two independent tuned saddle coils wound on a plastic cylindrical frame at a relative angle of ≈ 90◦ to each other in order to minimize their coupling. The
room temperature receiver volume coil has a quality factor (Q) of ≈ 110.
2.1. The Mixed Sensor — Stand-alone and Coupled Configurations
Generally, in a stand-alone configuration, MS measures the magnetic field through 2 or 4 GMR yokes placed on the constriction of the
sensing superconducting loop in a half- or full-bridge configuration, respectively. When an external magnetic field is applied to the superconducting loop, a supercurrent flows to maintain a zero flux through the loop. Thus, Φ = Φe + LMSIMS = 0, where Φe is the
external applied flux and LMS and IMS are the inductance of the MS
loop and the supercurrent flowing in it, respectively. The current flow through the constricted area leads to a very high coplanar magnetic field which is detected by the thin-film GMR yokes. The MS gain GMS is a function of the MS loop area AMS, the loop inductance LMS
and the yoke-to-loop coupling βMS, which is the field measured by the
GMR yokes for a unit current in the constriction: GMS= βMSALMS
MS (1)
In our case, due to the constraints imposed by our experimental set-up, it is not convenient to use the MS to directly sense the NMR signal. Indeed, the main magnetic field is parallel to the axis of the dewar tail, and the associated spins will precess in the plane orthogonal to it. To be sensitive to in-plane variations of the NMR field, a planar gradiometric configuration should be adopted (see the next subsection for pick-up loop parameters). Thus, we coupled a pick-up loop to the MS through an input coil. The flux gain of the flux transformer is a function of LMS, IMS and the flux applied through the pick-up coil
Φa [17]:
GΦ=
LMSIMS
Φa (2)
The input coil should be designed so that its inductance Li maximizes
GΦ as a function of the pick-up loop inductance, LP. For this, we
obtain a system including the flux conservation in the MS loop and in the flux transformer:
½
LMSIMS+ M IF T = 0
M IMS+ (Lp+ Li)IF T + Φa= 0 (3) where IF T is the current flowing in the flux transformer and M the mutual inductance between the MS loop and the input coil. Solving for IMS, the gain GΦ becomes
GΦ= LMSΦIMS
a
= LMSM
(Lp+ Li)LMS− M2 (4)
Eventually, differentiating for Li, we get
∂GΦ
∂Li = 0 ⇒ Li=
LP
where k is the coupling constant included in the definition of the mutual inductance M = k√LiLMS. The optimal gain becomes
GoptΦ = M
2Lp (6)
2.2. Pick-up Loop Design
The pick-up coil design was optimized with the aim at maximizing the SNR inside the FOV. For this purpose, NMR signals of voxels with 1 mm side were simulated in a cubic FOV of 125 cm3 located below
the centre of the pick-up coil. The general shape of the pick-up loop was fixed to be a non-planar double-D coil (see Figure 1(a)) with 160-mm diameter matching the internal diameter of the dewar bottom and the two central elements parallel and separated by a fixed gap. The curvature of the parallel wires fitted the internal spherical curvature of the dewar bottom (the curvature is given by a 135 mm sphere) in order to enhance the filling factor. By assuming the gain from the pick-up coil to the MS to be maximized according to Eq. (6), we obtain that it is proportional to pLMS/Lp, for a given k. To find the optimal
(a) (b)
(c) (d)
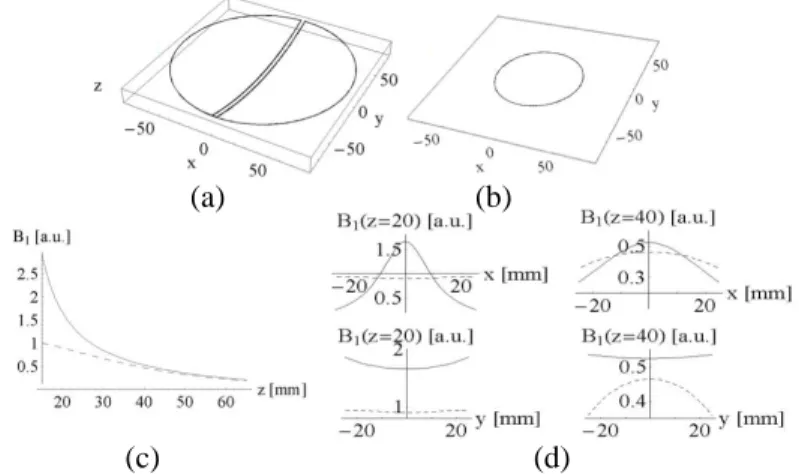
Figure 1. Pick-up coil design and sensitivity profiles. A schematic drawing of (a) the double-D coil and (b) the circular loop used to compare the sensitivity profiles. (c) Sensitivity profiles of the double-D (continuous line) and of the circular loop (dashed line) along the z axis, which is the dewar axis. (d) Sensitivity profile along the x (perpendicular to the parallel double-D wires) and y (along the parallel wires) axes at two different z depths. The double-D outperforms the circular loop down to 4 cm depth.
design we simulated the NMR signal for double-D coils with different distances between their central elements. We also investigated the possibility of having a series of several double-D coils with different gap values to increase the sensitivity in the central region. However, this configuration was discarded since for a series of n double-D coils the signal intensity is almost linear with n but there is a corresponding decrease of the flux transformer gain (Lp∝ n2).
The final optimal configuration we adopted is a single double-D coil with a 4 mm gap between the two parallel wires. We also compared the sensitivity performance of this configuration to that of a more conventional circular pick-up loop that would be the most natural choice if the measurement field were orthogonal to the dewar axis. To compare the two cases we considered a loop with half of the radius of that of the double-D coil, a size adequate for the given FOV centred about 4 cm below the loop plane (see Figure 1(b)). The comparison reported in Figures 1(c) and 1(d) shows that along the dewar axis the double-D sensitivity outperforms that of the circular loop in the near-sensor region (upper part of the FOV) while they become comparable at larger depths.
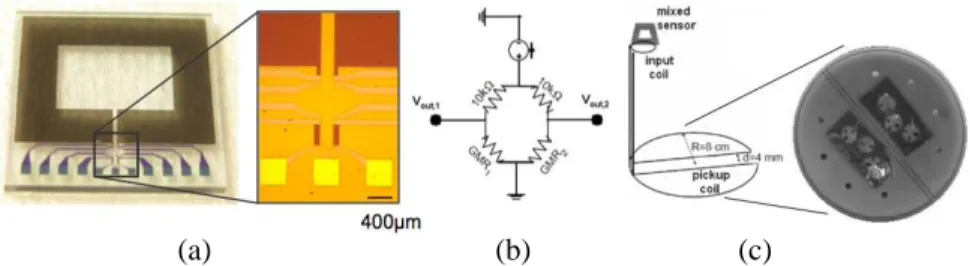
2.3. Description of the Superconducting NMR Detector The MS used in this work is composed of a flux-to-field transformer and two micrometer-size GMR yokes connected in a half-bridge configuration. The flux-to-field transformer consists of an YBCO superconducting loop with a rectangular shape of ≈ 10 × 8 mm2,
(a) (b) (c)
Figure 2. The superconducting NMR detector. (a) A photograph of the MS chip including the YBCO loop with the constriction above which the GMR yokes are placed (inset). (b) A schematic drawing of the read-out bridge, including two GMR yokes and two resistors. (c) The wire-wound double-D coil placed on a spherical fiberglass support, connected to an input coil tightly wound on the top of the YBCO loop.
≈ 2 mm width and a ≈ 2 µm wide constriction (Figure 2(a)). The effective area of the MS loop was estimated to be AMS ≈ 56 mm2 [16, 17] and the inductance of the loop was estimated through
the measurement of the channel gain GΦ (see Results section). The two GMR yokes (≈ 4.74 kΩ each) are connected to a pair of ≈ 10 kΩ resistors in a full-bridge configuration (see the scheme in Figure 2(b)) and allow the detection of a differential voltage when a static bias current is applied to the bridge and an external field is applied through the YBCO loop [15]. The MS benefits of the 4.2 K operating temperature, since the bias reading current of the full-bridge and hence the field sensitivity of the MS [15] can be increased with respect to operation in liquid nitrogen without increasing the noise of the device and without overcoming the critical temperature of the YBCO loop.
The double-D pick-up coil is wound around a fiberglass frame with ≈ 80 mm radius using insulated 80-µm diameter Nb wire (see Figure 2(c)). The room-temperature inductance of the double-D pick-up coil is Lp ≈ 2.85 µH and the pick-up area of one of the two Ds is AD ≈ 96 cm2. The input coil, based on a multi-turn washer geometry,
is fixed on a flexible Teflon tape and coupled to the MS in a flip-chip configuration. The Teflon tape allows us to maximize the coupling between the input coil and the MS loop. If we assume a reasonable value of k = 0.7 for this configuration (see Results for experimental estimates) the optimal Li, according to Eq. (5), results to be 5.6 µH.
Thus, the multi-turn input coil was manufactured with 18 turns of the 80-µm Nb wire in approximately 8 × 10 mm2 area. A value of
Li ≈ 5.75 µH was measured at room temperature. The input and the
pick-up coils are connected in series through superconducting Nb pads and screws. The MS with the flexible input coil tightly tied over the YBCO loop are enclosed in a superconducting lead shielding.
The MS is fed by a current of ≈ 5 mA. The bridge configuration is connected through a high pass filter to the readout electronics. This is composed of an INA103 differential amplifier connected to a SSM2142 line driver necessary to avoid ground loops when the electronics is interfaced to the MSR filters. Shielded cables are used in the MSR, inside and outside the dewar, from read-out electronics down to the sensor’s pads to avoid radio-frequency (RF) induction.
2.4. Calibration Set-up and Measurements
Field and spatial sensitivity of the double-D coil coupled to the MS were investigated and compared to those of a stand-alone MS sited at the bottom of the dewar tail. For both experiments the same calibration procedure was adopted, that is the magnetic field generated
(a)
(b)
(c) (d)
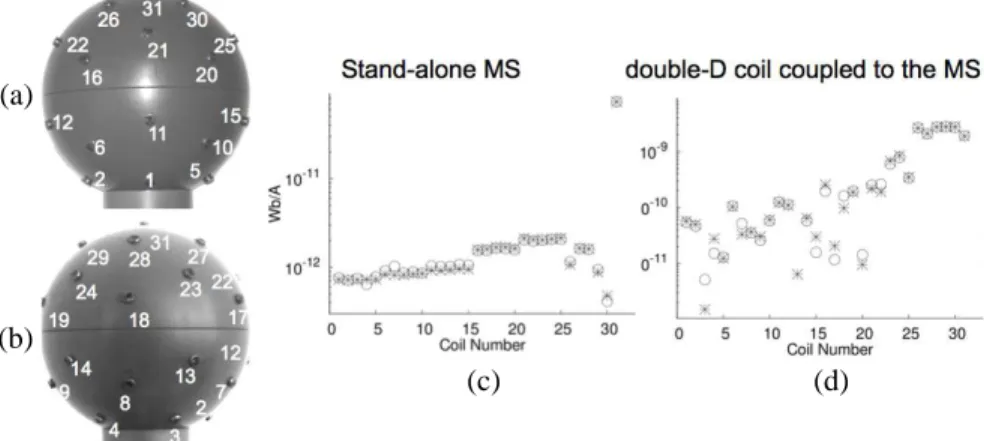
Figure 3. Calibration of the supeconducting channel. (a), (b) The calibration sphere including coils at known relative positions. The coils are arranged on 6 rings placed at different depths (spaced by ≈ 13 mm along the vertical axis) and orientation (angular distance between the coils in a ring ≈ 72◦) from the detection coil; (a) front view, (b) rear
view. (c), (d) Experimental (stars) and theoretical (circles) flux values normalized to the current flowing in the coils for (c) the stand-alone MS and (d) the double-D coupled to the MS.
by a spherical calibrator with 31 equal coils distributed on its surface (diameter ≈ 12.2 cm, see Figures 3(a) and (b)) and placed below the dewar tail was recorded separately for each coil. Each coil has 11 turns made of 0.1 mm copper wire, the coil diameter being 5 mm (theoretical dipole moment for unit current m ≈ 2.16 × 10⁻⁴m2A, oriented as the
sphere radius at the coil position). The coils were fed by a current between 3 and 40 mA depending on the coil position at a frequency of ≈ 8009 Hz. Before selecting this frequency, the channel response as a function of frequency was investigated, together with tests performed by changing the current flowing in the calibrator coils. These tests were performed to guarantee that the output signal of the detection channel was independent of frequency (no inductive coupling) and linear with respect to the magnetic field intensity. Indeed, the behaviour of the MS is linear only in a limited range of the applied field strength, according to its hysteresis cycle [15] and it is essential to have the sensor in this working condition for optimal performance.
Sensor data together with the current flowing into the calibration coils were recorded using an acquisition unit (PowerLab 16/30, ADInstruments), with 100 kHz sampling frequency and 20 kHz low pass filtering. For each calibration coil, the amplitude of the measured signal
was estimated by a digital lock-in. The same analysis was applied to the feeding current. To obtain a calibration factor α in units of Wb/V we fitted the position and orientation of the calibrator sphere with respect to the sensor pick-up loop by maximizing the function M · s/(|M||s|), where s is a vector containing the measured signal amplitudes divided by the used current and M is a vector containing the mutual inductances between the calibration coils and the pick-up loop. M was calculated by modelling the coils and the pick-up loop as polygons comprising short straight filaments and by summing up the partial mutual inductances of the straight filaments [18]. After the fitting, the calibration factor was calculated as α = Mopt·s/s·s, where
Mopt is the mutual-inductance vector for the optimized parameters. Finally, an estimate of the flux gain GΦwas obtained as αMS/αDD
where αMSand αDD are the calibration factors of the stand-alone MS
and the complete NMR channel, respectively. This ratio is a measure of the percentage of the magnetic flux transferred from the double-D pick-up to the MS loop, which is the definition of GΦstated in Eq. (2).
3. RESULTS
3.1. Superconducting Channel Calibration and Flux Sensitivity
The calibration data are reported in Figures 3(c) and (d). The estimated calibration factors are αMS ≈ 9.58 × 10⁻¹⁴Wb/V and
αDD ≈ 1.79 × 10⁻¹²Wb/V for the stand-alone MS and for the MS
coupled to the double-D, respectively. The fit cost function suggests good agreement between experimental and theoretical data for both set-ups and the obtained accuracy is adequate for the evaluation of the performances of the two configurations.
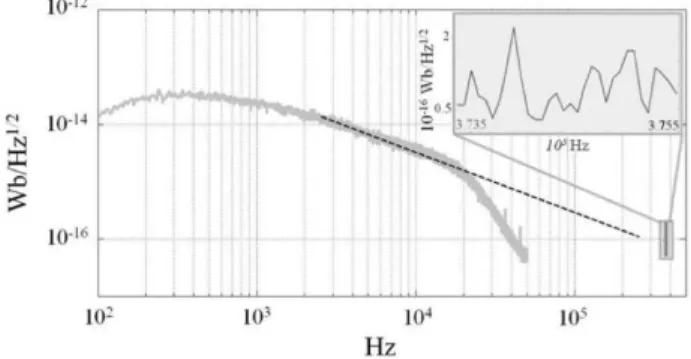
The obtained calibration factor was used to estimate the flux sensitivity of the superconducting channel as a function of frequency. Figure 4 shows the power spectrum density (PSD) of the MS coupled to the double-D from 100 Hz to 50 kHz. The flux noise of the double-D channel ranges from ≈ 5 Φ0/Hz1/2 (at about 4 kHz) to ≈ 0.9 Φ0/Hz1/2
(at 20 kHz), where Φ0 is the flux quantum. The high pass filter
on the read-out electronics smoothes the 1/f trend of the sensor noise in the low frequency range. The 1/f corner of the noise is well above the corner (about 20 kHz) of the anti-aliasing filter of the PowerLab A/D conversion unit. A rough estimate of the 1/f corner was obtained by fitting the power spectrum density in the frequency band [2.5 20] kHz with a straight line and estimating at which frequency this line crosses the high frequency noise level obtained from the NMR
Figure 4. Flux sensitivity of the double-D channel. PSD of the noise measured with PowerLab 16/30 for the double-D coupled to the MS is reported from 100 Hz to 50 kHz. The 1/f trend of the sensor noise is extrapolated to frequencies larger than the A/D low pass filter at 20 kHz. The inset shows the noise level measured by the NMR console in a narrow band across the NMR working frequency, which is above the 1/f corner.
console (Figure 4, inset; see section “NMR experiments” for details). The noise level around the NMR working frequency was estimated to be ≈ 52 mΦ0/Hz1/2 and the 1/f corner was ≈ 280 kHz.
3.2. Coupling between the Double-D and the Mixed Sensor By feeding the washer input coil with a known sinusoidal current Ii of a few µA, we estimated a mutual inductance value between the washer input coil and the MS loop of ≈ 227 nH. Using this estimate of M and the estimate of the flux gain as GΦ = αMS/αDD ≈ 5.35 × 10⁻²,
the MS inductance LMS and the coupling factor k were estimated
using formula (4) and the definition of the mutual inductance M , respectively. We obtained LMS≈ 12 nH and k ≈ 0.87, the latter being
larger than we expected. To understand how far our configuration was from the one maximizing the energy transfer from the double-D to the MS, the optimal input coil inductance Liopt and the optimal gain GoptΦ
were estimated using Eqs. (5) and (6). We obtained Liopt ≈ 11.4 µH
and GoptΦ ≈ 5.65 × 10⁻². Although the optimal inductance of the input
coil is consistently larger than the one we used, our flux gain is only a few percent smaller than the optimal one.
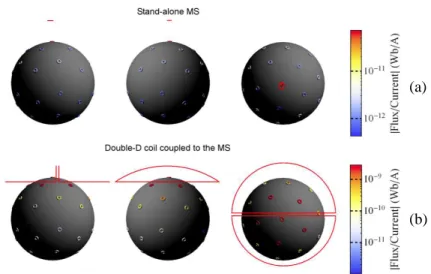
(a)
(b)
Figure 5. Spatial sensitivity of (a) the stand-alone MS and (b) the double-D set-up. The normalized flux generated by each coil through the sensor is coded in colour. Three projections of the calibrator sphere are shown together with the geometry of the stand-alone MS and the double-D coil.
3.3. Spatial Sensitivity of the Double-D Channel vs the Stand-alone MS
To demonstrate the improvement of the sensitivity attained with the double-D channel, the spatial profiles of the signals sensed by both pick-up coils (the double-D and the stand-alone MS) were compared for different positions of the calibration coils. The 3D sensitivity profiles reported in Figure 5 show different projections of the calibrator sphere together with the stand-alone MS (a) and the double-D channel (b) at the position and orientation estimated by the fitting procedure. The signal amplitude per unit current sensed by the two pick-up coils is coded in colour. While the stand-alone MS is sensitive only to the top coil of the calibrator, the spatial sensitivity of the double-D channel considerably changes as a function of the position of the magnetic source. Indeed, the coils in the three upper rings of the calibrator (which are within the NMR FOV) generate a flux in the double-D channel which is still within one order of magnitude from the largest one. Thus in the whole FOV under investigation the signal detected by the double-D channel is about 100 times larger than the one of the stand-alone MS (see Figure 3 and Figure 5). However, because of the symmetry, the coils below the parallel wires of the double-D produced
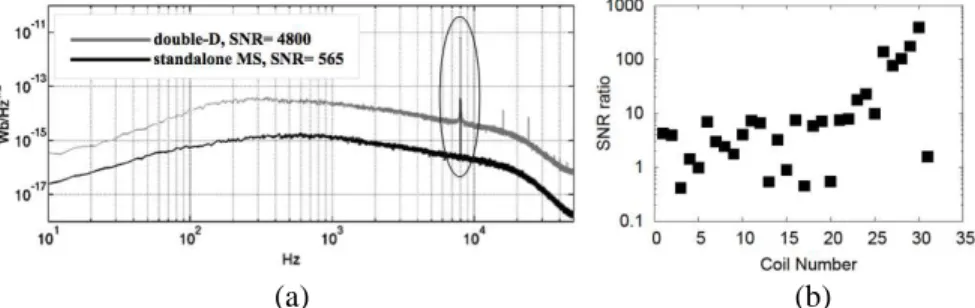
(a) (b)
Figure 6. Comparison between the SNR of the stand-alone MS and the double-D set-up. (a) PSD of the magnetic flux through the stand-alone MS (black) and the double-D coil (grey) for equatorial coil number 25. (b) Ratio of the double-D and the stand-alone MS SNR as a function of the calibrator coil position.
weaker signals.
The double-D spatial sensitivity was quantitatively inspected by comparing the SNR for each calibrator coil with the same quantity for the stand-alone MS. As an example, the rms PSDs in Figure 6(a) show a direct comparison between the signal recorded by the stand-alone MS and the MS coupled to the flux transformer. The reported rms spectra are obtained from a coil with a magnetic dipole moment forming an angle of 60◦ with respect to the dewar vertical axis. This
equatorial coil is located at a distance of ≈ 6.0 cm from the centre of the room temperature side of the dewar tail. The coil is fed with ≈ 30 mA generating a magnetic dipole moment of ≈ 6.5 × 10⁻⁶Am2. The SNR
is computed as the ratio between the signal amplitude obtained by the digital lock-in and the mean rms noise value obtained from the rms PSD in a 3 Hz band (corresponding to 1 frequency bin) centred at 8009 Hz. For this calibrator coil the SNR obtained with the double-D is a factor 10 larger than the stand-alone MS. In Figure 6(b), we report the ratio of the two SNRs as a function of the coil position. The SNR of the double-D is about ten times larger than the stand-alone MS for the coils in the upper half of the calibrator, increasing up to 100 times for the coils in the top ring, while it is even smaller for the coils below the parallel wires of the double-D. Also for coils in the lower half, the double-D shows a larger SNR for most of the coils. As a summary, the double-D calibration confirms the simulation pattern of Figure 1 and shows a considerable enhancement of sensitivity for the coils in the upper part of the calibrator, including the equatorial coils which have a direction of the magnetic moment similar to the magnetic dipoles generated in a NMR experiment using the proposed set-up.
3.4. NMR Experiments
The NMR signal of a phantom filled with doped water consisting of a 77% solution of copper sulfate (1000 ml H20, 770 mg CuSO4,
1 ml arquad, 0.15 ml H2SO4) was acquired using a spin-echo sequence
with RF pulses 200 µs long. The static field value was ≈ 8.9 mT and the RF power used to excite the sample was of the order of 1 W. The volume of solution excited by the RF coil was approximately 42 cm3. The upper surface of the phantom, which is flat, was positioned at a distance of ≈ 5 mm from the centre of the dewar tail. Echoes were acquired by using both the double-D surface coil and the room temperature volume coil in order to compare their performances in terms of SNR. The echo time was TE = 19 ms. Each NMR echo was sampled with 32 points in an acquisition window of 2.5 kHz width centred at the resonance frequency of 374.66 kHz. Successive pulse sequences were applied n = 400 times in a row in order to reduce noise and to enhance SNR (which scales as√n). We used a repetition time (TR) of 500 ms, a value which is about 1.5 times the longitudinal relaxation time of the phantom solution, as estimated from separate measurements. The measured signals were averaged in time domain and subsequently Fourier transformed in order to analyse the echo in the frequency domain. Figure 7 shows the module of the Fourier transformed measured echoes for the reference room temperature coil and the superconducting double-D channel. For both echoes, SNR was evaluated in the frequency domain as the ratio between the peak intensity and the standard deviation of the noise. The frequency band used to compute the noise level was chosen in a region far from the peak of the echo itself (the first 10 and the last 10 points).
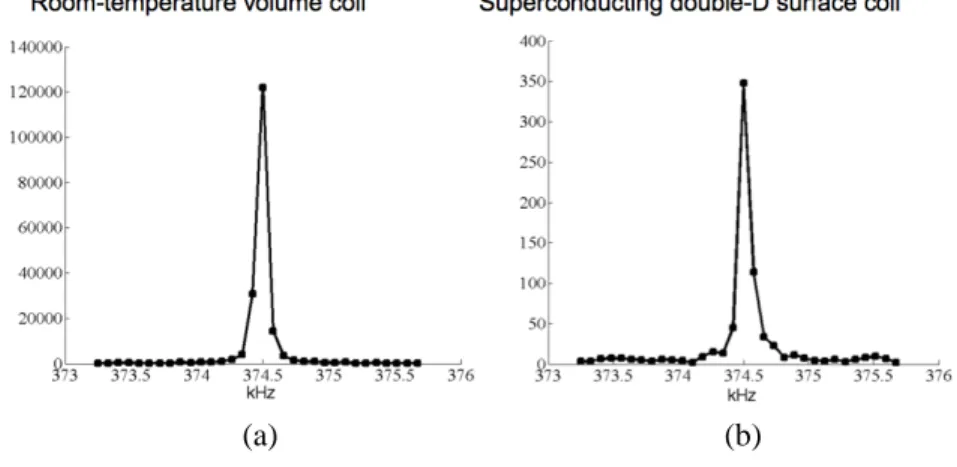
The SNR is ≈ 182 for the double-D set-up and ≈ 776 for the volume coil set-up; the full-width-at-half-maximum values are 103 Hz and 96 Hz, respectively. As expected the SNR is lower for the double-D channel with respect to the volume coil, since the latter provides a filling ratio much larger than the surface coil. This results in a larger signal, thus increasing the SNR. However, when comparing the noise levels at the pre-amplifier input, we obtain that the ratio between the noise levels of the volume coil and the superconducting channel is ≈ 2.8. 4. DISCUSSION
Our results demonstrate that low-field NMR signal detection using a superconducting surface coil coupled to a MS is possible. The geometry of the pick-up coil was optimized to be sensitive to signals in a cubic FOV of 125 cm3 below the pick-up coil. The sensitivity profile of the detection channel was verified with a calibration set-up.
(a) (b)
Figure 7. NMR spectra. NMR signal of the doped water phantom measured using (a) the volume room-temperature coil and (b) the double-D coil. The SNR with the double-D surface coil is ≈ 182, with the volume resonant coil SNR ≈ 776.
Although a compact room temperature volume coil outperforms the superconducting detector in terms of SNR, the overall noise level of the superconducting channel is about three times smaller than the volume coil.
4.1. Comparison between the Sensitivity of the Super-conducting Double-D Channel and the Stand-alone MS Since both the signal and the flux noise of the two configurations depend on the overall geometry of the detection channel, we compared the performances of the double-D receiver and the stand-alone MS in terms of the SNR obtained at specific frequencies, instead of simply comparing the magnetic flux detected by them [1, 19]. Indeed, both the signal and the magnetic noise sensed by the double-D channel are larger (but with a different ratio) than those of the stand-alone MS, as shown in Figure 6(a). For our estimates, we used the SNR obtained with the calibrator sources at a working frequency of 8009 Hz. Theoretically, for simple geometries of the detection channel, it would be possible to calculate the minimum detectable magnetic dipole as a function of the distance and orientation between the pick-up coil and the magnetic source, once the intrinsic noise of the channel is known [20]. As an example, for a magnetometer, the magnetic flux scales as a function of the pick-up area, the flux gain GΦ decreases when increasing the
factor GΦ. As a consequence, if D is the diameter of a pick-up coil, the noise referred to the pick-up loop scales approximately as D1/2
for the optimal matching condition. Therefore, we assume that for the stand-alone MS both the measured signal, proportional to the flux ΦMS = GΦΦa through the MS, and the SNR are proportional to
D3/2 [19]. Analytical calculations are not possible in our context due
to the atypical geometry of the double-D coil employed, so we do not expect the same trend for our configuration. However, experimentally we obtained an SNR increase for most of the calibration coils in the FOV when comparing the double-D channel to the stand-alone MS. The data reported in Figure 6(b) show that the SNR flux gain of the double-D ranges between a factor of ten up to a thousand depending on the orientation and position of the magnetic dipole in the FOV. 4.2. Noise Performance at the NMR Resonance Frequency The noise performances of the sensors at the NMR resonance frequency of 375 kHz were analysed using the NMR set-up to record the time signal in the absence of RF pulses. This noise signal includes the environmental noise detected by the double-D channel, the MS noise and the read-out electronics noise. The rms noise of the signal at the console input was estimated to be ≈ 60 µV/Hz1/2, which corresponds to a flux noise density of ≈ 52 mΦ0/Hz1/2 (see Results
section). This noise value is considerably larger than the theoretical noise of the stand-alone MS, since the equivalent resistance of the two parallel bridge branches containing the GMRs is approximately 7 kΩ and generates a thermal Nyquist noise of ≈ 1.3 nV/Hz1/2 at
the liquid helium temperature. This suggests that the measured noise is not driven by the stand-alone MS. Additionally, the overall voltage noise measured with the MS is not considerably different from the one obtained by simulating the MS with a resistance bridge connected to read-out electronics, suggesting that the environmental noise contribution in the MSR is negligible. Thus, the noise we measure is mainly generated by the read-out electronics. The current noise of the INA103 preamplifier employed in our set-up is ≈ 2 pA/Hz1/2 at 1 kHz which multiplied by the equivalent MS resistance and by the read-out electronics gain (2500) generates a voltage noise of ≈ 35 µV/Hz1/2. The larger measured value may be due to an incorrect
matching between the MS and the INA103, suggesting further efforts to improve the read-out electronics. Finally, superconducting and room temperature coils have been compared also previously [21], using experimental and theoretical data. In that paper, the theoretical plots of the magnetic noise for the superconducting untuned detection and
the conventional Faraday detection suggest that at the field we are operating, Faraday detection should be noisier. The above calculations do not hold for our set-up (Figure 7 shows a larger SNR for the room temperature coil) since we compare experimental data obtained with different geometries for the superconducting and room temperature coils. Indeed, the signal of the room temperature receiver, which is a volume coil, is larger than that of the double-D channel due to its larger filling factor. However, the noise figure of the superconducting double-D channel is better than that of the room temperature coil. Moreover, the noise level of the double-D sensor could be further reduced. Thus, our results are in line with the theoretical estimates [21]. As a summary, in the perspective of adopting a dewar geometry suitable to improve the filling factor of the superconducting pick-up loop, this could outperform room temperature detection.
4.3. Pros and Cons of the NMR Set-up at 10 mT
Our set-up using a MS and a static magnetic field of 8.9 mT is based on a larger applied field and a simpler design than existing ultra-low-field systems [3, 9, 22–24]. In our set-up, the main field value is limited by the cryostat superinsulation that acts as a low pass filter and prevents signals above the cut-off frequency (520 kHz) from penetrating inside the dewar, where the detection coil is located. The main difference with existing ULF systems, other than the field amplitude, is that no pre-polarizing field and Q-spoilers or superconducting switches are adopted. Pulsed NMR with a pre-polarizing field has been used to increase the SNR in ULF systems [3, 9, 23]. However, there are three main drawbacks to be faced. First, it is not straightforward to rapidly pulse the field, thus tailored driving electronics must be adopted. Second, when the instrument is located inside a MSR (as required for MEG), pulsing of the prepolarizing field induces eddy currents on the MSR walls. The magnetic field due to these eddy currents may disturb the NMR signal. This problem can be solved by a self-shielded prepolarizing coil, as has been experimentally demonstrated [25]. Third, during prepolarization no signal acquisition is possible. Thus, a significant amount of the total measurement time is spent without collecting data. A unique example of SQUID detected MRI without a prepolarizing field was obtained using a 10 mT set-up with a resonant coil coupled to a low Tc SQUID protected by a
Q-spoiler [22]. Q-Q-spoilers are used to make the flux transformer resistive above their critical current, thus avoiding damage of the SQUID during pre-polarizing pulses [26]. Alternatively, superconducting switches that heat up the superconducting pick-up coil during the switching of the pre-polarizing field can be used [23]. Compared to both technical
solutions, the design of our NMR channel based on a mixed sensor is less complicated and potentially could be integrated in a whole head system for parallel NMR and simultaneous MEG acquisition. Finally, an important advantage of low-field NMR is the possibility of studying T1 relaxation in normal and pathological tissues [6]. T1 contrast enhancement has been demonstrated for different percentage of agarose gel concentrations below 10 mT. Even if we cannot expect the same behaviour for all the human body tissues, we can suppose an increase of T1 contrast when lowering the measurement field. Whether 10 mT are low enough to have significant contrast enhancement is an open issue and will be a topic of future studies.
ACKNOWLEDGMENT
The research leading to these results has been supported by the European Commission’s Seventh Framework Programme (FP7/2007– 2013) under grant agreement MEGMRI No. 200859.
REFERENCES
1. Clarke, J., M. Hatridge, and M. M¨oßle, “SQUID-detected magnetic resonance imaging in microtesla fields,” Annual Review of Biomedical Engineering, Vol. 9, 389–413, 2007.
2. Trahms, L. and M. Burghoff, “NMR at very low fields,” Magnetic Resonance Imaging, Vol. 28, 1244–1250, 2010.
3. McDermott, R., S. Lee, B. T. Haken, A. H. Trabesinger, A. Pines, and J. Clarke, “Microtesla MRI with a superconducting quantum interference device,” Proceeding of the National Academy of Sciences of the United States of America, Vol. 101, 7857–7861, 2004.
4. Trabesinger, A. H., R. McDermott, S. Lee, M. M¨uck, J. Clarke, and A. Pines, “SQUID-detected liquid state NMR in microtesla fields,” The Journal of Physical Chemistry A, Vol. 108, 957–963, 2004.
5. M¨oßle, M., S. I. Han, W. R. Myers, S. K. Lee, N. Kelso, M. Hatridge, A. Pines, and J. Clarke, “SQUID-detected microtesla MRI in the presence of metal,” Journal of Magnetic Resonance, Vol. 179, 146–151, 2006.
6. Busch, H., M. Hatridge, M. M¨oßle, W. Myers, T. Wong, M. Muck, K. Chew, K. Kuchinsky, J. Simko, and J. Clarke, “Measurements of T1-relaxation in ex vivo prostate tissue at 132 µT,” Magnetic
7. Zotev, V. S., A. N. Matlashov, P. L. Volegov, I. M. Savukov, M. A. Espy, J. C. Mosher, J. J. Gomez, and R. H. Kraus, Jr., “Microtesla MRI of the human brain combined with MEG,” Journal of Magnetic Resonance, Vol. 194, 115–120, 2008.
8. Magnelind, P. E., J. J. Gomez, A. N. Matlashov, T. Owens, J. H. Sandin, P. L. Volegov, and M. A. Espy, “Co-registration of interleaved MEG and ULF-MRI using a 7 channel low-Tcsystem,”
IEEE Transactions on Applied Superconductivity, Vol. 21, No. 3, 456–460, 2011.
9. Vesanen, P. T., J. O. Nieminen, K. C. J. Zevenhoven, J. Dabek, L. T. Parkkonen, A. V. Zhdanov, J. Luomahaara, J. Hassel, J. Penttil¨a, J. Simola, A. I. Ahonen, J. P. M¨akel¨a, and R. J. Il-moniemi, “Hybrid ultra-low-field-MRI and magnetoencephalogra-phy system bassed on a commercial whole-head neuromagnetome-ter,” Magnetic Resonance in Medicine, Vol. 69, 1795–1804, 2013 10. Zotev, V. S., A. N. Matlashov, P. L. Volegov, A. V. Urbaitis,
M. A. Espy, and R. H. Kraus, Jr., “SQUID-based instrumentation for ultralow-field MRI,” Superconductor Science and Technology, Vol. 20, S367–S371, 2007.
11. Bernarding, J., G. Buntkowsky, S. Macholl, S. Hartwig, M. Burghoff, and L. Trahms, “J-coupling nuclear magnetic resonance spectroscopy of liquids in nT fields,” Journal of the American Chemical Society, Vol. 128, 714–715, 2006.
12. Hartwig, S., M. Voigt, H. J. Scheer, H. H. Albrecht, M. Burghoff, and L. Trahms, “Nuclear magnetic relaxation in water revisited,” The Journal of Chemical Physics, Vol. 135, 054201, 2011.
13. Pannetier-Lecoeur, M., C. Fermon, N. Bizierre, J. Scola, and A. L. Walliang, “RF response of superconducting-GMR mixed sensors, application to NQR,” IEEE Transactions on Applied Superconductivity, Vol. 17, No. 2, 598–601, 2007.
14. Sergeeva-Chollet, N., H. Dyvorne, J. Dabek, Q. Herreros, H. Polovy, G. Le Goff, G. Cannies, M. Pannetier-Lecour, and C. Fermon, “Low field MRI with magnetoresistive mixed sensor,” Journal of Physics Conference Series, Vol. 303, 012055, 2011. 15. Pannetier, M., C. Fermon, G. Le Goff, J. Simola, and E. Kerr,
“Femtotesla magnetic field measurements with magnetoresistive sensors,” Science, Vol. 304, 1648–1650, 2004.
16. Pannetier, M., C. Fermon, G. Legoff, J. Simola, E. Kerr, M. Welling, R. J. Wijngaarden, and J. Rinke, “Ultra-sensitive field sensors — An alternative to SQUIDs,” IEEE Transactions on Applied Superconductivity, Vol. 15, No. 2, 892–895, 2005.
17. Dyvorne, H., J. Scola, C. Fermon, J. F. Jacquinot, and M. Pannetier-Lecoeur, “Flux transformers made of commercial high critical temperature superconducting wires,” Review of Scientific Instruments, Vol. 79, 025107, 2008.
18. Grover, F. W., Inductance Calculations, Working Formulas and Tables, Dover, New York, 1973.
19. Granata, C., A. Vettoliere, S. Rombetto, C. Nappi, and M. Russo, “Performances of compact integrated superconducting magnetometers for biomagnetic imaging,” Journal of Applied Physics, Vol. 104, 073905, 2008.
20. Rombetto, S., A. Vettoliere, C. Granata, M. Russo, and C. Nappi, “Sensitivity and spatial resolution of square loop SQUID magnetometers,” Physica C: Superconductivity, Vol. 468, 2328– 2331, 2008.
21. Myers, W., D. Slichter, M. Hatridge, S. Busch, M. M¨oßle, R. McDermott, A. Trabesinger, and J. Clarke, “Calculated signal to noise ratio of MRI detected with SQUIDs and Faraday detectors in fields from 10 µT to 1.5 T,” Journal of Magnetic Resonance, Vol. 186, 182–192, 2007.
22. Seton, H. C., J. M. S. Hutchison, and D. M. Bussel, “Gradiometer pick-up coil design for a low field SQUID-MRI system,” Magnetic Resonance Materials in Physics, Biology and Medicine, Vol. 8, 116–120, 1999.
23. Matlashov, A. N., V. S. Zotev, R. H. Kraus, Jr., H. Sandin, A. V. Urbaitis, P. L. Volegov, and M. A. Espy, “SQUIDs for magnetic resonance imaging at ultra-low magnetic field,” PIERS Online, Vol. 5, No. 5, 466–470, 2009.
24. Burghoff, M., H. H. Albrecht, S. Hartwig, I. Hilschenz, R. K¨orber, T. Sander Th¨ommes, H. J. Scheer, J. Voigt, and L. Trahms, “SQUID system for MEG and low field magnetic resonance,” Metrology and Measurements Systems, Vol. 16, 371–375, 2009. 25. Nieminen, J. O., P. T. Vesanen, K. C. J. Zevenhoven, J. Dabek,
J. Hassel, J. Luomahaara, J. S. Penttil¨a, and R. J. Ilmoniemi, “Avoiding eddy-current problems in ultra-low-field MRI with self-shielded polarizing coils,” Journal of Magnetic Resonance, Vol. 212, 154–160, 2011.
26. Hilbert, C., J. Clarke, T. Sleator, and E. L. Hahn, “Nuclear quadrupole resonance detected at 30 MHz with a dc supercon-ducting quantum interference device,” Applied Physics Letters, Vol. 47, 637–639, 1985.