HAL Id: halshs-03095693
https://halshs.archives-ouvertes.fr/halshs-03095693
Submitted on 4 Jan 2021
HAL is a multi-disciplinary open access
archive for the deposit and dissemination of sci-entific research documents, whether they are pub-lished or not. The documents may come from teaching and research institutions in France or abroad, or from public or private research centers.
L’archive ouverte pluridisciplinaire HAL, est destinée au dépôt et à la diffusion de documents scientifiques de niveau recherche, publiés ou non, émanant des établissements d’enseignement et de recherche français ou étrangers, des laboratoires publics ou privés.
Market
Luc Arrondel
To cite this version:
Luc Arrondel. Financial Literacy and French Behaviour on the Stock Market. Numeracy, 2021, 14, �10.5038/1936-4660.14.1.1356�. �halshs-03095693�
September 2021
Financial Literacy and French Behaviour on the Stock Market
Financial Literacy and French Behaviour on the Stock Market
Luc ArrondelPSE, arrondel@pse.ens.fr
Follow this and additional works at: https://scholarcommons.usf.edu/numeracy Part of the Behavioral Economics Commons, and the Finance Commons Recommended Citation
Recommended Citation
Arrondel, Luc. "Financial Literacy and French Behaviour on the Stock Market." Numeracy 14, Iss. 1 (2021): Article 1. DOI: https://doi.org/10.5038/1936-4660.14.1.1356
Abstract Abstract
This article looks back over the different dimensions of financial literacy: theoretical, methodological, empirical and political. The theoretical foundations of the notion of financial literacy are presented with reference to recent contributions by psychological or behavioural economics: “household finance” refers to the concept of financial literacy based on the empirical dead-ends of standard saver theory. This raises the fundamental question as to how to measure and evaluate financial literacy. Here, we are especially interested in the empirical robustness of a standard measure of financial literacy based on three straightforward questions (interest calculations, notion of inflation and risk diversification). Is this measure adequate or do other definitions need to be developed? We use original data from a survey conducted in 2017 that proposes alternative measures. Our results show that the measure in most studies seems a good proxy for a more global measure based on a larger battery of similar questions. Nevertheless, the global measure improves the statistical quality of the measure even though this more sophisticated measure does not statistically significantly improve behavioural regressions.
Keywords Keywords
Financial literacy, Stock ownership, Household finance Creative Commons License
Creative Commons License
This work is licensed under a Creative Commons Attribution-Noncommercial 4.0 License Cover Page Footnote
Cover Page Footnote
Luc Arrondel is Director of Research at the Centre National de Recherche Scientifique (CNRS) and a researcher at the Paris School of Economics (PSE). He is also associate professor at the Paris School of Economics. As an economist, his research areas concern range from household finance to football economics. Concerning the former, his work focuses on savings behaviour and the accumulation, composition, and transmission of wealth.
Introduction
“You don’t need to know your times tables to be a great mathematician.”—Cédric Villani, Les Matins de France Culture, 15 November 2017
Although the economist’s modern concept of financial literacy seems to be relatively recent, the idea of familiarising individuals with savings, especially at a young age, is old (Garon 2011). But it was probably not until the early 2000s, in an “individual promotion” policy-friendly climate, that what we mean by “financial literacy” today really emerged, namely with the launch of the OECD Financial Literacy programme. The OECD Council (OCDE 2005, 14) defines financial education as “the process by which financial consumers/investors improve their understanding of financial products, concepts and risks and, through information, instruction and/or objective advice, develop the skills and confidence to become more aware of financial risks and opportunities, to make informed choices, to know where to go for help, and to take other effective actions to improve their financial well-being.”
France has not deviated from this movement: the public’s economic knowledge has been the focus of particular attention and regular polls for some twenty years (e.g., Banque de France 2018). The recurrent observation made by these studies is that, although a small majority (50–60%) of French people say they are “interested” in the economy, their economic knowledge is generally regarded as highly inadequate. This state of affairs was summed up by a headline in Le Figaro (15 May 2018): “The French people are interested in the economy . . . but don’t know much about it.” They have a very rough idea of GDP and public debt, a poor approximation of the national minimum wage, a false impression of inequalities, and so on. Many experts argue that these gaps in French knowledge are one of the reasons why they are reluctant to consider what are seen as necessary reforms for the country: “How can the French support reforms they do not understand?” (F. de Saint-Pierre of the Cercle J.B. Say, Les Echos, 20 June 2018). In terms of public policy, therefore, it is regarded as urgent and vital to improve their economic and financial knowledge.
This observation of financial “illiteracy” extends beyond the economic press, however, as it is also the subject of a vast body of academic literature (Lusardi and Mitchell 2014). Fornero (2015), professor at the University of Turin and also Monti government Minister for Labour and Social Policies behind the pensions reform in Italy, shows that financial literacy improves the understanding (and hence acceptance) of public policies, and helps counter a certain “populism.” Economic knowledge was also raised recently as a possible remedy for financial crises. In his reading of the “Great Recession” of 2008, Robert Shiller explains certain savers’ economic incompetence, especially the “poor,” as being due to their lack of
economic knowledge (2008, 95): “Low-income individuals who took out risky subprime mortgages, with interest rates that would soon be adjusted upward, were often unaware of the known risks inherent in such mortgages,” (author’s emphasis). Savers, then, are seen as having “behaved badly” during the crisis, whether out of irrationality or incompetence, and here too a solution to prevent future crises would be to improve their economic and financial literacy so that they do not make the same mistakes again. The message put across by Annamaria Lusardi, the great academic “ambassador” for financial literacy, is particularly explicit on this point: “Financial literacy is an essential piece of knowledge that every student should have . . . Just as reading and writing became skills that enabled people to succeed in modern economies, today it is impossible to succeed without being able to ‘read
and write’ financially.” (NY Times, April 2010, author’s emphasis).
Some even take the observation further considering that, structurally, economies have everything to gain from investing in economic knowledge. Lusardi et al. (2017) puts it that financial literacy explains 30% to 40% of wealth inequality. In an inverse line of reasoning, Phelps (2017) calculates that the French people’s financial illiteracy costs the country one point of GDP growth per year (around 24 billion euros). These economists hence see economic and financial knowledge as eminently virtuous: the construction of a “financial democracy” will prevent a new crisis (Shiller 2008), reduce inequality and increase well-being (Lusardi 2009), and generate growth (Phelps 2017).
This article looks back over the different dimensions of financial literacy: theoretical, methodological, empirical, and political. First, the theoretical foundations of the notion of financial literacy are presented with reference to recent contributions by psychological or behavioural economics: “household finance” refers to the concept of financial literacy based on the empirical dead-ends of standard saver theory (§ 1). This point raises the fundamental question as to how to measure and evaluate financial literacy (§ 2). Here, we were especially interested in the empirical robustness of the standard measure of financial literacy, the “big-three”: is this “standard” methodology, based on three straightforward questions (interest calculations, notion of inflation, and risk diversification), adequate or do other definitions need to be developed? Throughout this article, we will use original data from a survey conducted in 2017 that proposes alternative measures to the standard “Big Three.” The following section concerns financial literacy measurement in France: as is often said, are the French really “useless at finance” (Le Parisien, 9 November 2011) or at least more “useless” than the others (§ 3)? Is their financial behaviour, in terms of their portfolio choices, affected by it (§ 4)? These two statistical parts (on the measurement of financial education and its role on financial behaviour) will lead us to question the relevance of the measures chosen and in particular the statistical validity of the “Big Three” (§ 5). Having a good measure of individuals’ financial literacy is not only useful for testing
household savings behaviour, but also for justifying and evaluating public policies: we conclude on the effectiveness of economic education programs and their usefulness for public policy (§ 6).
Financial Literacy: Theoretical Foundations
In the academic literature, a lack of financial literacy is put forward to explain certain biases or irrationality in the saver’s behaviour predicted by the “standard” model (life-cycle hypothesis and portfolio choice theory): a good education produces good conduct. This “standard” framework is based on dual rationality: rational decision-making based on the maximisation of a utility function and rational expectations where economic agents’ beliefs, based on all the available information, are supposed to correctly represent future uncertainties. Hence the most widely accepted model in the profession, the life-cycle hypothesis, postulates that individuals adopt forward-looking, time-consistent (not contradictory over time) behaviour and consume in accordance with their preferences, albeit constrained by their total resources over their entire lifetimes (Modigliani and Brumberg 1954). Individuals use assets, as a reserve of deferred consumption, to smooth their consumption over their life cycle in keeping with their income profile (permanent income). It is also possible to study the optimal composition of these assets over time (Merton 1969). This basic model’s initial message has moreover been enriched by considering other savings motives: precautionary savings to provide for future contingencies, especially income incidents (Kimball 1993); and a bequest motive in terms of transferring an inheritance to offspring (for example, see Arrondel and Masson 2006). This standard theory posits, at least implicitly, that individuals have knowledge of certain financial principles to be able to make their decisions, in particular to determine their constraints, such as discounting, inflation and calculation of interest, and that they have a certain amount of information on the financial and economic environment. Psychological economics research programmes on information, financial literacy, and cognitive ability tend to show that this is not the case (Lusardi and Mitchell 2014).
Thus, savers would suffer from a lack of financial education (“financial illiteracy”) or limited cognitive abilities (Lusardi 2009; Guiso and Sodini 2013). They do not have a command of the economic principles required (rational formation of expectations, discounting calculation, valuation of assets, etc.) or they suffer from inadequate knowledge of financial products and the economic environment (interest rates, stock markets, pensions system, etc.). They make all kinds of “mistakes” of calculation and strategy, but also of expectations in information collection and processing and the formation of their beliefs: non-Bayesian revisions and overconfidence in their judgements. They fall prey to
“emotions” at odds with their own interests (lack of self-control, impulsiveness, overconfidence, unjustified regret or disappointment, etc.).
These different “biases” put forward by behavioural economics (Thaler 2000) are supposed to explain, at least in part, certain empirical puzzles. With respect to saving (Guiso and Sodini 2013; Jappelli and Padula 2013), standard theory fails to explain why certain households display an inadequacy of savings able to maintain their consumption level in retirement (approximately 20% in France) and little use of annuity. Similarly, in portfolio choice, standard theory finds it hard to justify the low level of asset diversification, especially in risky assets, as much in terms of amount (Mehra and Prescott 1985; Kocherlakota 1996) as participation (Haliassos 2003). Lastly, in addition to saver theory, biases observed in household securities portfolio management also take issue with standard theory: “home” biases in favour of investments in one’s own country, “naïve” diversification whereby savers divide equally their wealth between available assets, the “disposition” effect whereby investors part with winning assets too soon and losing assets too late, the status quo bias and inertia whereby savers keep their initial investments, excessive trading (Vissing-Jorgensen 2004), etc.
Ignorance about assets and all kinds of information costs are evidently behind the observed incompleteness and diversity of portfolios. A large body of recent literature looks into factors related to this information that appear to play an important role in stock market participation: cognitive abilities (Christelis et al. 2010, Grinblatt et al. 2011), trust (Guiso et al. 2008), financial “awareness” (Guiso and Jappelli 2005), time spent obtaining information (Guiso and Jappelli 2007), social interactions (Guiso et al. 2004; Hong et al. 2004; Arrondel et al. 2019), optimism (Jouini et al. 2006) and financial literacy (van Rooij et al. 2011; Lusardi and Mitchell 2014). However, the precise mechanism by which these factors influence households’ financial choices (via the pool of information or expectations, etc.) largely remains to be formalised (Grinblatt et al. 2011).
Behavioural economics criticises savers’ omniscience not only in terms of the rationality of their behaviour, but also in terms of the rationality of their expectations. The hypothesis of rational expectations, especially the homogeneity of beliefs, has been in question for the last thirty years. Behavioural finance cites different cognitive biases in the formation of expectations. Gollier (2013, 3) states, “It allows people to dream of impossible returns, to refuse [relevant] information that they do not like, or agree to disagree among themselves.” These psychological biases could therefore help explain “the bubbles, cycles and crashes,” especially if they are reinforced by media coverage that is itself biased. The field is also concerned about the “extreme pessimism of economic agents during phases of [acute] crisis,” produced by strong aversion to ambiguity combined with increasingly gloomy expectations of stock prices.
How to Assess Financial Literacy?
Financial literacy is generally defined as a specific component of human capital whereby individuals are able to use relatively simple concepts to make suitable financial decisions (savings, investment, and debt). This concept therefore covers various aspects: cognitive abilities, financial culture, and information collection and processing capacities. One problem, then, is how to measure it as a whole.
The Big Three basic questions (see below) introduced by Lusardi and Mitchell (2014) in the 2004 American Health and Retirement Study have rapidly become the standard international format for doing so. They ask respondents to: (1) calculate compound interest, (2) find the gross or real rate of return after inflation, and (3) assess the risky nature of assets. Although this composite measure makes for comparative analyses across countries, it has come under some criticism, especially with regard to its simplicity (Hastings et al. 2013). Yet few studies actually seek to find out whether this simple measurement is the best, or even if it is simply better than others with more questions or covering more varied areas. The relevance of these variables might therefore depend on the socioeconomic environments in which they are measured. Another problem with the measurement of the Big Three was raised by Skagerlund et al. (2018): a driving force behind becoming financially literate resides in the ability to understand numbers and having an emotional attitude toward numbers. Thus, measuring financial education solely or primarily on the basis of numeracy questions could be problematic.
The second, relatively widespread survey measurement is to simply ask individuals to rate themselves on a scale of financial knowledge. The main criticism of this method is that it is allegedly biased upwards, as individuals tend to be “optimistic” about their level (Hastings et al. 2013).
The empirical part of this article draws on an original survey conducted in 2017 by ELIPSS: FLIP (Financial Literacy and Assets). The aim of this questionnaire is to propose other, more sophisticated assessments than the two measurements of financial literacy mentioned above. In addition, given that the purpose of this experiment is to explain saving and asset behaviour, it provides an entire set of information on household assets and their saving preferences (risk aversion and time preference). These data concern France, but the questionnaire developed by Gianni Nicolini (2019) draws largely on information collected in other countries using the same methodology, enabling comparative analyses to be conducted. The sample is the ELIPSS panel set up by the Socio-Political Data Centre (CDSP).
The panel has been built to be representative of the French population (the statistics must however be weighted). It is composed of voluntary households. The survey conducted via the Internet put the FLIP questionnaire to over 2,783 people in 2017 and received 2,300 responses. This response rate of over 80% is the rate usually observed for other panel surveys. In addition, less than 2% of the panel
abandoned the questionnaire mid-survey. Given that the questionnaire is relatively complicated and takes the form of a quiz (with, however, the possibility of not having to systematically answer all the questions), it is interesting to note that very few respondents were discouraged by the survey’s nature. Moreover, 80% of respondents looked up the answers to the quiz once they had filled in the questionnaire, which again shows a certain amount of interest in the survey.
The high number of questions on financial literacy (approximately 50) makes for a larger number of financial literacy measurements. Although the standard measurements (Big Three and self-assessment) are used for reasons of comparison with existing studies, numerous variants can be envisaged. In particular, one of the FLIP survey’s originalities is that it proposes four levels of difficulty for answers to the Big Three basic questions. The wording of the questions put by level is reported in Table 1 (correct answers in bold type).
Table 1
Wording of the Financial Literacy Questions
QB1 – quiz_01
Suppose you had €100 in a savings account and the interest rate was 2% per year. After 5 years, how much do you think you would have in the account if you left the money to grow?
More than €102
Exactly €102 Less than €102 [DK][RF]
QB2 – quiz_02
Imagine that the interest rate on your savings account was 1% per year and inflation was 2% per year. After 1 year, how much would you be able to buy with the money in this account?
More than today Exactly the same as today
Less than today
[DK][RF]
QB4 – quiz_04
Buying a single company’s stock usually provides a safer return than a stock mutual fund. True
False
[DK][RF]
QB6 – quiz_06
Let’s say you borrow €200 over two years from a bank that charges you 2% interest. After two years, how much do you think you will have to pay to reimburse your loan?
More than €204
Exactly €204 Less than €204 [DK][RF]
QB7 – quiz_07
Let’s say that your savings account earns an annual interest rate of 4% and the annual rate of inflation is 4%. After a year, your savings will buy you
More than today
Exactly the same amount as today
Less than today [DK][RF]
QB9 – quiz_09
Compared with an investment in shares, the risk of investing in a mutual fund is . . . Higher
The same
Lower
[DK][RF]
QB16 – quiz_16
Let’s say that you have €100 in a savings account earning an annual interest rate of 10%. After two years, how much do you think you would have if you left this money to grow?
€110 €120
€121
[DK][RF]
QB17 – quiz_17
If your bank pays an interest rate of 4% per year on your savings account in which you have invested €100, what do you think the rate of inflation should be for you to maintain your purchasing power over the next two years?
0% per year
No more than 4% per year
No more than 8% per year [DK][RF]
QB19 – quiz_19
Which of the following investment strategies should you choose as an investor if you want to double your financial assets in a very short space of time?
A money market mutual fund A stock mutual fund
Shares in a single company
[DK][RF]
QB21 – quiz_21
What is the annual rate of interest (annual percentage rate, APR) for a €100 loan on which you have to pay back €110 the following month? 10% Around 120% More than 200% [DK][RF] QB22 – quiz_22
Let’s say the rate of inflation was 20% last year. If an underground train ticket (index-linked to the cost of living) costs €2.40 today, how much did it cost last year?
€1.92
€2.00
€0.48 [DK][RF]
QB24 – quiz_24
Let’s say you invested €1,000 last year in a highly diversified stock mutual fund. If, over the same period, the stock market index (i.e., the index for the market in which this fund is invested) increases 5%, how much should you earn on your investment?
Less than €5 More than €500
Around €50
[DK][RF]
The questions allow for respondents to say that they do not know the answer (“Don’t Know” option) or refuse to answer (“Refuse to answer” option). Answers to the risk diversification questions score correct when “shares” are ranked as the riskiest investment, and incorrect otherwise.
Table 2
Financial Literacy in France: Different Measures
Level 1 Compound interest Inflation Diversification Big Three 1
quiz 01 Frequency quiz 02 Frequency quiz 04 Frequency Frequency More than €102 84,08 More than today 6,72 TRUE 7,84
Exactly €102 5,51 Exactly the same as today 10,73 FALSE 40,66 No correct answer 9,01 Less than €102 3,65 Less than today 63,95 Refuse to answer 1,11 1 correct answer 23,89 Refuse to answer 1,51 Refuse to answer 1,07 Don’t know 48,73 2 correct answers 35,21 Don’t know 5,07 Don’t know 16,10 Did not answer 1,67 All correct 31,89 Did not answer 0,17 Did not answer 1,43
Total 100,00 100,00 100,00 100,00
Level 2 quiz 06 quiz 07 quiz 09 Big Three 2
More than €204 63,62 More than today 6,79 Higher 10,11 Exactly €204 18,12 Exactly the same amount as today 63,12 The same 7,64
Less than €204 5,14 Less than today 6,84 Lower 26,42 No correct answer 14,61 Refuse to answer 0,93 Refuse to answer 1,33 Refuse to answer 1,48 1 correct answer 31,82 Don’t know 9,75 Don’t know 20,54 Don’t know 53,34 2 correct answers 38,37 Did not answer 2,44 Did not answer 1,39 Did not answer 1,01 All correct 15,20
Total 100,00 100,00 100,00 100,00
Level 3 quiz 16 quiz 17 quiz 19 Big Three 3
€110 5,10 0% per year 8,04 A money market mutual fund 8,23 €120 34,23 No more than 4% per year 51,19 A stock mutual fund 16,02
€121 51,26 No more than 8% per year 3,06 Shares in a single company 13,29 No correct answer 30,06 Refuse to answer 0,98 Refuse to answer 1,51 Refuse to answer 1,37 1 correct answer 31,22 Don’t know 7,41 Don’t know 35,35 Don’t know 59,64 2 correct answers 30,97 Did not answer 1,01 Did not answer 0,84 Did not answer 1,45 All correct 7,75
Total 100,00 100,00 100,00 100,00
Level 4 quiz 21 quiz 22 quiz 24 Big Three 4
10% 42,08 €1,92 21,69 Less than €5 2,66 Around 120% 22,65 €2,00 51,28 More than €500 2,94
More than 200% 6,57 €0,48 2,32 Around €50 54,07 No correct answer 27,56 Refuse to answer 1,46 Refuse to answer 1,31 Refuse to answer 2,21 1 correct answer 35,46 Don’t know 25,20 Don’t know 22,60 Don’t know 37,40 2 correct answers 33,57 Did not answer 2,05 Did not answer 0,81 Did not answer 0,72 All correct 3,41
Total 100,00 100,00 100,00 100,00
Source: FLIP Survey 2017
Are the French “Useless at Finance?”
Detailed results of the financial literacy measurements are given in Table 2, differentiating between the four levels (a priori of increasing difficulty) for the Big Three questions: in fact, while Level 2 appears to require more “capacity” than Level 1, the hierarchy is less clear-cut between Level 3 and Level 4.
The Big Three and Financial Literacy
Level 1 corresponds to precisely the measure adopted in the international literature (Lusardi 2019). Approximately 84% of the people interviewed answered the interest rate question correctly and 64% understood the impact of inflation on their purchasing power. A total of 40% of respondents ranked the investments correctly by risk. Overall, less than one-third of the individuals were able to answer all three questions correctly.
These results differ somewhat from a previous French study (Arrondel et al. 2013) that used another survey and somewhat different questioning (cf. Table 3). For the question on compound interest (on different amounts), they obtained a much lower percentage of correct answers (48%). The rate of correct answers (with the same question) on inflation was about the same (61%). On the question on diversification (with a different questioning), French individuals perform better globally: Arrondel et al. (2013) observed nearly 67% correct answers. Nevertheless, in total, only 30% of individuals correctly answered the three questions asked in the two surveys and 10–15% did not answer any of them correctly. This comparison of the results already shows they are very sensitive to the wording of the questions: amount, format, wording, etc. Hence the advantage of multiplying them. Nevertheless, the two studies reach similar conclusions about overall financial literacy based on the percent who get all three right.
One of the advantages of the Big Three is that their simplicity allows for international comparisons, as presented in Table 3 taken from Lusardi and Mitchell (2014) and updated by Lusardi (2019). On the financial literacy podium are the Germans (53,2% obtained top marks), followed by the Swiss (resp. 50,1%) and the Dutch (resp. 44,8%). Among the stragglers are the Swedish (21,4%) and, lagging far behind, the Chileans (7,7%), Romanians (3,8%), and Russians (3,7%) right at the bottom of the league table. The French are found at the median level, close to the United States (30,2%). The FLIP survey confirms this figure.1
1Other classifications sometimes return highly contrasting rankings. For example, an OECD report (2017) on adults’ financial literacy competencies proposes the following podium based on three scores (knowledge, behaviour, and attitude): France wins the gold medal and Finland the silver, with Norway and Canada joint bronze medalists! Contrary to the popular refrain, the French would not appear to be so useless at finance after all.
Table 3
Descriptive Statistics on Financial Literacy Questions Worldwide
Studies Country Sample size Year
Compound interest rate Inflation Risk diversification 3 correct answers
At least one don’t
know
Correct Don‘t
know Correct Don‘t know Correct Don‘t know
Lusardi & Mitchell (2011) USA 1 488 2009 64,90% 13,50% 64,30% 14,20% 51,80% 33,70% 30,20% 42,40% Alessie, van Rooij, & Lusardi (2011) Netherlands 1 665 2010 84,80% 8,90% 76,90% 13,50% 51,90% 33,20% 44,80% 37,60% Bucher-Koenen & Lusardi (2011) Germany 1 059 2009 82,40% 11,00% 78,40% 17,00% 61,80% 32,30% 53,20% 37,00% Sekita (2011) Japan 5 268 2010 70,50% 12,50% 58,80% 28,60% 39,50% 56,10% 27,00% 61,50% Agnew, Bateman, & Thorp (2013) Australia 1 024 2012 83,10% 6,40% 69,30% 13,00% 54,70% 37,60% 42,70% 41,30% Crossan, Feslier, & Hurnard (2011) N. Zealand 850 2009 86,00% 4,00% 81,00% 5,00% 49,00% 2,00% 24,00% 7,00% Brown and Graf (2013) Switzerland 1 500 2011 79,30% 2,80% 78,40% 4,20% 73,50% 13,00% 50,10% 16,90% Fornero & Monticone (2011) Italy 3 992 2007 40,00% 28,20% 59,30% 30,70% 52,20% 33,70% 24,90% 44,90% Almenberg & Säve-Söderbergh (2011) Sweden 1 302 2010 35,20% 15,60% 59,50% 16,50% 68,40% 18,40% 21,40% 34,70% Arrondel, Debbich, & Savignac (2013) France 3 616 2011 48,00% 11,50% 61,20% 21,30% 66,80% 14,60% 30,90% 33,00% Klapper & Panos (2011) Russia 1 366 2009 36,30% 32,90% 50,80% 26,10% 12,80% 35,40% 3,70% 53,70% Beckmann (2013) Romania 1 030 2011 41,30% 34,40% 31,80% 40,40% 14,70% 63,50% 3,80% 75,50% Moure (2016) Chili 14 463 2009 47,40% 32,10% 17,70% 20,90% 40,60% N/D 7,70% 53,10% Boisclair, Lusardi, & Michaud (2017) Canada 6 805 2012 77,90% 8,80% 66,18% 16,13% 9,36% 31,29% 42,50% 37,23% Kalmi & Ruuskanen (2017) Finland 1 477 2014 58,10% 6,10% 76,50% 6,40% 65,80% 10,25% 35,60% 14,00% Source: Lusardi (2019)
It is hard to explain the difference in the levels in financial literacy based on the percentage of three correct answers without a detailed analysis of the countries’ heterogeneity in terms of economic history, welfare and pensions system, financial market development, level of education, demographic structure, and so on. Nevertheless, a few elements could provide some reasons for these differences in levels of financial literacy across countries. For example, there is less knowledge of inflation in countries that have seen more periods of deflation (59% in Japan) than inflation (78% in Germany and 80% in New Zealand). The investment risk questions can be better understood in countries with highly developed financial markets and banking systems (France, Switzerland, etc.). Ideological references (“market” supporters or detractors) may also be at work behind these differences. This hypothesis of the influence of ideology and economic environment on an individual’s “stock” of financial literacy is the focus of a study by Bucher-Koenen and Lamla (2018), who seek to explain the accumulation of financial literacy in Germany by separating former East Germans from former West Germans. The most interesting conclusion is that, even considering individual characteristics, there still remains an (unexplained) difference between the two Germanys wherein the former West Germans are found to be more financially “literate” than the former East Germans.
Financial Literacy and Individual Characteristics
Yet these aggregate results mask strong disparities within the populations by age, level of education, gender, and employment situation, as is the case in France (Arrondel et al. 2013). Some sociodemographic groups have particularly low levels of financial literacy, other things being equal.
Not surprisingly, level of education and financial literacy are positively correlated (nearly 45% of higher education graduates answered all three questions correctly as opposed to one-quarter for the least qualified). This effect is strengthened by having taken an economics course. Yet qualifications alone are not enough to explain these financial literacy differences. The youngest individuals answer correctly less often than individuals in a higher age bracket, making for a growing financial literacy curve over the life cycle. There are significant differences between men and women: men answer all three questions correctly more often than women (41% versus 23%), and women more frequently say that they do not know the answer to a question. The qualitative effect of education, age, and gender were similar in the study of Arrondel et al. (2013).
Figure 1. Financial literacy and respondent characteristics (% of individuals answering all
questions at each level correctly) Source: FLIP Survey, 2017 (Interpretation: 41,10% of individuals aged over 65 years answered the standard Big Three questions correctly.)
0 5 10 15 20 25 30 35 40 45 50
Big Three Level 2 Level 3 Level 4 Less than secondary education Secondary education
Higher than secondary education
0 5 10 15 20 25 30 35 40 45
Big Three Level 2 Level 3 Level 4 Male Female 0 5 10 15 20 25 30 35 40 45
Big Three Level 2 Level 3 Level 4 <35 years 35-50 years 50-65 years >65 years
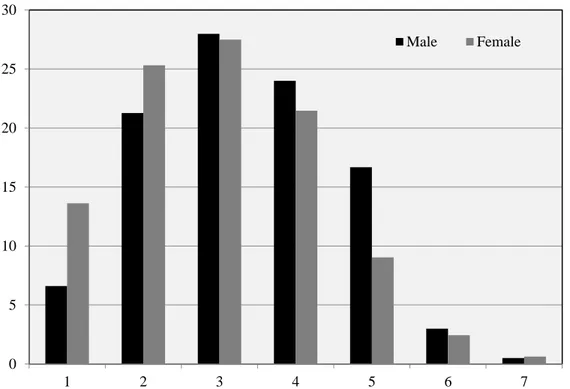
This gender gap, already observed in the literature, may reflect the men’s overconfidence in their answers, unlike the women who may refrain from answering when they are not sure (Barber and Odean 2001). This finding could also be what Figure 2 tends to show with its representation of the distribution of self-assessment of financial literacy on a scale of 1 to 7: the men believe they are better equipped to manage the household’s finances.
Figure 2. Analysis of self-assessed financial literacy level by gender (in % on a scale of 0 to 7)
Source: FLIP Survey, 2017 (Interpretation: 21,46% of women score their financial literacy level at 4 (out of 7))
Table 4 presents an econometric ordinary least squares (OLS) regression analysing the effects of respondents’ characteristics, other things being equal, on their level of financial literacy as assessed by the different measurements: the Big Three measure (0 to 3), the self-assessment measure (1 to 7), and the score measure of performance on all four versions of the Big Three questions (0 to 12). This regression confirms the aforementioned effects: a better financial literacy score among men, qualified, and older individuals. Note that having taken lessons in economics also raises the score obtained (for an equivalent level of education). The survey also contains a variable indicating the number of books read in the last twelve months. This finding would appear to evidence complementarity between
0 5 10 15 20 25 30 1 2 3 4 5 6 7 Male Female
“general” knowledge and “financial” knowledge as measured by the Big Three, where the number of books read is associated with better financial knowledge. Table 4
Financial Literacy and Individual Characteristics (OLS)
Big Three Self-assessment Score
Coef. t Coef. t Coef. t
Male 0,4482 12,54 0,3817 6,80 1,608 14,29 35 to 50 years 0,2855 4,77 0,0833 0,88 0,777 4,35 50 to 65 years 0,5119 8,38 0,3373 3,50 1,420 7,97 Over 65 years 0,6075 8,97 0,4390 4,12 1,777 8,94 Secondary education 0,2610 5,09 0,0170 0,21 0,786 4,87 Higher education 0,5147 11,54 0,1135 1,62 1,941 14,06 Economics curriculum 0,2943 7,41 0,6226 10,00 0,879 7,32 Centre 0,0193 0,49 0,2921 4,71 0,109 0,87 Right wing 0,0910 1,92 0,3862 5,21 0,622 4,16
One book read in the last year 0,1307 2,77 -0,0606 -0,81 0,488 3,38
Two books read in the last year 0,2576 4,61 0,0152 0,17 0,890 5,18
More than two books read in the last year 0,1996 3,23 -0,0284 -0,29 0,737 3,89
Constant 0,8992 12,59 2,3626 20,89 2,327 11,06 Number of observations 2233 2233 2233
R2 0,210 0,093 0,250
Note: Table 4 displays the results of the OLS that aims to identify the determinants of Financial Literacy. Reference categories: Less than 35 years old, Less than secondary education qualification, Left wing, No book read in the last year. Coefficients in bold are significant at 5% and in italics at 10%.
Interpretation: Being over 65 years old increases the average number of correct answers to the Big Three by 0,6075.
More originally, ideological and cultural factors such as political opinions could explain test performance (Arrondel et al. 2013). The survey asked individuals to position themselves on a political scale from left to right wing (eleven positions): the individuals who positioned themselves as righter wing obtained better financial literacy scores than the others (even when controlling for the level of household resources). In France, more right-wing voters tend to have more of a “free market” view of the economy and be more sensitive to “individual activation” policies. Their performance in financial education is therefore linked to their views on the respective roles of the welfare state and individual responsibility.
What the Other Measures Say
To prevent wording biases, three other measures similar to the basic Big Three were considered (see Table 2). Overall, individuals’ performances depend on the Level and of the question: less than 5% of individuals answer the three Level 4 questions
correctly, but Level 4’s diversification question appears much less tough than the other levels’ diversification questions.
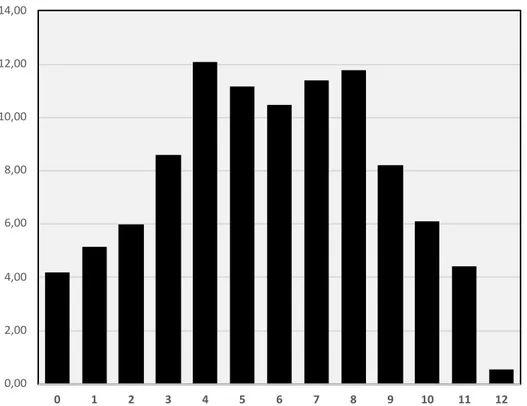
Figure 3. Number of correct answers to the four levels of questions (in % on a scale of 0 to 12)
Source: FLIP Survey, 2017 (Interpretation: 11,78% of individuals obtain a score of 8.)
Another measure was therefore used to enhance our assessment of French households’ financial literacy: it consists of using a scoring method to add up the number of correct answers to the twelve questions put for the four levels of difficulty. This indicator presents good internal consistency, since Cronbach’s alpha coefficient is 0,81 (an alpha value of over 0,7 is considered as an acceptable indicator; see Hair et al. 1998). Figure 3 represents the distribution of the population by this measure: the distribution presents two peaks (bimodal distribution) with nearly 12% of respondents obtaining a score of 4 or 8.
When the value of the economic knowledge score is analysed by the individuals’ sex, age, and level of education (Table 5), the effects are the same as with the other financial literacy measures: women are less financially literate, as are young people and individuals with a low level of education. Table 4’s regression (5th and 7th columns) for this variable statistically validates these conclusions. The other variables introduced into the explanatory model for the score also confirm the previous effects: the score value is higher for “right wingers” and “readers.”
0,00 2,00 4,00 6,00 8,00 10,00 12,00 14,00 0 1 2 3 4 5 6 7 8 9 10 11 12
Table 5
Average Number of Correct Answers to the Four Levels of Questions
Average Male 6,45 Female 5,05 <35 years 4,70 35–50 years 5,79 50–65 years 5,91 >65 years 6,42 Less than secondary education 5,05 Secondary education 5,41 Higher than secondary education 6,91 Source: FLIP Survey, 2017
Interpretation: The women answered 5,05 (of 12) questions correctly on average.
Nicolini (2019) developed this questionnaire on economic knowledge, and he took his measurement further by comparing the different European countries’ rates of success at answering the 50 survey questions on financial literacy. He obtains the following statistics: the Spanish score 62% of correct answers, the Germans 49%, the Italians 47%, the English 43%, and lastly, the Swedish and French 39%. This methodology was not relevant for our purposes since the measurement of Nicolini’s financial literacy incorporated both numeracy and financial information issues that could lead to problems of endogeneity in our analysis of investment behaviour. We preferred to limit ourselves to numeracy questions.
Does Financial Literacy Influence Behaviour?
“Standard” saver theory states that portfolio choices are based on dual rationality of choices and expectations. This theory has it that individuals’ investments depend on three basic factors: present resources, (rational) expectations of asset return and risk, but also of earned income, and agents’ preferences, especially with respect to risk (aversion and temperance). It predicts that all savers will hold at least a small quantity of risky assets, unless fixed asset-holding costs constrain investors on the stock market (Haliassos and Bertaut 1995). As observed previously, shareholding is low in many countries, including in France. Here we have the famous “stock participation puzzle,” which asks why savers turn their backs on risky assets. The standard framework provides initial explanations for this: costs of holding and managing a risky portfolio, exposure to other risks, especially professional risks, future debt constraints, lack of labour supply flexibility, etc. (Gollier 2001). Psychological (or behavioural) economics, for its part, puts forward certain
cognitive “biases” or “emotions” to explain this “puzzle” such as ambiguity aversion, loss aversion, pessimism, distrust, and lack of economic literacy (Guiso and Sodini 2013). The low level of household financial literacy is described as one of the factors that could explain it (van Rooij et al. 2011; Arrondel et al. 2015; Bianchi 2018).
This hypothesis is tested here in the case of France by analysing the determinants of share investment based on one variable measured in the FLIP survey. This variable considers the weight of shares in households’ portfolios: is it the largest investment in their financial assets? It is the largest in the case of 8.6% of the panel’s households.
Representativeness of the Data
The study of these questions nonetheless calls for an analysis of the representativeness of the FLIP survey from the point of view of wealth and financial assets. To this end, it is interesting to compare the survey’s data with data from the INSEE (French National Institute of Statistics and Economic Studies) Household Wealth Surveys.
Table 6 compares the amounts of gross wealth and financial assets found by the two sources (in 2014 for INSEE). The first observation to be drawn from these statistics is the high rate of missing data in the FLIP survey: 22,8% of respondents did not know how to answer the question on gross wealth and 24,4% refused to; 23,1% of respondents could not give any information on their financial assets, while 16,9% did not want to. The asset variables can therefore be used solely for half of the sample. The distributions observed for FLIP survey respondents are relatively similar to the INSEE distributions: the value of median gross wealth in the INSEE Household Wealth Survey (158 001 euros) tallies with the FLIP survey bracket, as does the value of the upper decile (595 723 euros). The same observation can be made with respect to financial assets (11 639 euros for the median and 109 035 euros for the tenth decile). An average value in the FLIP survey can be calculated for these two variables based on the centres of the brackets: although the values obtained are lower, they are relatively similar to those found by the Household Wealth Surveys. The good quality of the FLIP survey’s wealth variables is also reflected in terms of holding the different assets. For example, the proportion of savers who say they are “considering investing” in shares (15,7%) is consistent with the number of shareholders observed in France by INSEE (8,8%). The rates of owners of their usual residence are comparable in both surveys, even though the FLIP survey presents a four-percentage-point overestimation: 61,8% compared with 57,8% in the 2017 Household Wealth Survey (Cazenave-Lacrouts et al. 2018). The rates of holders of retirement savings and life assurance products are also overestimated in the FLIP survey: 58,4% vs. 45,6%. These differences can most likely be explained by differences in the question wording and calibration variable.
Table 6
Distribution of Gross Wealth and Financial Assets
FLIP Survey 2017
INSEE Household Wealth Survey 2017 Overall wealth Total Respondents
Cumulative respondents Respondents Cumulative respondents Less than €8 000 10,0 19,0 19,0 16,4 16,4 €8 000 to €14 999 2,8 5,3 24,3 6,4 22,8 €15 000 to €39 999 2,2 4,2 28,5 9,6 32,3 €40 000 to €74 999 1,7 3,2 31,7 5,0 37,3 €75 000 to €149 999 4,9 9,3 40,9 10,5 47,9 €150 000 to €224 999 8,7 16,4 57,3 13,0 60,8 €225 000 to €299 999 6,3 11,9 69,2 10,7 71,5 €300 000 to €449 999 8,0 15,1 84,3 12,6 84,1 €450 000 to €749 999 4,9 9,3 93,6 9,1 93,2 €750 000 and over 3,4 6,4 100,0 6,8 100,0 Don’t know 22,8 Refuse to answer 24,4 100,0 100,0 100,0 Estimated value
(centre of bracket for FLIP survey) 266 000 273 690
Financial assets Less than €1 500 12,6 21,1 21,1 23,2 23,2 €1 500 to €2 999 7,9 13,2 34,2 7,8 31,0 €3 000 to €7 999 8,1 13,5 47,7 13,3 44,3 €8 000 to €14 999 5,6 9,3 57,0 10,8 55,1 €15 000 to €29 999 7,6 12,7 69,8 13,1 68,1 €30 000 to €44 999 4,6 7,7 77,5 7,9 76,0 €45 000 to €74 999 4,1 6,8 84,3 8,3 84,3 €75 000 to €149 999 4,8 8,0 92,3 8,3 92,6 €150 000 to €249 999 2,5 4,2 96,5 3,6 96,2 €250 000 and over 2,1 3,5 100,0 3,8 100,0 Don’t know 23,1 Refuse to answer 16,9 100,0 100,0 100 Estimated value
(centre of bracket for FLIP survey) 43 500 56 175 Sources: FLIP Survey, 2017; INSEE Household Wealth Survey 2017.
Interpretation: 4,8% of households have financial assets in the €75 000–150 000 bracket (FLIP survey). Interpretation: Mean gross wealth in INSEE Household Wealth Survey 2017 is €273 690.
Table 7
Financial Literacy and Demand for Shares (Probit and Linear Probability Model)
Preponderance of shares in financial assets
Probit Marginal effect t Probit Marginal effect t OLS effect t OLS effect t Assets from €150 000 to €225 000 0,030 0,94 0,029 0,88 0,015 0,52 0,015 0,55 Assets from €225 000 to €300 000 0,066 1,87 0,074 2,05 0,041 1,30 0,048 1,52 Assets from €300 000 to €450 000 0,070 2,10 0,083 2,40 0,060 1,94 0,067 2,17 Assets from €450 000 to €750 000 0,158 3,84 0,196 4,58 0,153 4,32 0,172 4,88 Over €750 000 0,234 4,82 0,272 5,40 0,257 6,37 0,273 6,79
Income per UA from €1 650 to <€1 900 -0,010 -0,30 -0,002 -0,06 -0,010 -0,31 -0,007 -0,21 Income per UA from €1 900 to <€2 200 0,013 0,42 0,025 0,74 -0,003 -0,10 0,009 0,28 Income per UA from €2 200 to <€2 500 0,017 0,51 0,029 0,81 0,003 0,08 0,012 0,34 Income per UA from €2 500 to <€3 200 0,022 0,75 0,031 1,01 0,013 0,41 0,022 0,70 Income per UA €3 200 and over 0,048 1,69 0,061 2,07 0,054 1,79 0,062 2,07 35 to 50 years -0,070 -2,34 -0,067 -2,20 -0,065 -1,91 -0,060 -1,77 50 to 65 years -0,033 -1,08 -0,034 -1,10 -0,022 -0,65 -0,022 -0,66 Over 65 years -0,028 -0,90 -0,031 -0,98 -0,025 -0,67 -0,026 -0,71 Risk aversion (0 to 10) 0,021 5,56 0,021 5,55 0,024 5,67 0,023 5,53 Time preference (0 to 10) 0,007 1,65 0,008 1,85 0,006 1,41 0,007 1,59 FL score (0 to 12) 0,023 5,83 0,022 5,83 Big Three 0,095 4,99 0,096 4,87 Number of observations 1241 1241 1241 1241 Pseudo-R2 or R2 0,200 0,189 0,158 0,165
Note: Table 7 displays the results of the probit and OLS model that aims to identify the determinants of demand for shares. Reference categories: Assets of less than €150 000, Income per unit of account less than €1 650, Less than 35 years old, Less than secondary education qualification. Coefficients in bold are significant at 5% and in italics at 10%.
Interpretation: Answering the Big Three questions correctly increases the probability that shares will predominate in financial assets by 9,47 points.
The Demand for Shares: First Results
Table 7 presents the results of the econometric analysis of explanatory variables for the demand for shares (with reference to the optimal portfolio choice model): level of wealth, level of income per consumer unit, age, qualifications, saver preferences on scales from 0 to 10 (high-to-low risk aversion and high-to-low time preference), and financial literacy measured either by the score of the number of correct answers to the twelve questions or, alternatively, the usual Big Three indicator (a dummy set at 1 for Level 1 with three correct answers). The coefficients given in the table
represent the marginal effects of the different variables estimated by probit models, i.e., their quantitative impact on the dependent variable: the probability that shares will be dominant in financial assets.
Financial literacy clearly significantly raises the demand for shares irrespective of the financial literacy measure. When individuals answer the Big Three variables correctly, the probability that the majority of their financial assets will be shares increases 9,5 points. A one-point increase in the 12-position financial literacy score increases the frequency of the dependant variable by 2,3 probability points. If we introduce the two variables in the same form (in four different positions: 0 correct answer to 3 correct answers for the Big Three; quartile 1 to quartile 4 of the score distribution), it is then possible to compare the quantitative effects more precisely: answering the three Big Three questions correctly increases the probability of holding a majority of shares by 12,6 points and belonging to the top quartile of the score increases it by 17,3 points. The score measure appears more discriminating than the Big Three measure. A further comparative analysis of the two FL measures is therefore necessary (§ 5).
This effect is to be compared with other variables’ effects, which are sometimes quantitatively greater, especially the level of assets: the probability of individuals investing the bulk of their assets in shares is 23,4 points higher among the richest (wealth over 750 000 euros) than among the less well-off (wealth less than 150 000 euros). As expected, the least risk-averse households have a greater demand for shares: +2,1 probability points per level of aversion (across eleven positions from 0 to 10) for a risky portfolio.
Endogeneity Issue
One criticism that could be made of Table 7’s regressions concerns the statistical biases induced by the introduction of the measurements of financial literacy with respect to the variable studied (Lusardi and Mitchell 2014). First, there is the causality bias in that it could be the fact of investing in shares that actually increases financial knowledge (reverse causality). Second, there is the endogeneity bias since certain individual characteristics affect both the level of financial literacy and the demand for shares. Lastly, there is the measurement error bias, since the variables used here are merely “proxies” of the “real” level of financial knowledge.
These biases can be corrected by conducting the same regressions as those in Table 6, but using what is termed an instrumental variables estimation method. This said, dealing with endogeneity requires we have valid and relevant instruments for the advanced financial literacy index. According to the results of table 4, we choose two instruments for financial literacy: the level of education of the respondent and the existence of an economic curriculum. While these variables are relevant instruments meaning that they are correlated with the endogenous variable and not correlated with the exogenous variable, their validity is to be discussed.
Table 8
Financial Literacy and Demand for Shares: IV Regressions (Linear Probability Model)
Preponderance of shares in financial assets
First step GMM First step GMM Coef. t Coef. t Coef. t Coef. t
Constant 3,792 11,35 -0,199 -2,62 -0,039 -0,69 -0,079 -2,10 Assets from €150 000 to €225 000 0,232 1,10 0,012 0,55 0,049 1,18 0,009 0,41 Assets from €225 000 to €300 000 0,911 4,00 0,032 0,95 0,145 3,10 0,032 0,95 Assets from €300 000 to €450 000 1,050 4,44 0,050 1,41 0,179 3,87 0,046 1,24 Assets from €450 000 to €750 000 1,562 5,93 0,138 2,80 0,191 3,76 0,148 3,12 Over €750 000 1,482 5,52 0,241 4,15 0,214 3,85 0,244 4,14
Income per UA from €1 650 to <€1 900 0,328 1,26 -0,014 -0,49 0,054 1,11 -0,014 -0,47 Income per UA from €1 900 to <€2 200 0,608 2,51 -0,010 -0,29 0,034 0,72 0,003 0,09 Income per UA from €2 200 to <€2 500 0,411 1,45 -0,001 -0,04 0,015 0,29 0,009 0,23 Income per UA from €2 500 to <€3 200 0,765 3,46 0,006 0,16 0,104 2,27 0,009 0,26 Income per UA €3 200 and over 0,813 3,76 0,045 1,21 0,129 2,95 0,046 1,23 35 to 50 years 0,726 2,70 -0,070 -2,07 0,118 2,50 -0,070 -2,08 50 to 65 years 0,861 3,22 -0,025 -0,75 0,166 3,49 -0,032 -0,92 Over 65 years 0,985 3,44 -0,027 -0,71 0,195 3,73 -0,035 -0,90 Risk aversion (0 to 10) 0,060 1,81 0,023 5,13 0,019 3,17 0,021 4,45 Time preference (0 to 10) 0,083 2,49 0,005 1,31 0,011 1,83 0,006 1,40 FL score (0 to 12) 0,030 1,99 Big Three 0,197 1,98 Secondary education 0,257 1,21 0,030 0,73 Higher education 1,045 5,71 0,112 3,22 Economics curriculum 0,580 3,89 0,139 4,74 Number of observations 1241 1241 1241 1241 R2 0,222 0,162 0,147 0,140
F-statistic 1st stage reg. 23,38 15,54 Hansen J test p-value 0,9205 0,9867 Endogeneity test p-value 0,5897 0,2889
Note: Table 8 displays the results of the IV regressions that aims to identify the determinants of demand for shares. Reference categories: Assets of less than €150 000, Income per unit of account less than €1 650, Less than 35 years old, Less than secondary education qualification. Coefficients in bold are significant at 5% and in italics at 10%.
Table 8 reports GMM regression results for stock asset demand. Instrumenting financial literacy increases its coefficient (see table 7 with OLS estimates), thereby
correcting for a global downward bias. In both regressions, the Hansen J statistic test shows that the instruments are valid, but the endogeneity test concludes that advanced financial literacy is exogenous. First stage regressions reveal a significant correlation between advanced financial literacy and the instruments. The F-statistics uncover a strong joint significance of the instruments as it is above the threshold recommended to avoid weak instruments problem (Staiger and Stock 1997)
Instrumenting for the level of financial literacy shows that the previous conclusions are robust: the positive effect of financial literacy remains positive and significant to explain the demand for shares.
To sum up, Table 7 and 8 show that although financial literacy clearly plays a role in investors’ portfolios, it is one determinant among others. If public policymakers seek to steer savings toward riskier savings, they might consider improving the economic knowledge of young savers. However, this is far from a miracle cure (Arrondel and Masson 2014). Other leverage could be used: taxation, transaction costs, information, risk culture, optimism, etc.
Which Financial Literacy Measure Should Be
Retained?
One of the main objectives of the ELIPSS survey and the methodology developed by Gianni Nicolini (2019) is to compare different measures of financial literacy and to compare these measures with the standard Big Three method. We propose here an alternative measure based on 12 questions instead of 3. We have retained here only the questions from the Big Three but with different wording on amounts, interest rates, etc. Finally, we have 4 versions of the Big Three (Level 1 to Level 4). What does this measure then bring in comparison with the Big Three?
Table 9 provides some descriptive statistics on the two measures. The Cronbach’s alpha, which measures the consistency of the score established from the 4 series of 3 questions, is greater than 0,80, which attests to significant internal consistency. The correlation between the standard Big Three (Level 1) and the global score is 0,827 (with all Levels) and 0,677 with the global score without the Level 1. The two measures are therefore highly correlated. The Big Three is the measure that contributes the most to the overall indicator, which attests to its superiority over all other sets of questions taken individually. But the individual superiority of the standard Big Three (Level 1) over all other levels taken individually does not mean that the totality of the information should not be considered.
Table 9
Characteristics of Financial Literacy Measures
Financial literacy items Correlation with the score Correlation with the score (without the item) Cronbach’s alpha without the item
Level 1 (Big Three) 0,827 0,677 0,745 Level 2 0,809 0,646 0,760 Level 3 0,823 0,655 0,756 Level 4 0,743 0,556 0,800 Cronbach’s alpha 0,8138 Interpretation: The correlation between the standard Big Three (Level 1) and the global score is 0,827 (with all Levels) and 0,677 with the global score without the Level 1.
To compare the two measures, we can consider the share of respective variance explained in the OLS regression on the demand for risky assets (as in Table 7). For this purpose, we introduced the two financial literacy (FL) variables in an identical form: 4 modalities for the standard Big Three (0 correct answer to 3 correct answers); 4 modalities for the score (quartile 1 to quartile 4 of the distribution). The
R2 is then 0,1417 without any financial literacy variable, 0,1583 when introducing the Big Three, and 0,1770 when introducing the global score. The partial R2s are respectively 1,94% for the Big Three and 4,1% for the score. The introduction of the score in the regression of the demand for risky assets therefore significantly improves the quality of the regression.
Another way to compare the two indicators is to analyse the measurement error biases in the instrumental regressions similar to the ones in the Table 8. If measurement error is a problem, we would expect it to be a bigger issue with the Big Three index than with score. So, in the analysis of shares holdings we would expect more attenuation bias with the former than the latter. Since the other endogeneity issues would be equally present in both, a comparison of the two resulting coefficient estimates would tell us if the Big Three has important measurement error (at least to the extent that the additional 12 might address). Table 10 provides the elements of this comparison.
Table 10
Measurement error of Financial Literacy Measures in IV Regressions
OLS est. (s.e.) IV est. (s.e) First stage R2 F test (3,1222)
Big Three (0 to 3) 0,052(0,012) 0,110(0,056) 0,160 18,27 FL score (1 to 4) 0,052(0,009) 0,073(0,037) 0,223 22,83 Note: Table 10 displays the estimators of Financial Literacy in IV regressions for the demand for shares. The two FL variables are in an identical form: 4 modalities for the standard Big Three (0 correct answer to 3 correct answers); 4 modalities for the score (quartile 1 to quartile 4 of the score distribution).
Both measures were instrumented in the same way. The OLS estimators of the two measures (introduced linearly) are identical; the only difference concerns the better precision of the score estimator. However, the similarity of the two
coefficients suggests that the score measure doesn’t get rid of any additional noise. It can be seen that the attenuation bias is much larger with the Big Three than with the FL score (0,58 vs. 0,21) and the characteristics of the first-stage regression show a statistical superiority of the score. But it appears the differences in IV estimates look within the standard error of the estimates.
One of the objectives of this article was to judge the relevance of the Big Three by comparing it with more exhaustive but similar measures. The Big Three as used in most studies seem a good proxy for a more global measure based on a larger battery of questions. Nevertheless, having this global measure available improves the statistical quality of the measure even though this more sophisticated measure does not statistically significantly improve behavioural regressions.
To improve the measurement of financial education more satisfactorily, there appears to be a promising way for calculating scores from a large number of questions. The problem is that this method is very expensive in terms of the number of questions. For example, Arrondel and Masson (2017) use such a scoring method for measuring individual preferences for saving (risk aversion, time discounting, and altruism). These summary and ordinal scores are computed on the basis of over one hundred questions covering a wide range of economic and social areas, such as consumption, leisure, investments, work, family, health, retirement, etc. These questions are often concrete or related to everyday life or plans, and are relatively easy to answer; others are more abstract, and pertain to responses to fictional scenarios or lottery choices. Arrondel and Masson (2014) show that these scores have better statistical properties than traditional measures of preferences (scales or lotteries). In the same vein, Nicolini (2019) uses the 50 survey questions of his questionnaire to compare financial literacy levels in Europe, but all the questions used are part of the financial domain and are therefore difficult to use to build an exogenous explanatory score to study financial behaviour (problem of reverse causality).
Conclusion: Is Financial Literacy a Cure-All?
Having a good measure of individuals’ financial literacy is not only useful for testing household savings behaviour, but also for justifying and evaluating public policies on financial education. That’s what we’re interested in concluding.
Some of the most illustrious economists have put forward the role of financial literacy as a “cure” for certain economic problems: lack of growth (Phelps 2017), financial crises (Shiller 2008) and wealth inequalities (Lusardi 2009). Some even suggest that governments should provide for financial education for the public to improve national economic knowledge. Others propose putting in place education programmes from a young age. Yet is all this effective? Some studies doubt it (Hastings et al. 2013).
On a more modest level, this article has studied the question of the low level of risky investments in household portfolios. More generally, it concerns the issue of the allocation of household savings and long-term investments (Arrondel and Masson 2017).
Although the French public present a high level of financial savings (around 15% of households’ disposable income), these savings are considered overcautious and insufficiently risky. The subprime mortgage crisis strengthened this tendency: direct share purchasing fell by approximately 50% from 2008, the start of the great recession, to 2016. Although 2017 saw a slight trend upward, the number of individual shareholders stands at some 3,5 million today, at just over 7% of the adult population. This lack of interest in risky investments is not specific to France, as less than 9% of households in the euro area hold listed shares. This perplexes political and economic players who are concerned about the lack of financing for the productive sector and long-term investment in our economy.
Why do savers prefer risk-free investments to such an extent, and how can they be drawn back to the stock market? The answers are to be sought in the causes, beyond the simple reasons usually put forward of too much taxation and excessive transaction costs. Why are the French too risk averse? Is their perception of their financial or professional prospects so gloomy that they have turned their backs on the stock exchange? Do they really have the “level” for it? Are they just “scared”? These questions are of interest as much to academic circles as financial players (Arrondel and Masson 2017).
The reasons commonly advanced by professionals can be summed up in six points. The first two concern household demand: (1) lack of financial knowledge and literacy and a lack of appetite for risk, if not “desire for” long-term risky financial savings for ideological reasons; and (2) French households’ lack of trust, whether “general” (pessimism about their personal situation or the economic climate) or “specific” (distrust of their bank). The next two points have to do with tax and regulatory constraints: (3) heavy taxation on income from shares in France; and (4) increasingly restrictive prudential regulations. The last two points concern the investment supply: (5) mismatch of the supply of banking and financial advice (lack of transparency and information on the products offered and flawed or biased customer knowledge); and (6) overly timid product innovation, where products need to be developed based on the concept of “savings for projects” tailored to the different phases of the saver’s life cycle (housing, professional career, preparation for retirement, with French-style pension funds, dependency, and even inheritance). Academic research, based on field surveys, can be used to check and measure the relevance of these answers. The studies covered in this article put forward the French people’s low level of financial literacy as a brake on risky investments by savers. Legislation could then improve financial literacy, even if it takes time and would appear to more effectively target the young. Statistically, financial illiteracy