HAL Id: halshs-00646590
https://halshs.archives-ouvertes.fr/halshs-00646590v3
Preprint submitted on 6 Nov 2014
HAL is a multi-disciplinary open access
archive for the deposit and dissemination of sci-entific research documents, whether they are pub-lished or not. The documents may come from teaching and research institutions in France or abroad, or from public or private research centers.
L’archive ouverte pluridisciplinaire HAL, est destinée au dépôt et à la diffusion de documents scientifiques de niveau recherche, publiés ou non, émanant des établissements d’enseignement et de recherche français ou étrangers, des laboratoires publics ou privés.
Neighborhood effects and take-up of transfers in
integrated social policies: Evidence from Progresa
Matteo Bobba, Jérémie Gignoux
To cite this version:
Matteo Bobba, Jérémie Gignoux. Neighborhood effects and take-up of transfers in integrated social policies: Evidence from Progresa. 2014. �halshs-00646590v3�
WORKING PAPER N° 2011
– 37
Neighborhood effects and take-up of transfers in integrated social
policies: Evidence from Progresa
Matteo Bobba Jérémie Gignoux
JEL Codes: G18; G21; G28; G32
Keywords: Spatial externalities; Peer effects; Take-up of social policies; Policy evaluation; Conditional cash transfers
P
ARIS-
JOURDANS
CIENCESE
CONOMIQUES48, BD JOURDAN – E.N.S. – 75014 PARIS
TÉL. : 33(0) 1 43 13 63 00 – FAX : 33 (0) 1 43 13 63 10
www.pse.ens.fr
CENTRE NATIONAL DE LA RECHERCHE SCIENTIFIQUE – ECOLE DES HAUTES ETUDES EN SCIENCES SOCIALES
Neighborhood effects and take-up of transfers in integrated social
policies: Evidence from Progresa
∗
Matteo Bobba† J´er´emie Gignoux‡
September 2014
Abstract
When potential beneficiaries share knowledge and attitudes about a policy inter-vention, that can influence their decisions to participate and, in turn, change the effec-tiveness of both the policy and its evaluation. This matters notably in integrated social policies with several components. We examine neighborhood effects on the take-up of the schooling subsidy component of the Progresa-Oportunidades program in Mexico. We exploit random variations in the local densities of program beneficiaries generated by the randomized evaluation. Higher program densities in areas of 5 km radius in-crease the take-up of scholarships and enrollment at the junior-secondary level. These neighborhood effects exclusively operate on households receiving another component of the program, and do not carry over larger distances. While several tests reject het-erogeneities in impacts due to spatial variations in implementation, we find suggestive evidence that neighborhood effects stem partly from the sharing of information about the program among eligible households.
Keywords: spatial externalities; peer effects; take-up of social policies; policy
evaluation; conditional cash transfers.
JEL Codes: C9, I2, J2, O2.
∗This draft supersedes previous versions circulated under the title: ”Spatial Externalities and Social Multipliers in Schooling
Interventions” and ”Policy Induced Social Interactions”. We are grateful to Orazio Attanasio, Samuel Berlinski, Fran¸cois Bourguignon, Giacomo De Giorgi, Pierre Dubois, Marc Gurgand, Sylvie Lambert, Karen Macours, Eliana La Ferrara, Imran Rasul, and Martin Ravallion, as well as audiences at various seminars, conferences and workshops for useful comments and discussions. We also thank Marco Pariguana for excellent research assistance and the Secretaria de Educacion Publica (Mexico), the Oportunidades Staff, and in particular Raul Perez Argumedo for their kind help with the datasets.
†Inter-American Development Bank, 1300 New York Avenue 20577 Washington DC (e-mail: matteob@iadb.org) ‡Paris School of Economics (INRA), 48 boulevard Jourdan 75014 Paris France (e-mail: gignoux@pse.ens.fr).
1
Introduction
Demand-side schooling interventions have now become an important component of social policies in developing countries. The available empirical evidence suggests that cash sub-sidies in particular can have large effects on schooling decisions (e.g. Glewwe and Kremer 2006). These interventions have been found to be effective devices for encouraging the human capital investments of poor households (e.g. Parker et al., 2008 and Fiszbein and Schady, 2009). Recent studies have documented that they can also induce, in beneficiary areas, a set of non-market interactions that can further increase their effects (Angelucci et al., 2010, Bobonis and Finan, 2009, and Lalive and Cattaneo, 2009). Social interactions affecting pref-erences for investments in education and transfers within extended families have in particular been posited and documented. However, there is still incomplete knowledge on the specific networks within which those interactions occur and the specific mechanisms at play.
The sharing of knowledge and attitudes about the policy interventions among networks of potential beneficiaries is one set of social interactions that remains under-documented in the setting of social policies in developing countries. The role of information-sharing and initial preferences and prejudices in determining program participation has been emphasized in the context of social policies in the United States. For instance, Bertrand et al. (2000) and Aizer and Currie (2004) find evidence of networks effects, i.e. correlations in program take-up decisions within neighborhoods and ethnic groups. In the case of the Food Stamp Program, Daponte et al. (1999) find that ignorance about the program contributes to non-participation.
The conditional cash transfer (CCT) programs that have been implemented in developing countries create many opportunities for information-sharing and attitudes-based interactions between beneficiaries. These opportunities are likely to affect the take-up rates of schooling subsidies and they are influenced by three types of factors that span both supply and demand sides. First, in integrated social policies, cash subsidies for schooling tend to be associated with complementary interventions for the provision of health care or support for better nutrition. Beneficiaries do not necessarily participate in all the interventions, so that there is an intensive margin for potential recipients to increase their participation in the program by taking up more components. Second, the recipients of the transfers, notably women and mothers, regularly encounter each other during program operations, for instance in meetings of beneficiaries or during activities of complementary interventions, such as visits to health centers. Third, the targeting of those interventions implies that participants often have similar socioeconomic backgrounds and are thus likely to identify with each other (Akerlof,
1997). Hence, the demand-side schooling interventions are likely both to enhance the existing interactions among groups of beneficiaries, and to further shape those groups, thus producing externalities that would not occur were individuals treated in isolation.
As with other mechanisms of social interactions, interactions based on sharing of infor-mation about the policy intervention and attitudes can explain variations across areas and groups in the take-up of schooling subsidies which do not stem from cost-benefit factors such as the differences in the supply of schooling or the opportunity costs of schooling. However, they depart from other interactional mechanisms because they take place among networks of potential beneficiaries of the interventions. Interactions between potential beneficiaries have different implications than other sorts of social interactions for the design and implemen-tation of the interventions. The targeting of a program and the way it mobilizes potential beneficiaries is particularly likely to affect the extent of those interactions and thus it is crucial for its effectiveness.
In this paper, we examine the presence of neighborhood effects, in the form of social interactions within networks of potential beneficiaries, affecting the take-up of the schooling subsidy component of the Progresa-Oportunidades social program (see, e.g., Schultz, 2004, and Parker et al., 2008). The program entails several unbundled components in addition to the schooling subsidies, notably food stipends conditional on health checks. While the take-up of the nutrition and health component is almost 100 percent, a large share of children eligible for transfers for secondary schooling remain unenrolled.
The program targets poor households in small villages located in rural areas of Mexico, and we base our analysis on the study of cross-village spatial externalities. Due to the high level of program penetration and geographic targeting, the topography of the area covered by the program consists of clusters of neighboring villages rather than isolated villages with a high density of beneficiary communities within treated regions. In this context, beneficiaries living in neighboring villages are likely to interact in several ways, and share information on the program. To examine the effects of those interactions, we investigate the extent to which variations in the local density of the program in areas surrounding beneficiary villages influenced the take-up response of potential beneficiaries.
Spillovers have previously been examined in the context of Progresa - Oportunidades by comparing the outcomes of ineligible and eligible households in the same villages us-ing partial-population designs (Moffitt, 2001). Accordus-ingly, Bobonis and Finan (2009) and Lalive and Cattaneo (2009) have found evidence of spillovers through peer effects in school enrollment, and Angelucci and De Giorgi (2009), Angelucci et al. (2010) and Angelucci et al.
(2012) evidence of transfers within both village and household-level networks.1 However, in the Progresa-Oportunidades setting, because many beneficiary communities are very close to each other, spillovers may occur not only within but also across villages.
To investigate the presence of neighborhood effects, we combine data from the experimen-tal evaluation of the program with information on the geo-referenced locations of the villages benefitting from it. We focus our analysis on the secondary school participation decisions of program-eligible children, which is the primary short-run outcome of the intervention and the key requirement associated with the largest component of the in-cash transfer.
We use a simple empirical framework that allows us to disentangle the effects of the incentives resulting from the program eligibility of the household (and the village it resides in) from the indirect effects arising from the local density of program recipients at the level of areas surrounding targeted villages. Exploiting the randomized evaluation design and the clustered spatial distribution of the villages in our sample, we causally identify program externalities across neighboring villages. The allocation of evaluation localities between the treatment and control group is random within each area surrounding villages. These exogenous variations enable us to identify the spillovers induced by the density of program delivery at any distance from the villages in our sample. Next, we investigate whether externalities arise in this setting because of social interactions between program beneficiaries, or other changes associated with variations in the local density of the program across areas surrounding villages.
We find evidence of a positive and robust effect of the local density of participants in the program on secondary school participation decisions: the presence of other potential benefi-ciaries in nearby villages further increases the effect of the intervention. This neighborhood effect is large, with a marginal effect of an additional treated village in the neighborhing area of 2.7 percentage points on secondary school enrollment – to be compared with a di-rect effect of own village treatment of 9.5 percentage points – and it is present only over short distances (0–5 km) but vanish over larger radiuses (5–10 km). Crucially, these spatial externalities appear to be concentrated among children from beneficiary households; there is no evidence of such effects for children in the control group and for those in treated vil-lages who are not eligible for the program. This remarkable heterogeneity sheds some light on the mechanisms behind program externalities. Interactions within networks of potential beneficiaries spanning across villages seem to have contributed to increase the take-up of
1
Other recent examples from the literature include Duflo and Saez (2003) who examine the take-up of retirement plans within academic departments, and Kuhn et al. (2011) who study spillover effects of lottery winnings within Dutch postal codes.
the educational component of the program and heighten its impacts on schooling. We argue that, while interactions through preexisting social networks should affect all households that share local resources, social interactions that are restricted to program beneficiaries are likely to be associated with knowledge and attitudes toward the program. Accordingly, we find that our variation in local treatment density is associated with increased knowledge, among eligible households, about the different components of the program – notably the schooling subsidies.
Some sorts of spatial variations in the delivery of the program among evaluation villages could in principle explain the observed relationship between the local density of the treatment and take-up of schooling subsidies. This may occur if, for instance, areas with more evalua-tion villages benefited from more efficient program operaevalua-tions, or received larger investments in supply infrastructure, thereby helping recipients comply with the schooling requirements of the program. However, using direct measures of efficiency of program operations or in-vestigating whether spillovers are apparent only within the administrative units that supply social services, we find little support in the data for such implementation variations.
Our results thus provide evidence of the effects of the local density of treatment on the take-up of the different components of social policies. We find suggestive evidence that information-sharing among networks of beneficiaries is driving those effects. Our findings confirm, in the context of a developing country, that social interactions associated with higher treatment density can increase individual responses to a social policy.
Our findings also relate to other studies which have used experimental variations of treat-ment density to identify the effects of spillovers of interventions (e.g. Miguel and Kremer, 2004, Banerjee et al., 2010, and Ichino and Schundeln, 2012). However, those studies were conducted during small-scale interventions, and hence potentially miss important effects that occur during the full-scale implementation of a program. 2. Our results shed light on those scaling-up effects by examining spatial externalities in an experimental sample surveyed in the midst of the implementation of the policy on a large scale.
2
To partially overcome this issue, researchers have recently begun to inject experimental variations directly into the intensity of spillover effects by varying the saturation of individuals treated within treated clusters (e.g. Duflo and Saez (2003); Gine and Mansuri (2011); Crepon et al. (2013))
2
Setting and Data
2.1
Program features
Initiated in 1997 and still in effect, Progresa-Oportunidades is a large-scale social program that aims to foster the accumulation of human capital in the poorest communities of Mexico by providing both cash and in-kind benefits, which are conditional on specific behaviors in the key areas of health and education. It grants scholarships and school supplies to children aged under 17, conditional on regular attendance of one of the four last grades of primary schooling (grades 3 to 6) or one of the three grades of junior secondary schooling (grades 7 to 9). The scholarships increase in amount with school grade, and in grades 7 to 9 are larger for girls than boys. The program also distributes cash transfers for the purchase of food, provides food supplements, and promotes health care through free preventive education interventions on hygiene and nutrition. The distribution of the food stipends and nutritional supplements is conditional on health care visits at public clinics. The benefits are delivered to the female head of the household (usually the mother) on a bimonthly basis after verification of each family member’s attendance in the relevant facility.3
The Progresa program is targeted both at the village and household levels. During the first years of the program, poor rural households were selected through a centralized process which encompasses three main steps. First, villages were ranked by a composite index of marginality, which was computed using information on socioeconomic characteristics and ac-cess to the program infrastructures from the censuses of 1990 and 1995.4 Second, potentially eligible localities were grouped based on geographical proximity, and relatively isolated com-munities were excluded from the selection process. Third, eligible households were selected using information on covariates of poverty obtained from a field census conducted in each locality before its incorporation into the program.5
The program started in 1997 in 6,300 localities with about 300,000 beneficiary households,
3
Overall cash transfer amounts can be substantial: the median benefits are 176 pesos per month (roughly 18 USD in 1998), equivalent to about 28 percent of the monthly income of beneficiary families.
4
Localities with fewer than 50 or more than 2,500 inhabitants were excluded during the first years of the program. We use the words “locality” and “village” interchangeably when referring to distinct census-designated rural population clusters, i.e. settlements in which the inhabitants live in neighboring sets of living quarters and that have a name and locally recognized status (including hamlets, villages, farms, and other clusters). Rural localities (also called rural communities), or villages, are defined as having fewer than 2,500 inhabitants.
5
A proxy-mean index was computed as a weighted average of household income (excluding children), household size, durables, land and livestock, education, and other physical characteristics of the dwelling. Households were informed that their eligibility status would not change at least until November 1999, irre-spective of any variation in household income.
and expanded rapidly during the following years. In 1998, it was delivered to 34,400 localities (1.6 million households), and in 1999, coverage increased to 48,700 localities (2.3 million households). The expansion of the program continued in subsequent years both in rural and urban areas.
An experimental evaluation of the program was conducted during this phase of geo-graphical expansion in rural areas. A random sample of 506 villages was drawn from a set of program-eligible localities situated in seven central states of Mexico (Guerrero, Hidalgo, Queretaro, Michoacan, Puebla, San Luis de Potosi, and Veracruz). From those villages, 320 localities were randomly assigned to the treatment group and started receiving the program’s benefits in March–April 1998; the remaining 186 formed the control group and were thus prevented from receiving the program’s benefits until November 1999.
2.2
Partial take-up
Importantly for our purposes, the two transfer components are unbundled. Households declared eligible to receive benefits can take up food stipends, scholarships, or both. They can also choose to receive the scholarships for some but not all of their eligible children. Beyond transfer amounts, take-up decisions largely depend on the tightness of the conditions attached to each grant component. While nominally conditional, a substantial fraction of the transfers is de facto unconditional. In particular, the conditions attached to the food stipends and scholarships for primary school children do not seem to incur a high cost to households, because school enrollment at that level is almost 100 percent. We used data from the administration of the program on the distribution of the different transfers in the 320 treatment localities of the evaluation to document take-up. This data confirms the complete take-up of the food stipends: at the end of 1998 and 1999, respectively 97.1 and 98.0 percent of eligible households in those localities received the transfers.
In contrast, the conditionality of the scholarships at the secondary level is binding for many households whose eligible school-age children would not have gone to school in the absence of the program. The same data indicates that respectively 83.0 and 91.3 percent of households eligible to a scholarship for at least one child enrolled at the primary or secondary level receive one. But only 63.7 percent of kids who are eligible for a scholarship for secondary-level school do attend school in 1998, and 61.9 percent of them do in 1999.
Hence, partial take-up of the program benefits is prevalent in this setting, whereby some eligible households comply with the food stipend conditions but refrain from enrolling some or all of their children in secondary schools. However, once they are incorporated into the
program, recipients can further adjust their behaviors by enrolling some of their program-eligible children. While take-up of the food transfers is almost complete, there is thus a margin for increasing the take-up of the schooling component, which can be seen as an intensive margin of program participation.
2.3
Village Neighborhoods
In this paper, we use the term of ’neighborhood’ for areas within a given radius around each evaluation village. We borrow this terminology from a literature based mainly on urban data, but in our contexts, ’neighborhood’ means areas or clusters of villages.
In order to characterize the local densities of the intervention (in the neighborhoods), we combine information from the program administration, indicating which localities were eligible for the program at the end of 1998 and 1999, with information from the 2000 popula-tion census and the annual school census. The populapopula-tion census provides the geographical coordinates (latitudes and longitudes) for the universe of rural localities, and the school cen-sus the coordinates of all secondary schools. The geo-referenced data further allows us to identify the locations of the evaluation localities.6
As in many rural regions of Latin America and elsewhere, the topography of the area covered by the program consists of clusters of villages with a quasi-continuum of dwellings, rather than isolated villages. On average, there are 22 localities with an overall population of roughly 6,400 inhabitants within an area defined by a 5 km radius from each evaluation village. This proximity favors the interactions between inhabitants of neighboring villages.
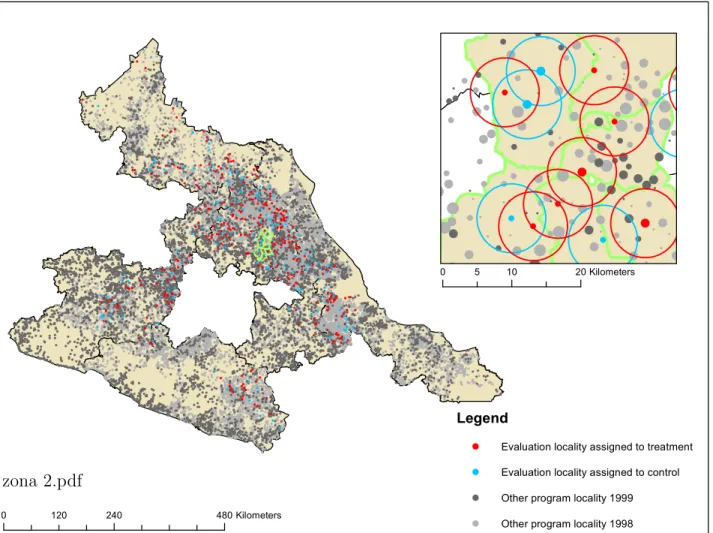
Turning now to the intervention, Figure 1 depicts the geographic scope of the Progresa penetration during the first two years of program roll-out in the seven central states where the evaluation took place. The rural localities targeted by the program in 1998 and 1999 are shown in light and dark grey respectively, while treatment and control localities are reported in red and blue. In order to provide a more in-depth depiction of the areas surrounding evaluation villages, the map features a smaller-scale view of a region in the State of Michoacan in which circles of 5 km radius are drawn around each evaluation village.
Both maps reveal that beneficiary and evaluation villages tend to be geographically clus-tered – with more deprived areas featuring higher program density. Those patterns are
6
We used official information on the listing of the universe of rural localities receiving the program (broken down by each program component) at the closing of each fiscal year in 1998 and 1999 to verify which localities were receiving the program in late 1998 and 1999. A fraction (about 20 percent) of control localities started receiving the program’s food stipends by November 1999, but none of those villages had received any scholarship by that date. We thus continue to treat those observations as belonging to the control group in November 1999.
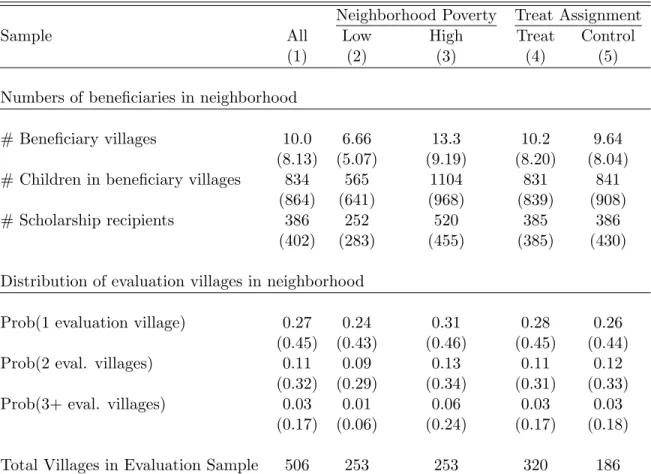
confirmed by descriptive statistics of the areas surrounding the evaluation sample, which are shown in Table 1. By the end of 1998, there are on average 10 program-beneficiary localities within a neighborhood defined by a 5 km radius around each evaluation village. Those localities have an average total population of 834 children aged 6 to 14, out of which in average 386 (46 percent) receive scholarships from Progresa (column 1).7 Moreover, several evaluation villages are indeed located very close together. Of the 506 evaluation localities, 139 (27 percent) have another evaluation locality within 5 km, 57 (11 percent) have two such localities, and 16 (3 percent) have three or more. Thus 212 (41 percent) villages in the experiment have other evaluation villages in a 5 km radius; our empirical analysis will iden-tify the effects of cross-village externalities for these villages. The density of the program, as captured by the numbers of both non-evaluation and evaluation beneficiary villages, roughly doubles in areas with more marginalized localities (columns 2–3). This is consistent with the targeting design of the Progresa intervention discussed above. In addition, as expected by the village-level random program assignment among the evaluation localities, there are virtually no differences in the density of the program between neighborhoods with treated or control centroids (columns 4–5).
Moreover, basic education and health infrastructures serve areas that comprise several neighboring villages. For instance, only 14 percent of the villages in the evaluation sample have a health clinic. Yet, 68 percent have access to such a facility within 5 km. Similarly, most localities do not have a junior secondary school – only 17 percent do in the evaluation sample – while 93 percent have access to one or more in other villages within 5 km. Hence, households from different program localities located in the same area can interact when utilizing social infrastructure. Furthermore, some operations which are specific to the program are also organized in conjunction for several neighboring villages. This is notably the case of the distribution of transfers in temporary and mobile outposts – located in hub localities – which serve an additional function to assist beneficiaries and disseminate information on the program. Hence, program beneficiaries from different neighboring villages can interact in a number of places.
7
Evaluation villages tend to be less populated than non-evaluation villages (average total population in the two groups is 258 and 338, respectively) while the marginalization index is on average very similar (4.66 vs. 4.72, respectively). Accordingly, there are on average slightly more scholarship recipients in non-evaluation villages (49.2) than in non-evaluation villages (34.5).
2.4
Sample Description
We combine the geo-referenced locality data mentioned above with three of the five rounds of the evaluation survey, collected in October 1997 (from the baseline targeting ENCASEH survey), October 1998 (second round of the ENCEL evaluation surveys), and November 1999 (fourth round of the ENCEL surveys).8 The resulting dataset contains detailed information on the outcomes of children and socioeconomic characteristics of a panel of households that reside in the evaluation localities.
The evaluation survey was intended to cover all the inhabitants of the localities under study. However, a small share of the population was not interviewed at baseline, and there were some changes in the village populations, so the total number of households observed in the data is 24,077 in October 1997, 25,846 in October 1998, and 26,972 in November 1999. Some attrition occurred, due in part to migration out of the villages, and in part to errors in identification codes that occurred for a few enumerators: 8.4 percent of the 1997 households cannot be followed and matched in all three rounds of the survey. Yet, this is unrelated to the treatment assignment.
At baseline (October 1997), 60 percent of the households in evaluation localities were classified as eligible to receive program benefits. In this paper, we study the schooling de-cisions of the children of those eligible households.9 Our main outcome of interest is school enrollment, for which we also use the term “school participation” interchangeably. It is the answer to the question Does the child currently attend school? which tracks information regarding both enrollment and overall attendance in school (but not regular attendance). Primary school enrollment is almost universal in rural Mexico, while secondary school en-rollment is the most problematic area for school attainment and also the grade levels where Progresa has had its greatest impact among eligible children (Schultz (2004)). We thus re-strict our attention to the enrollment decisions of children who, at baseline, are aged less than 18 and have either completed grades 5 or 6 of primary school or the first grade of secondary school.10 We also restrict to a balanced panel of children observed at all rounds.
The sample contains 6,690 children who are making the transition from primary to sec-ondary school, remaining in secsec-ondary or dropping out of school during the academic years 1998–1999 and 1999–2000. For 807 (12.6 percent) of those, no information was collected on
8
We have discarded the March 1998 and June 1999 rounds of the survey because we only have information on the roll-out of the program at the end of each year.
9
About 12 percent of the households were classified as non-poor at baseline but were later reclassified as eligible. To avoid arbitrary classifications, we exclude those households from our analysis.
10
The sample selection cannot be based on the grade during the follow-up period because that grade is potentially affected by the treatment.
either school participation or parental education, thereby leaving us with a final sample of 5,883 children observed in both 1998 and 1999. At baseline, the average enrollment rate is 63.8 percent (59.3 percent for girls and 68.5 percent for boys).
3
Program Externalities Across Villages
3.1
Empirical Strategy
Our identification strategy exploits two features of the program evaluation design: the prox-imity between many evaluation villages and village-level random assignment to treatment. Its key intuition is that, after conditioning on the number of neighboring evaluation local-ities, the parceling of those assigned to the treatment and control groups is random. This enables us to identify the effects of the variations in the density of the treatment, induced by the randomized evaluation, on schooling decisions at any given distance from each village.
Again, neighborhoods are defined as concentric circles around each evaluation village using geodesic distances d as the radius.11 Program treatment T
j is administered at the village level. It is randomly assigned only within the subset of 506 villages which participated to the evaluation of the program, so that not all beneficiary villages participated to the evaluation. Let then NB
j,d,t = Nj,d,tT + Nj,d,tN E denote the total number of program beneficiary villages situated at distance d from evaluation village j in a given post-treatment period t. Among those, NT
j,d,t is the number of evaluation villages which are randomly assigned to the treatment group of the evaluation and NN E
j,d,t the number of other neighboring (non-evaluation) villages which are targeted by the intervention during each post-treatment period t. Now let NP
j,d,t = Nj,d,tT + Nj,d,tC + Nj,d,tN E denote the number of potential program villages situated at distance d from village j in a given post-treatment period t, where we have added Nj,d,tC , the number of villages assigned to the control group of the evaluation.
As an alternative measure of program density, we use the numbers of households in neighboring villages receiving the food stipends. This definition takes into account the process of program targeting within villages and hence provides a more accurate measure of local treatment density and the extent of potential interactions with beneficiaries in the neighborhood. As the take-up of the food component of the program is virtually complete (reaching 97–98 percent), this variable is not endogenous to externalities that affect school
11
Due to data limitation, we do not take into account the local geography (natural obstacles or communi-cation axes such as mountains, rivers, or valleys) or transportation networks. This restriction can potentially introduce some measurement error in neighborhood characteristics and generate some attenuation biases in our estimates.
participation.
To estimate the effects of spatial externalities on school participation, we use the following linear regression model:
Yi,j,t = α1Tj+ α2Nj,d,tB + α3N P
j,d,t + α′4Xi,j,d+ ǫi,j,d,t, (1)
where Yi,j,t is a dummy indicating that program-eligible child i in evaluation village j in a given post-treatment period t is going to school, Tj is the randomly assigned treatment indicator which denotes whether locality j receives the program, Xi,j,d is a column-vector of baseline characteristics at the individual, household, village and neighborhood level, and ǫi,j,d,t captures other unobservable determinants of the school participation decision which are potentially correlated with the program’s targeting.
In this framework, the parameter α1 captures the sum of the average direct effect of program eligibility and the average indirect effects which stem from treatment of other individuals in the same village. Due to the fact that program treatment status varies at the village level, it is not possible to separately identify these two effects.12 The main parameter of interest is α2, which captures the marginal effect of treatment of one additional village (or eligible households) in the neighborhood. Finally, the parameter α3 captures the effects of any unobserved determinant of the school participation decision which is correlated with the program geographic targeting.
The identification challenge is that more marginalized regions tend to have higher treat-ment density (see Table 1), and there are a variety of other unobserved factors associated with the geographic roll-out of the intervention which are also likely to affect program outcomes. The random program assignment within the subset of evaluation villages provides some exogenous variation for the local density of treatment in the neighborhood of a subset of evaluation villages, the ones that have other evaluation villages nearby. More specifically, conditional on NP
j,d,t, cross-neighborhood variations in the local density of the program are solely determined by the random allocation to the treatment and control groups, and they are thus orthogonal to any determinant of individual outcomes. Hence, conditionally on the targeted treatment density in the neighborhood NP
j,d,t, the potential schooling outcomes of child i with treatment T = 0, 1 (in village j at time t) yT
i,j,t are independent of actual
12
A partial population approach, exploiting the presence of ineligible households in beneficiary villages, can be followed, and it has been by previous studies. It however requires some assumptions, notably that spillovers affect both eligible and ineligible individuals, and is thus not well-suited for investigating spillovers on the take-up of program components.
treatment density NB j,d,t
E[yi,j,t|Nj,d,tB , N P
j,d,t] = E[yi,j,t|Nj,d,tP ]. (2) Moreover this conditional independence assumption holds whatever the treatment status Tj of village j.
A few remarks are in order. First, as program targeting is partly correlated with local poverty, we expect the estimate of α3 to be biased downward. However, the bias on that parameter is orthogonal to both the Tj and Nj,d,tB terms and hence it does not contaminate the estimates of the α1 and α2 parameters. Second, as already mentioned, the parameter α2 is estimated for the set of eligible households of the controlled experiment which have other evaluation villages in the neighborhood of radius d. Third, this parameter captures the effects of neighboring evaluation villages that are randomly assigned to the program. It does not necessarily extend to other program beneficiary localities which are located nearby the villages in our sample.
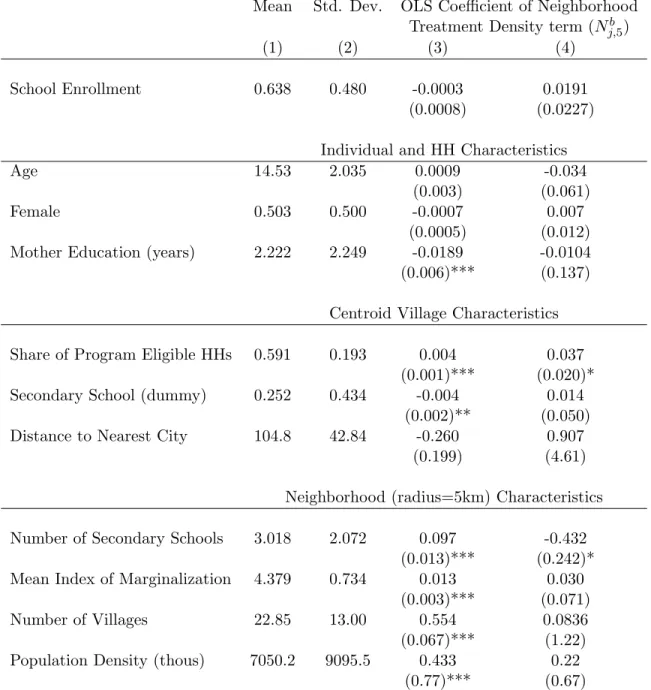
As a validation test of the condition (2), we use data from the baseline collected in October 1997 on children’s school participation as well as the full set of covariates that we employ in the empirical analysis, and estimate equation (1) using those baseline characteristics as outcomes. Table 2 reports the means and standard deviations for those variables (columns 1–2) along with the associated OLS coefficients of the neighborhood treatment density term (NB
j,t). In column 3, we display the unconditional marginal effects which reveal the presence of systematic differences in observable characteristics across neighborhoods with different degrees of program density. Consistently with the targeting design of the program, treatment density correlates positively both with the level of deprivation in the centroid village and with the density of villages/population in the neighborhood. However, as reported in column 4, those differences tend to fade out once we further control for the potential treatment density in the neighborhood (NP
j,t).13
The inclusion of the controls Xi,j,d in equation (1) is meant to increase the precision of the estimates. The controls are all measured at baseline using the 1997 data to avoid any endogeneity concern and, taking advantage of the panel dimension of the data, include in particular baseline school enrollment Yi,j,t0=1997. The remaining controls are for: child’s gender and age (both in levels and squares), parental education, distance to the nearest city, the share of eligible households and the presence of a secondary school in the locality, total
13
Two of those baseline variables (the share of eligible households and the number of secondary schools) remain marginally statistically associated (at the 10 percent confidence level) with the density of the program. For consistency with our main estimates we estimate those placebo regressions using a 5 km radius (d = 5). Results (available upon request) are very similar when considering alternative radiuses.
population in the locality, the number of localities, total population and the mean degree of marginalization in the neighborhood. We also control for state and time dummies.
To account for the fact that evaluation villages may belong to multiple neighborhoods, we cluster standard errors for groups of partially overlapping neighborhoods. Those groups are defined as sets of evaluation villages such that each village lies within the radius-based neighborhood of another village of the set. Intuitively, as soon as an evaluation village belongs to two radius-based neighborhoods, those two neighborhoods will belong to the same cluster. This allows for correlations beyond single radiuses. In the empirical analysis, our preferred specification uses a 5 km radius but we also use radiuses of 10 and 20 km. Considering a larger radius leads to a smaller number of clusters. In particular, the 506 villages in the experiment belong to 358 clusters of partially overlapping 5 km neighborhoods – the 320 treatment villages belong to 249 such clusters – and this number reduces to 180 when considering clusters formed by overlapping 10 km neighborhoods, and 45 with 20 km ones.
The next step is to investigate whether spatial externalities arise from interactions that involve only program beneficiaries or from more general externalities of treatment density, such as social interactions within preexisting networks (e.g., extended families), or changes in local markets (e.g., access to credit) and in the supply of public goods (e.g., learning conditions in local schools). We argue that, while such general externalities are likely to affect households and children of both treatment and control localities, indirect effects restricted to treatment villages and eligible households should reveal interactions between beneficiaries.
In equation (1), local treatment density is orthogonal to village-level treatment, so that the indirect effect of the program can be identified for both treatment and control group villages. This feature of our empirical framework allows us to disentangle whether spatial externalities extend to the entire population or affect exclusively the outcomes of children and families who are included in the program. We thus consider the following variant of equation (1):
Yi,j,t = β1Tj + β2Nj,d,tB + β3[Tj × Nj,d,tB ] + β4Nj,d,tp + β5[Tj × Nj,d,tP ] + Xi,j,d,t0β6+ ui,j,d,t, (3)
where the village-level treatment assignment term (Tj) is interacted with the density of both actual (NB
j,d,t) and potential (Nj,d,tP ) neighboring beneficiary localities so that the effects of cross-village externalities are identified separately for the control and treatment groups. This specification allows to test whether program externalities differentially vary with treatment assignment (β3 6= 0).
3.2
Empirical Evidence
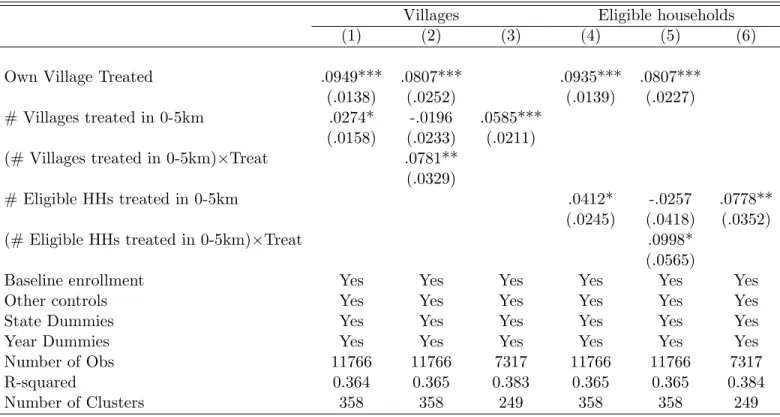
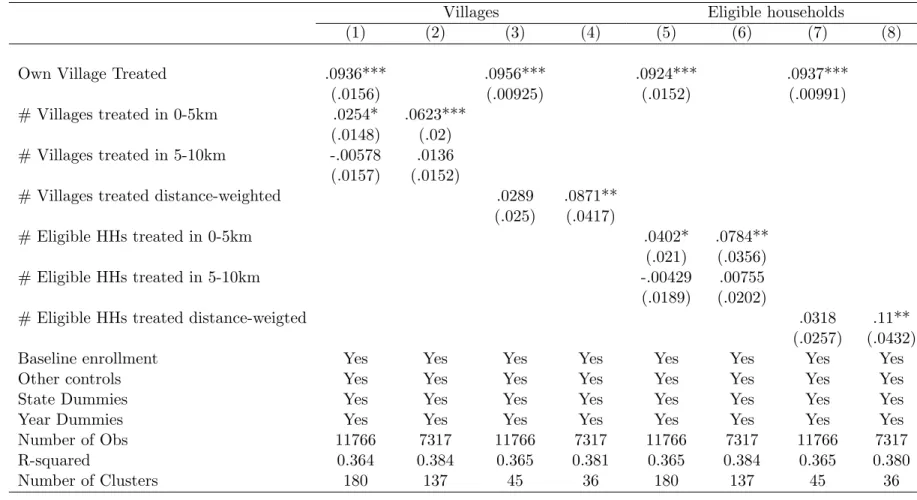
Table 3 reports the OLS estimates of the model in equation (1) for the effects of spatial spillovers of the program on eligible children’s school participation decisions. The estimates are obtained using the data for the post-treatment period (October 1998 and November 1999). We report only the estimates of the parameters α1 and α2, but, as discussed above, the regressions control for baseline characteristics observed in October 1997, notably baseline school enrollment. The estimates are obtained with two alternative measures of program density in neighborhoods of evaluation villages: the models in columns 1–3 use the numbers of villages treated in a 5 km radius, while the ones in columns 4–6 use instead the numbers of eligible households within the same radius. Columns 1 and 4 report the estimates for the baseline model in equation (1). In order to document the heterogeneity of cross-village externalities by treatment status, columns 2 and 5 report OLS estimates of the augmented model specified in equation (3) and columns 3 and 6 estimates of the model in equation (1) obtained after restricting the sample to the treatment group.14
Beginning with the results obtained when measuring program density by the numbers of villages, column 1 indicates that, when considering the entire sample of children in treatment and control villages, while living in a treated community increases school participation by 9.5 percentage points, having an additional treated village within a 5 km radius further increases enrollment rates by 2.7 percentage points (this spillover effect is statistically significant at 10 percent). The former own-village treatment effect is in line with the results obtained in previous studies (e.g. Schultz (2004)). Program externalities appear to matter only for children who live in treatment group localities. Column 2 indeed shows no evidence of spillovers affecting school enrollment of children in control villages (the parameter for the main effect of program density has a negative point estimate and it is not statistically significant), but evidence of strong spillovers on the treatment group. The point estimate for the differential effect of spillovers in treatment villages as compared to control villages (given by the parameter for the interaction term β3 in equation (3)) reaches 7.8 percentage points, and this estimated differential effect is statistically significant at the 5 percent level.15 Note that, when we introduce the effects of spatial spillovers, the relative OLS coefficient of the village-level treatment assignment term (β1) decreases to 8 percentage points, thereby revealing that a small part of the program effects are partly driven by differential cross-village
14
We also ran probit estimates of the same models and obtained very similar estimates of the effects of spillovers – the results are available upon request.
15
We tested for non-linear effects of spillovers in the control villages but found no evidence of such effects (the corresponding estimates are available from the authors).
externalities in the treatment group. The finding of spillovers restricted to the control group is confirmed by the estimates in column 3, on the sample to the treatment group: the effect on school enrollment of having an additional treated village within a 5 km radius is estimated at 5.8 percentage points, and it is again statistically significant at the 5 percent level.
The specifications which use the numbers of eligible households for measuring program density give similar results. The numbers of eligible households (in beneficiary, evaluation and treatment villages), the main explanatory variables, are normalized by 100. Column 4 of Table 3 indicates that having an additional 100 of such eligible households in a 5 km radius increases school participation by 4.1 percentage points (and again this result is statistically significant at 10 percent). Columns 5 and 6 confirm the finding of spillovers affecting exclusively children in treatment villages. When restricting to that sample, an additional hundred eligible households in the neighborhood is estimated to increase school participation by 7.8 percentage points and this effect is statistically significant at 5 percent. In order to better gauge the magnitude of the spillovers we estimated, note that treatment group villages have in average .4 other treatment group villages in a 5 km radius, and so the 5.8 percentage point spillover effect reported in column 3 of Table 3 translates into an average spillover effect of about 2.4 percentage points increase in secondary-school enrollment. This roughly corresponds to one fourth of the direct effect of the program. Similarly, the treatment group sample has in average 17.9 other eligible families in neighboring treatment villages, so that extrapolating the 7.8 percentage point estimate of spillovers per hundred eligible households (in column 6 of Table 3) leads to a 1.4 percentage point increase in secondary school participation.
Extrapolating the marginal effects we identified to the total number of beneficiary vil-lages or eligible households in the neighborhoods of evaluation vilvil-lages would indicate an implausibly large effect of more than 50 percentage points. One should be careful, though, when interpreting those results as our estimates exploit the variations generated by the ran-domized evaluation, so in principle they cannot be extrapolated to recover the total spillover effects generated by the entire set of program beneficiaries in the neighborhood. Although we don’t have evidence of this, it is possible that program participants in neighboring evalua-tion villages interacted more or in different ways than those in other neighboring beneficiary villages.
For investigating whether spillovers operate over relatively short or larger distances, Table 4 reports the OLS estimates of the model in equation (1) using measures of program density in neighborhoods covering larger distances than 5 km around. Those estimates are also
obtained using the two measures of program density, the numbers of villages (columns 1–4) and eligible households (columns 5–8). Columns 1 and 5 use the same baseline specification as columns 1 and 4 of Table 3 with the entire sample. Columns 2 and 6 use the restricted sample of children in treated villages (as columns 3 and 6 of Table 3). For the estimates in columns 3, 4, 7 and 8, we measure program density over a 20 km radius and weight the observations in each village by the inverse of the distance to the centroid. Now, as those are defined as the set of villages within a given distance to at least another village in the set, the number of clusters decreases in those estimates as we increase the size of the neighborhoods: with 10 km radiuses, we have 180 clusters for the entire sample and 137 for the sample of treatment villages, and with 20 km radiuses the numbers of clusters fall to 45 and 36. Otherwise, these specifications are estimated using the same data and include the same control variables as the ones in Table 3. The estimated coefficient for the numbers of treated villages located at a distance between 5 and 10 km is small and statistically insignificant. This suggests the presence of a strong decay rate in spatial externalities. However, the specifications using the distance-weighted density measures computed over the 20 km radius confirm the presence of positive spillovers on school participation in treatment group localities. The estimates are statistically significant at 5 percent level, consistently with the results presented in Table 3. Overall, these results indicate that spillovers operate over relatively short distances. Since we find no evidence of spillovers of beneficiaries over larger distances, in the rest of the analysis we restrict to those operating over 0 to 5 km.
4
Further Evidence
We now use additional information gathered from both program operational surveys and administrative sources in order to shed some light on the interpretation behind the patterns uncovered in Section 3. The finding of spillovers on school enrollment operating over short distances supports a simple model of peer effects on program take-up decisions of eligible households.16 As we don’t have measures of the occurrences of interactions of beneficiaries from different neighboring villages, we cannot report direct evidence of this. We hence conduct several indirect checks for the presence of such interactions. On the other hand, some spatial variations in the local implementation of the program could also a priori explain the observed relationship between the local density of the treatment and program impacts.
16
Non-market interactions may affect take-up decisions through two channels: information and social norms. While conceptually different, those two forms of social behaviors can hardly be distinguished empir-ically. We thus broadly refer to the influence of others on individual responses as peer effects.
We also test for the presence of such spatial variations in implementation.
4.1
Peer Effects among Program Participants
In spite of the emphasis placed on informing the potential participants about the objectives, design and requirements of the intervention, concerns have been expressed by those involved in the initial phases of the implementation regarding the effectiveness of the diffusion of information about the program among targeted households (Adato et al., 2000). To further corroborate this anecdotal evidence, we use information from an operational follow-up survey conducted among eligible households in the evaluation treatment-group villages in May 1999 (i.e., 14 months after the inception of the program). Program beneficiaries were asked to identify three sets of benefits distributed by Progresa: (i) scholarships and school supplies, (ii) food stipends and nutritional supplements, and (iii) preventive health care and health check-ups. Most of the respondents were the mothers who were to receive the transfers. While 98 percent of the respondents were able to spontaneously and correctly mention the nutrition component, only 60 percent correctly identified both the health and education components. Knowledge of the program components was thus incomplete in treatment villages at that time.
In such a context of sparse and coarse knowledge about the benefits of the intervention, information-sharing among potential beneficiaries is likely to have played a role, notably among women who are the primary recipients of the transfers and regularly encounter each other during program operations. When asked, in the same operational follow-up survey, to mention the most significant changes in their communities, half of the beneficiaries report that the program had increased the degree of cooperation among women.
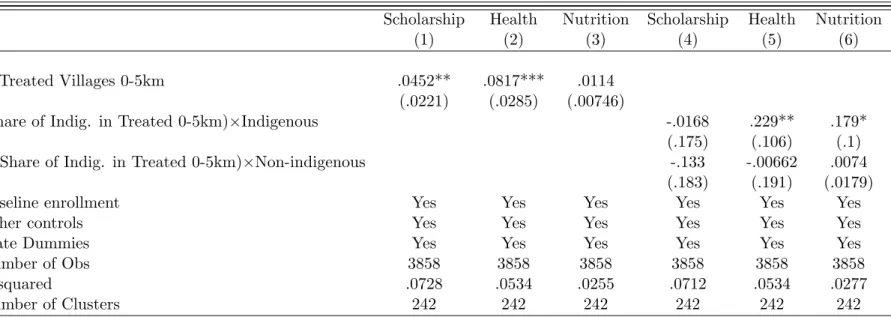
For further evidence on this, we estimate the effects of spatial spillovers on those measures of eligible households’ knowledge of the different program components. Table 5 reports the estimates, which are obtained using the model in equation (1) estimated on the October 1998 data. Having one additional neighboring program village increases by respectively 4.5 and 8.2 percentage points the shares of eligible households who are aware of the education and health components (column 1 and 2), but has no significant effects on the share of those aware of the nutritional component (column 3). This suggests that spatial spillovers result in a better knowledge of the educational and health components.
Given the evidence of program externalities on school participation decisions presented in Section 3, the variations of the knowledge of the education component could reflect increases in school attendance rather than the presence of peer effects among potential beneficiaries.
Yet, the observed increase in the knowledge indicators of the other program components (such as health benefits) makes it difficult to interpret this evidence as purely stemming from corresponding variations in school enrollment among program-eligible children.
To further test the presence of social interactions, we then examine the heterogeneities in the effects of program density associated with belonging to specific social networks of individuals living in the same areas. More specifically, we examine whether spatial spillovers are stronger within networks of households from the same ethnolinguistic groups. For this purpose, we define a proxy of ethnic affiliation according to whether or not the household head speaks only an indigenous language, and construct the relative shares of indigenous and non-indigenous program-eligible households in nearby villages. Columns 4–6 of Table 5 report evidence of such heterogeneity in the effects of spillovers on the knowledge of the health and nutrition components associated with those ethnolinguistic groups at the neighborhood level.17
The results reported in Table 5 provide suggestive evidence that social interactions and information-sharing on the program components, among eligible households, are driving at least partially the spatial spillovers we observe. Spatial spillovers are associated with improved knowledge of the components of the program, and those effects increase when the other beneficiaries in neighboring villages belong to the same linguistic groups, a factor that should facilitate social interactions.
4.2
Supply-side Effects
Areas with higher densities of program participants might have benefited from more efficient program operations, or from improvements in the supply of education or health services, thereby helping some eligible households to comply with the schooling requirements of the program. A related alternative explanation is that the implementation of the program may have been more efficient when the number of evaluation treatment group villages in the neighborhood (rather than the total number of beneficiaries) was higher. While both notions of implementation scale gains seem a priori reasonable, we argue that they are unlikely to explain our results.
To examine the presence of differences in implementation and supply, two preliminary points should be noted. First, any variation in program delivery in a given geographic area should benefit evenly those program recipients who reside in it. This is at odds with the
17
In our sample, 7.3 percent of households are reported being indigenous. We don’t have information on the specific indigenous group to which each household belongs to and hence this measure is clearly a coarse indicator of ethnic affiliation.
evidence reported in column 1 of Table 3, that program externalities appear spatially con-centrated within relatively small areas surrounding the evaluation villages. According to this line of thought, supply changes would likely affect the enrollment decisions of both recipients and non-recipients, an idea difficult to reconcile with the evidence of heterogeneous exter-nalities reported in column 2 of Table 3. Similarly, if cross-village exterexter-nalities were driven by supply-side factors, we should not observe any systematic difference across characteris-tics that are predictors of social interactions among potential participants without altering the local scale of the program. Yet, the evidence presented above (see Table 5) suggests that cross-village externalities appear to vary according to the ethnic composition of village neighborhoods. These arguments apply to implementation variations that could be either associated with the density of all beneficiaries or treatment density within the evaluation sample.
Second, we identify spatial spillovers using only the variation in program density gener-ated by the randomized experiment. This variation is small compared to the overall scale of the program (as seen in Table 1, in a given 5 km radius there are on average 10 beneficiary vil-lages, but only 0.6 evaluation vilvil-lages, among which 0.4 are assigned to the treatment group and 0.2 to the control group). Program density is thus not very different around villages which have more treatment-group villages than around those which have more control-group villages in their neighborhood, and the resulting infra-marginal changes in the scale of the program are unlikely to trigger any supply-side efficiency gain.
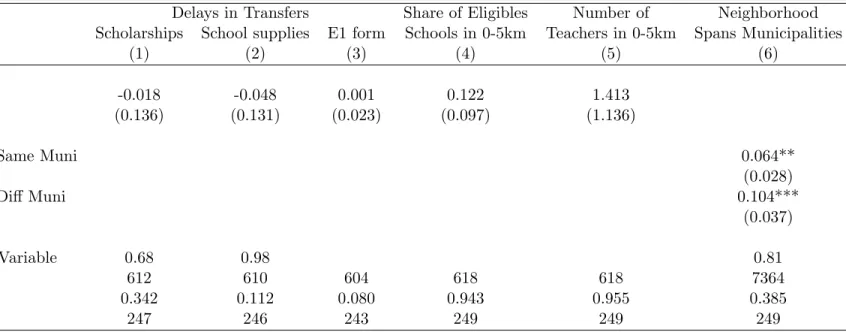
We next run a battery of complementary tests aimed at detecting the presence of supply-side responses associated with experimental variations in the density of treatment in the areas surrounding evaluation villages. We begin with measures of implementation efficiency. According to qualitative interviews with beneficiaries, local program staff, school teachers and health staff (see Adato et al., 2000), one major source of inefficiency in program de-livery was the observed delays in the dede-livery of the form for school attendance monitoring (E1 form) and the associated delays in the payment of scholarships. We use program ad-ministrative data on the monetary transfers delivered to eligible households to compute the number of months since incorporation after which the first disbursements were made to the localities assigned to the treatment group. While food stipends were distributed to all vil-lages assigned to the treatment group at the same time in March 1998, only 56 percent of the those localities received the first scholarship transfer in March 1998; 36 percent received them two months later, and the remaining 8 percent six months or more after incorporation into the program. Furthermore, we use information from the operational follow-up survey
on whether program recipients received the E1 form or not. As of May 1999, 24 percent of beneficiaries report not having received it. The effects of treatment density are obtained using the baseline model of equation 1 for the sample of both treatment and control villages. As documented in columns 1–3 of Table 6, this variation in program implementation seems unrelated to our measure of treatment density in the areas surrounding evaluation villages.18 We then turn to the provision of local health and education services. The funding of those services is independent of the program’s budget: funds are transferred from the federal government to local municipalities through separate channels.19 We directly test for the presence of any effects of treatment density on the delivery of education services. Columns 4–5 of Table 6 display the resulting estimates, obtained using the same model and sample as before, for the relative density of schools and teachers located within 5 km from each evaluation village during the post-intervention period (1998–1999). None of those factors seem related to our measure of treatment density.
We can then run one further indirect test. Because of the constraints due to the coor-dination of the program supply-side responses among several municipalities, the supply of education and health services should vary less with local treatment density in the neigh-borhood when it extends over several municipalities. Hence, if present, the effects of local supply improvements should be weaker in areas that cross municipalities. To check this, we split village neighborhoods according to whether or not they cross some municipal boundary, and estimate treatment externalities on school participation in the two cases. As shown in column 6 of Table 6, the program externalities do not seem to vary systematically along this dimension. If anything, they seem larger for those village neighborhoods which share an administrative border – although the difference between the two OLS coefficients is not statistically significant.
While each piece of evidence presented above may not be sufficient to rule out the presence of the effects of program implementation or the supply of social services, together they make it difficult to interpret our findings as solely driven by such variations.
18
Those administrative delays appear concentrated in some regions, and notably in the States of Queretaro and San Luis Potosi. As a further check, we have re-estimated equation 1 without those two states. Results (available upon request) are very similar to those reported in Table 3.
19
The federal government also provides health services in marginalized rural communities though the Social Security Institute (IMSS). Yet, the bulk of educational and health services are provided by local governments (Levy, 2006).
5
Conclusion
We have examined the Progresa-Oportunidades conditional cash transfer program to see whether take-up of one aspect of the program is influenced by the presence of other bene-ficiaries in areas comprising several villages. We found evidence of large positive spillovers within networks of beneficiaries spanning those areas. Higher local densities of program beneficiaries increase the take up of the scholarships for secondary schooling offered by the program and, accordingly, school enrollment at that level. In contrast, these effects do not affect the schooling decisions of households in the control group villages that were not yet incorporated to the program.
Our estimates indicate that the effect of an additional treatment group village in a 5 km neighborhood is to increase by 5.8 percentage points secondary school enrollment of program-eligible children in treated villages, which compares to a direct effect of own-village treatment of 9.5 percentage points. These findings suggest the presence of neighborhood effects on the take-up of the schooling component by households who already benefit some component of the program, notably the cash transfers for food.
To better understand our findings, we tested and found suggestive evidence for the pres-ence of information-sharing among program-eligible households. While we could not directly test for the presence of social interactions, we found that higher treatment densities in the areas are associated with increased knowledge among eligible households about the schooling and health components of the program. We also found that spillovers occur predominantly within neighborhood-level networks of beneficiaries that are homogeneous in ethnic com-position, a factor that facilitates cross-village interactions. We also tested the alternative hypothesis that the effects we captured reflect heterogeneities in direct treatment impacts due to spatial variations in the implementation of the program. The evidence that we have presented tends to reject this explanation.
Neighborhood effects on program take-up have implications for the design and implemen-tation of social policies in developing countries. The power of the effect suggests that there can be large gains from the spatial concentration of an intervention’s target population, as local networks of potential beneficiaries can accelerate the take-up of the proposed benefits. Neighborhood effects also have implications for the evaluation of social policy interventions, notably in settings where a program is implemented over an extended area and treatment density is high. In particular, capturing those effects across villages so as to recover impact evaluation parameters that incorporate spillovers, will require analyzing the impacts of the program at the level of relatively large geographical areas. Of course, the feasibility of that
option will depend on the scale of the program that is being evaluated, and statistical power needs to be controlled as well. These considerations will be important in particular for eval-uations conducted as the interventions are being scaled up on a large scale, a setting which differs from the evaluation of small pilot programs.
References
Adato, M., D. Coady, and M. Ruel(2000): “An operations evaluation of PROGRESA from the perspective of beneficiaries, promotoras, school directors, and health staff,” Tech. rep., International Food Policy Research Institute.
Aizer, A. and J. Currie (2004): “Networks or neighborhoods? Correlations in the use of publicly-funded maternity care in California,” Journal of Public Economics, 88, 2573– 2585.
Akerlof, G. A. (1997): “Social Distance and Social Decisions,” Econometrica, 65, 1005– 1028.
Angelucci, M. and G. De Giorgi (2009): “Indirect Effects of an Aid Program: How Do Cash Transfers Affect Ineligibles’ Consumption?” American Economic Review, 99, 486–508.
Angelucci, M., G. De Giorgi, M. A. Rangel, and I. Rasul (2010): “Family net-works and school enrollment: Evidence from a randomized social experiment,” Journal of Public Economics, 94, 197–221.
Angelucci, M., G. De Giorgi, and I. Rasul (2012): “Resource pooling within family networks: insurance and investment,” Unpublished paper.
Banerjee, A., E. Duflo, R. Glennerster, and K. Dhruva (2010): “Improving Immunization Coverage in Rural India: A Clustered Randomized Controlled Evaluation of Immunization Campaigns with and without Incentives,” BMJ, 340.
Bertrand, M., E. F. P. Luttmer, and S. Mullainathan (2000): “Network Effects And Welfare Cultures,” The Quarterly Journal of Economics, 115, 1019–1055.
Bobonis, G. J. and F. Finan (2009): “Neighborhood Peer Effects in Secondary School Enrollment Decisions,” Review of Economics and Statistics, 91, 695–716.
Crepon, B., E. Duflo, M. Gurgand, R. Rathelot, and P. Zamora (2013): “Do Labor Market Policies have Displacement Effects? Evidence from a Clustered Randomized Experiment,” The Quarterly Journal of Economics, 128, 531–580.
Daponte, B. O., S. Sanders, and L. Taylor(1999): “Why Do Low-Income Households not Use Food Stamps? Evidence from an Experiment,” Journal of Human Resources, 34, 612–628.
Duflo, E. and E. Saez (2003): “The Role Of Information And Social Interactions In Retirement Plan Decisions: Evidence From A Randomized Experiment,” The Quarterly Journal of Economics, 118, 815–842.
Fiszbein, A. and N. Schady (2009): Conditional Cash Transfers. Reducing Present and Future Poverty, The World Bank, Washington DC.
Gine, X. and G. Mansuri (2011): “Together we will : experimental evidence on female voting behavior in Pakistan,” Policy research working paper series, The World Bank.
Glewwe, P. and M. Kremer (2006): Schools, teachers, and education outcomes in de-veloping countries, Elsevier, vol. 2 of Handbook of the Economics of Education, chap. 16, 945–1017.
Ichino, N. and M. Schundeln (2012): “Deterring or Displacing Electoral Irregularities? Spillover Effects of Observers in a Randomized Field Experiment in Ghana,” The Journal of Politics, 74, 292–307.
Kuhn, P., P. Kooreman, A. Soetevent, and A. Kapteyn (2011): “The Effects of Lottery Prizes on Winners and Their Neighbors: Evidence from the Dutch Postcode Lottery,” American Economic Review, 101, 2226–47.
Lalive, R. and M. A. Cattaneo (2009): “Social Interactions and Schooling Decisions,” The Review of Economics and Statistics, 91, 457–477.
Levy, S. (2006): Progress Against Poverty. Sustaining Mexico ˜Os Progresa-Oportunidades Program, Brookings Institution Press, Washington D.C.
Miguel, E. and M. Kremer (2004): “Worms: Identifying Impacts on Education and Health in the Presence of Treatment Externalities,” Econometrica, 72, 159–217.
Moffitt, R. A.(2001): Policy Interventions, Low Level Equilibria, and Social Interactions, MIT Press, 45–82.
Parker, S. W., L. Rubalcava, and G. Teruel(2008): Evaluating Conditional School-ing and Health Programs, Elsevier, vol. 4 of Handbook of Development Economics, chap. 62, 3963–4035.
Schultz, T. (2004): “School Subsidies for the Poor: Evaluating the Mexican Progresa Poverty Program,” Journal of Development Economics, 74, 199–250.