HAL Id: hal-02621630
https://hal.inrae.fr/hal-02621630
Submitted on 26 May 2020
HAL is a multi-disciplinary open access
archive for the deposit and dissemination of
sci-entific research documents, whether they are
pub-lished or not. The documents may come from
teaching and research institutions in France or
abroad, or from public or private research centers.
L’archive ouverte pluridisciplinaire HAL, est
destinée au dépôt et à la diffusion de documents
scientifiques de niveau recherche, publiés ou non,
émanant des établissements d’enseignement et de
recherche français ou étrangers, des laboratoires
publics ou privés.
Distributed under a Creative Commons Attribution| 4.0 International License
Cloelia Dard-Dascot, Delphine Naquin, Yves d’Aubenton-Carafa, Karine Alix,
Claude Thermes, Erwin van Dijk
To cite this version:
Cloelia Dard-Dascot, Delphine Naquin, Yves d’Aubenton-Carafa, Karine Alix, Claude Thermes, et al..
Systematic comparison of small RNA library preparation protocols for next-generation sequencing.
BMC Genomics, BioMed Central, 2018, 19, pp.1-16. �10.1186/s12864-018-4491-6�. �hal-02621630�
M E T H O D O L O G Y A R T I C L E
Open Access
Systematic comparison of small RNA library
preparation protocols for next-generation
sequencing
Cloelia Dard-Dascot
1, Delphine Naquin
1, Yves d
’Aubenton-Carafa
1, Karine Alix
2, Claude Thermes
1and Erwin van Dijk
1*Abstract
Background: Next-generation sequencing technologies have revolutionized the study of small RNAs (sRNAs) on a genome-wide scale. However, classical sRNA library preparation methods introduce serious bias, mainly during adapter ligation steps. Several types of sRNA including plant microRNAs (miRNA), piwi-interacting RNAs (piRNA) in insects, nematodes and mammals, and small interfering RNAs (siRNA) in insects and plants contain a 2’-O-methyl (2’-OMe) modification at their 3′ terminal nucleotide. This inhibits 3′ adapter ligation and makes library preparation particularly challenging. To reduce bias, the NEBNext kit (New England Biolabs) uses polyethylene glycol (PEG), the NEXTflex V2 kit (BIOO Scientific) uses both randomised adapters and PEG, and the novel SMARTer (Clontech) and CATS (Diagenode) kits avoid ligation altogether. Here we compared these methods with Illumina’s classical TruSeq protocol regarding the detection of normal and 2’ OMe RNAs. In addition, we modified the TruSeq and NEXTflex protocols to identify conditions that improve performance.
Results: Among the five kits tested with their respective standard protocols, the SMARTer and CATS kits had the lowest levels of bias but also had a strong formation of side products, and as a result performed relatively poorly with biological samples; NEXTflex detected the largest numbers of different miRNAs. The use of a novel type of randomised adapters called MidRand-Like (MRL) adapters and PEG improved the detection of 2’ OMe RNAs both in the TruSeq as well as in the NEXTflex protocol.
Conclusions: While it is commonly accepted that biases in sRNA library preparation protocols are mainly due to adapter ligation steps, the ligation-free protocols were not the best performing methods. Our modified versions of the TruSeq and NEXTflex protocols provide an improved tool for the study of 2’ OMe RNAs.
Keywords: Small RNA, Bias, Library preparation, Next-generation sequencing, NGS, 2’-O-methyl RNA Background
Small RNAs (sRNAs) are known to play an important regulatory role in a wide range of organisms in many biological processes including embryo development, cell differentiation, growth/proliferation and apoptosis/cell death [1]. Eukaryotic regulatory sRNAs typically range in size from ~ 20 to 30 nt and the three major classes are microRNAs (miRNA), small interfering RNAs (siRNA) and piwi-interacting RNAs (piRNA). Altered miRNA
expression profiles have been implicated in a number of diseases [2], highlighting the importance of miRNAs in biology and the need for continued development of research tools for the study of sRNA in general.
Next-generation sequencing (NGS) is a powerful tool for the analysis of sRNAs. It has several advantages over microarray techniques or quantitative PCR (qPCR). It allows for the discovery of novel sRNAs, has a better sig-nal to noise ratio than microarrays and does not suffer of saturation effects. In addition, it allows for the detec-tion of single base differences and has a higher through-put than qPCR or Northern blotting. However, NGS approaches also have some disadvantages, such as the
* Correspondence:[email protected]
1Institute for Integrative Biology of the Cell, UMR9198, CNRS CEA Univ Paris-Sud,
Université Paris-Saclay, 9198 Gif sur Yvette Cedex, France Full list of author information is available at the end of the article
© The Author(s). 2018 Open Access This article is distributed under the terms of the Creative Commons Attribution 4.0 International License (http://creativecommons.org/licenses/by/4.0/), which permits unrestricted use, distribution, and reproduction in any medium, provided you give appropriate credit to the original author(s) and the source, provide a link to the Creative Commons license, and indicate if changes were made. The Creative Commons Public Domain Dedication waiver (http://creativecommons.org/publicdomain/zero/1.0/) applies to the data made available in this article, unless otherwise stated.
cost per sequencing run and the extensive processing steps required to convert a sample into a library for se-quencing. In a typical sRNA library preparation process, adapters are ligated to the RNAs followed by reverse transcription and PCR amplification. All these steps are potential sources of bias [3,4]. Consequently, read num-bers may not reflect actual sRNA expression levels and different sRNAs may be either over- or underrepre-sented in the library. Strongly underrepreunderrepre-sented sRNAs, especially when their actual expression levels are already low, may remain undetected. An additional problem arises with plant miRNAs, piRNAs in insects nematodes and mammals, and siRNAs in insects and plants in which the 3′ terminal nucleotide carries a 2’-O-methyl (2’ OMe) modification [1]. This modification strongly re-duces the efficiency of 3′ adapter ligation [5], thus mak-ing library preparation particularly challengmak-ing for these types of sRNA.
Several studies demonstrated that adapter ligation steps may cause serious bias, due to RNA sequence/ structure effects resulting in the preferential ligation of certain sRNAs with a given adapter sequence, while others are disfavoured [6–11]. We will refer to this type of bias as“sequence bias”. Randomisation of adapter se-quences close to the ligation junction would neutralize this effect and improve the fidelity of NGS results. Sore-fan and colleagues [7] used adapters with 4 random nu-cleotides at the ligation junctions and named these “High Definition” (HD) adapters. A more recent study revealed that the randomised region does not have to be adjacent to the ligation junction and in addition showed that the use of a 5′ adapter that has a region comple-mentary to the 3′ adapter can promote the formation of structures favourable for ligation [11]. This novel type of adapters was designated “MidRand” adapters. Together, these studies demonstrate that bias can be reduced through improved adapter design.
Instead of modifying the adapters, some other studies sought to suppress bias through the optimisation of re-action conditions. Several laboratories tested a
thermo-stable DNA/RNA ligase, ‘MthRnl’ from New England
Biolabs that works at 65 °C, a temperature at which short RNAs should be largely unstructured. Even though one study reported bias reduction by this enzyme [12], two others did not observe any effect [13,14]. Moreover, Song and collaborators tried ligation at 18 °C, 25 °C, or 37 °C with a truncated version of the classical RNA lig-ase 2, and best results were obtained at 25 °C [14]. In addition, these authors and Zhang et al. [12] found that polyethylene glycol (PEG), a macromolecular crowding agent known to increase ligation efficiency [15], led to a significant reduction of bias. Song and collaborators found an optimal capture efficiency at 15–25% PEG but, surprisingly, the optimal PEG concentration was not the
same for all miRNAs tested [14]. Based on these results, New England Biolabs (NEB) released the“NEBNext” kit, which uses PEG in the ligation reactions (in combination with classical Illumina adapters) and BIOO Scientific has released the “NEXTflex sRNA library preparation kit” that combines the use of HD adapters with PEG and is advertised as a kit with less bias than the traditional kits. However, all these results were obtained with unmodi-fied RNAs and do not necessarily extrapolate to 2’ OMe RNAs. One paper reported that the addition of 25% PEG restored ligation efficiency of a 2’-OMe modified sRNA to the level of the same RNA without modification [5]. However, it remains to be determined if PEG will restore the ligation efficiency of 2’-OMe RNA in a complex mix-ture where competition effects will occur. In addition, the effects of different adapters with- or without ran-domized regions on the representation of 2’-OMe RNAs in NGS libraries have not been examined.
Another concern for sRNA library preparation is the formation of side products such as adapter dimers. Cur-rently available library reparation kits either use strat-egies to eliminate excess 3′ adapter before 5′ adapter ligation, including purification steps or the use of com-plementary oligonucleotides that inactivate the 3′ adapter. Several alternative approaches have been devel-oped. For example, Shore et al. [16] developed a method in which the 5′ and 3′ adapters carry chemical modifica-tions that block dimer formation, while allowing for efficient ligation of the adapters with small RNAs. Alternative approaches use blocking oligonucleotides that are complementary to the adapter dimer ligation products [17] or the single stranded DNA-specific exonuclease RecJ to degrade non-ligated 3′ adapters [18].
Some protocols use polyadenylation instead of ligation for 3′ adapter addition. Multiple A residues are added to the 3′ end using poly(A) polymerase (PAP) [3]. Then, a 5′ adapter is ligated either directly to the RNA or to the nascent cDNA after reverse transcription. Novel sRNA library preparation kits from Clontech (SMARTer smRNA-seq) and Diagenode (CATS Small RNA-seq kit) even avoid adapter ligation altogether, as a 3′ adapter is added by polyadenylation and a 5′ adapter is added through reverse transcriptase template-switching. Thus, ligation bias is avoided. However, PAP can also be af-fected by RNA structures and 2’ OMe modifications can reduce the efficiency of polyA tailing [5]. It remains therefore to be seen if this method will perform better than the classical ligation-based approaches.
In this study, we systematically compared the classical TruSeq kit from Illumina with four commercially available ‘low bias’ kits, the NEBNext kit from NEB, the NEXTflex V2 kit from BIOO Scientific, the SMARTer kit from Clon-tech and the CATS kit from Diagenode. We tested the per-formance of these kits with regard to three parameters: (1)
bias among sequences, (2) bias against 2’ OMe RNAs, and (3) the formation of side products. The ideal protocol should have low overall bias and generate few side prod-ucts. This would allow to faithfully reproduce true sRNA expression profiles and to capture (weakly expressed) sRNAs that might otherwise escape detection. We tested the kits with and without several modifications, and using human miRNAs as representatives of non-modified sRNAs and plant miRNAs representing 2’ OMe-modified sRNAs. Our results identify protocols that work best for these dif-ferent types of sRNA. Our modifications lead to better de-tection of 2’ OMe RNAs than the standard protocols. Results and discussion
Experimental strategy
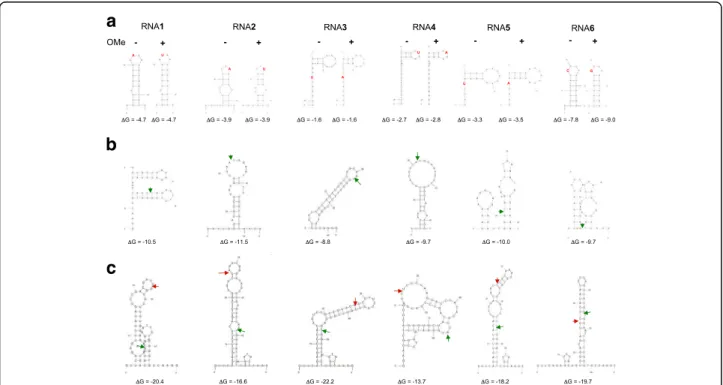
To test the performance of the various kits, we designed a pool of six synthetic sRNAs, supplemented with random 21 nt RNAs to create a complex mixture. As ligation effi-ciency can be influenced by RNA structure effects, the six synthetic sRNAs (RNAs1–6) were designed with various predicted secondary structures (Methods, Fig.1). We thus generated a pool with representatives of different types of sRNA that would enable us to examine a possible relation between levels of secondary structure formation and representation in the library. Of each of these RNAs a
2’-OMe variant was generated (RNA-OMe1–6). To distguish between the 2’-OH and the 2’OMe variants, we in-troduced a single nucleotide substitution that did not affect the predicted secondary structure. This was import-ant to make sure because differences in representation be-tween 2’-OH and the 2’OMe variants might otherwise be due to RNA structure bias rather than to bias against the 2’OMe variants. To create a complex mixture, RNA-s(OMe)1–6 were added to a mixture of synthetic random sRNAs to a final molar concentration of 1% for each RNA. Libraries were constructed using the TruSeq (TS), NEXTflex (Nf ), NEBNext (NN), SMARTer (S), or CATS (C) kit. In the TS and Nf protocols, we introduced a series of modifications as detailed in Table 1. The resulting libraries were sequenced using Illumina technology. We determined the proportion of sequences corre-sponding to RNAs(OMe)1–6 for each protocol and we tested their performance regarding the following three parameters: (1) sequence bias, (2) 2’-OMe bias, and (3) formation of side products.
Comparison of biases introduced by the following kits: TruSeq, NEXTflex V2, NEBNext, SMARTer and CATS
We started by comparing the levels of bias introduced by the various kits following their respective standard
a
b
c
Fig. 1 a Predicted secondary structures of the synthetic sRNAs 1–6 used in this study (Methods). The free energies at 28 °C are indicated for each sRNA without or with 2’ OMe. Nucleotide substitutions introduced to distinguish between the unmodified RNAs (RNA1–6) and the 2’OMe variants (RNA-OMe1–6) are indicated in red. These nucleotide substitutions did not alter the predicted secondary structures. The absence or presence of 2’ OMe modification is indicated by“-”or “+” signs, respectively. b Predicted secondary structures of RNAs1–6 ligated with the Illumina 3′ adapter. The ligation junctions are indicated by green arrows. c Predicted secondary structures of RNAs1–6 ligated with both the Illumina 3′ and 5′ adapter. The 3′ ligation junctions are indicated by green arrows, the 5′ ligation junctions are indicated by red arrows. Note that for 3′ adapter ligation the structures in (b) should be considered and for subsequent 5′ adapter ligation the structures in (c)
protocols. We determined the relative proportion of reads corresponding to each of the RNAs(OMe)1–6 con-sidering the total numbers of raw reads before adapter trimming to take into account also potential losses of sequences due to the formation of adapter dimers (Additional file 1: Figure S1). To measure specifically the variability among sequences, i.e. sequence bias,
we took the following approach: here we considered only the reads mapping to RNAs1–6 and we deter-mined the proportion of these reads corresponding to each RNA. The results are presented in a box plot (Additional file 2: Figure S2); in addition we used the standard deviations of the read distributions obtained with the different kits as an easier to read measure of variability (Fig. 2a). To measure only sequence bias at this stage and not bias due to the 2’ OMe modifica-tion, we considered only the unmodified RNAs for this analysis.
The TruSeq kit used under standard conditions pre-sented strong sequence bias (Fig.2aand Additional file1: Figure S1, protocol TS1), consistent with previous ob-servations [6, 11, 12]. While RNA1 was ~ 10-fold overrepresented, RNAs 2, 3 and 5 were about 10-fold under-represented and RNAs 4 and 6 were even more than 100-fold underrepresented (Additional file 1: Figure S1). We checked if these observations were consistent with RNA secondary structure formation, creating either a favourable or an unfavourable context for ligation. It should be mentioned here that data from Sorefan and collabora-tors suggested that RNA ligase 2 (Rnl2), the enzyme used for 3′ adapter ligation, has a preference for a double-stranded environment directly upstream of the ligation site. In contrast, RNA ligase 1 (Rnl1), the enzyme used for 5′ adapter ligation, would prefer a single stranded context [7]. The predicted secondary structures (Fig. 1) are in partial agreement with this hypothesis and with our observations. For example, RNA1 is predicted to have a double stranded context at the 3′ adapter ligation site and a single stranded environment at the 5′ site, which is consistent with the ob-servation that RNA1 is overrepresented. The other RNAs are predicted to have unfavourable structures for either 3′ or 5′ adapter ligation, consistent with these RNAs being under-represented. For the most under-represented RNAs 4 and 6, these structures predict a single stranded environ-ment around both the 3′ and the 5′ ligation sites for RNA4, while for RNA6 double stranded structures are pre-dicted at both sites. This would suggest that RNAs 4 and 6 would have poor 3′ or 5′ adapter ligation, respectively. To test this hypothesis, we ran a denaturing acrylamide gel with 3′ and 5′ adapter ligation products for RNAs 4 and 6 (Additional file 3: Figure S3). For comparison, we did the same analysis for RNA1, where both ligation steps should be efficient, and for RNA1-OMe, where 3′ adapter ligation is expected to be inhibited. For RNA4 we expected a similar phenotype as for RNA1-OMe, while for RNA6 we expected the opposite. The results shown in Additional file 3: Figure S3 are in agreement with our expectations for all RNAs except for RNA4. Here, like for RNA6, 5′ adapter ligation seems inhibited rather than 3′ ligation.
Thus, while it remains difficult to predict with preci-sion the efficiency of 3′ and 5′ adapter ligation, it may
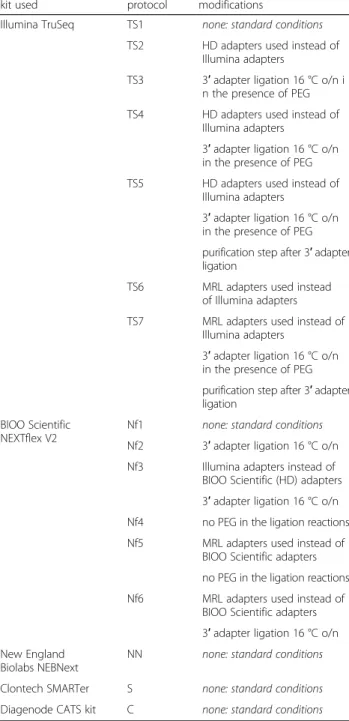
Table 1 Overview of the protocols used in this study kit used protocol modifications
Illumina TruSeq TS1 none: standard conditions TS2 HD adapters used instead of
Illumina adapters
TS3 3′ adapter ligation 16 °C o/n i n the presence of PEG TS4 HD adapters used instead of
Illumina adapters
3′ adapter ligation 16 °C o/n in the presence of PEG TS5 HD adapters used instead of
Illumina adapters
3′ adapter ligation 16 °C o/n in the presence of PEG purification step after 3′ adapter ligation
TS6 MRL adapters used instead of Illumina adapters TS7 MRL adapters used instead of
Illumina adapters
3′ adapter ligation 16 °C o/n in the presence of PEG purification step after 3′ adapter ligation
BIOO Scientific NEXTflex V2
Nf1 none: standard conditions Nf2 3′ adapter ligation 16 °C o/n Nf3 Illumina adapters instead of
BIOO Scientific (HD) adapters 3′ adapter ligation 16 °C o/n Nf4 no PEG in the ligation reactions Nf5 MRL adapters used instead of
BIOO Scientific adapters no PEG in the ligation reactions Nf6 MRL adapters used instead of
BIOO Scientific adapters 3′ adapter ligation 16 °C o/n New England
Biolabs NEBNext
NN none: standard conditions Clontech SMARTer S none: standard conditions Diagenode CATS kit C none: standard conditions
The Illumina TruSeq (‘TS’), BIOO Scientific NEXTflex V2 (‘Nf’) or Clontech SMARTer (‘S’) kits were used following their respective standard protocols or variants thereof. The different variants of the protocols are distinguished by numbers and their respective modifications are indicated
be possible to estimate roughly whether a given RNA of interest will be well represented or not using the clas-sical Illumina protocol. These results also illustrate that different RNAs can have similar levels of under-representation but for different reasons, i.e. due to either poor 3′ or 5′ adapter ligation efficiency. Thus, the obser-vation by Song and colleagues [14] that optimal PEG concentrations differ among miRNAs may be explained by the fact that in some cases 3′ ligation, and in other cases 5′ ligation needs optimisation, with optimal PEG concentrations that may be different for both ligation reactions. Indeed, Zhang and colleagues used 10% PEG for 3′ adapter ligation and 20% PEG for the 5′ ligation reaction [12].
Next, to measure 2’ OMe bias, we determined the ra-tio of the mean values obtained for the collecra-tion of un-modified RNAs to the mean values obtained for the 2’ OMe RNAs. Protocol TS1 had a strong overall 2’ OMe bias, with an almost 100-fold average lower representa-tion of the 2’ OMe RNAs than the unmodified RNAs
(Fig. 2b). Strikingly, this bias varied dramatically from one RNA to another, ranging from about 3-fold (RNA5)
to more than 300 fold (RNA3) (Additional file 1:
Figure S1). There was no apparent correlation be-tween the levels of sequence bias and 2’ OMe bias and it thus remains unclear what may cause such variability. Together, the combination of the two types of bias result in a more than 100,000-fold dif-ference in capture efficiency between the most strongly detected RNA (RNA1) and the most weakly detected RNA (RNA6-OMe).
Less bias was observed with the NEXTflex protocol. However, there was still significant variation in detection efficiency among RNAs 1–6 (Fig.2aand Additional file1: Figure S1, Nf1) and a 20-fold less efficient detection of the 2’ OMe RNAs (Fig.2b, Nf1). For a better detection of 2’
OMe RNAs the manufacturer recommends performing the 3′ adapter ligation overnight at 16 °C instead of 2 h at 22 °C (standard conditions). However, very similar profiles were obtained (Additional file1: Figure S1, compare Nf1
a
b
c
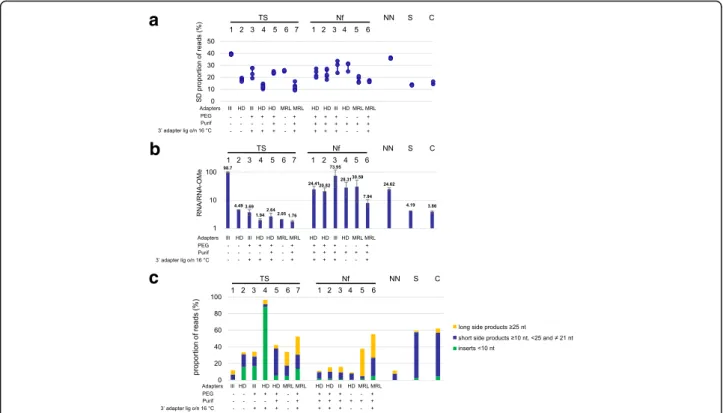
Fig. 2 a Sequence bias of the various protocols. The standard deviation of the proportion of reads corresponding to each of the unmodified RNAs 1–6 was taken as a measure of sequence bias. Shown are the data for each replica of the different protocols. We did not consider variation among the 2’ OMe RNAs here, as additional variability is introduced by 2’ OMe bias. The type of adapters used for the various protocols and the presence (“+”) or absence (“-”) of PEG and a purification step after 3’ adapter ligation is indicated. Also the presence or absence of overnight ligation at 16 °C is indicated, with“absence (-)” meaning standard ligation at 28 °C (TS protocols) or 22 °C (Nf protocols). b 2’ OMe bias of the various protocols. The ratios of the total numbers of reads for the unmodified RNAs (RNA1–6) and for the 2’ OMe RNAs (RNA-OMe1–6) were determined for each protocol and in each separate experiment. Shown are the mean values of at least two independent experiments and the standard deviations are indicated by error bars. c Percentage of the total numbers of reads corresponding to side products. The percentages of raw reads with inserts < 10 nt (considered adapter dimers and eliminated after trimming) are indicated in green. Blue bars represent inserts≥10 nt, < 25 and ≠ 21 nt that did not correspond to RNA(OMe)1–6. Yellow bars represent inserts ≥25 nt that did not correspond to RNA(OMe)1–6. Shown are the mean values of at least two independent experiments and the standard deviations are indicated by error bars
with Nf2) and no difference in sequence- or 2’ OMe bias was observed (Fig.2aandb, compare Nf1 with Nf2). It is thus at the user’s convenience to perform 3′ adapter ligation either 2 h at 22 °C or overnight at 16 °C. For prac-tical reasons, we performed all 3′ adapter ligations with PEG overnight at 16 °C (except for Nf4, where PEG was omitted); we will thus consider protocol Nf2 as the stand-ard NEXTflex protocol in the subsequent sections.
The NEBNext kit had somewhat less sequence bias than TruSeq, likely owing to the presence of PEG in the ligation reactions, but more than NEXTflex (Fig. 2a, compare protocols TS1 and NN). The 2’ OMe bias was similar to that observed with the NEXTflex protocol (Fig.2b, compare protocols Nf1 and NN).
The SMARTer and CATS protocols performed very similarly and had both less sequence- and 2’ OMe bias than NEXTflex. The remaining sequence bias (Fig. 2a, protocols S and C) can be explained by the observation that, as for adapter ligation, RNA secondary structure influences the efficiency of 3′ end tailing [19]. In addition, the 2’ OMe modification can reduce the effi-ciency of polyadenylation by PAP [5]. Thus, even though the SMARTer and CATS protocols do not rely on ligation for adapter addition, a certain level of bias re-mains. An additional problem with these protocols was the formation of side products; while the formation of adapter dimers (inserts < 10 nt) was modest, as with the TruSeq and NEXTflex protocols, there was an abundant formation of short inserts (10–20 nt and 22–24 nt) that did not correspond to RNA(OMe1–6) or to the 21 nt
random RNAs (Fig. 2c, protocols S and C). We
exam-ined the size distribution of these products and if there were sequences that predominated. There was a peak at 20 nt but no prevalent sequences were observed (data not shown). This may be explained by the fact that a 3′ A-tail is added followed by reverse transcription from an anchored oligo dT primer. Random RNAs that termi-nated by one or multiple A-residues will be reverse tran-scribed from the last non-A residue, resulting in a shorter product. Thus one fourth of the short side prod-ucts may originate from random RNAs terminating by one A, and one sixteenth from RNAs terminating by two A’s. The remaining ~ 20% may be explained, at least in part, by incomplete synthesis products. It should be mentioned that RNA(OMe)2 and 4 also end by an A and would escape detection if, after trimming, a perfect mapping to the entire length of the RNA sequence were required. These RNAs were therefore mapped to the truncated sequence without the 3′ terminal A.
It is important to note that there are strong differences in the expression profiles produced by the different methods (Additional file1: Figure S1, compare TS1, Nf1, NN, S, and C). These results are in agreement with pre-vious observations by Baran-Gale and colleagues [20],
and underscore the existence of method-specific se-quence biases. It is likely that the use of different adapter sequences plays a role in these profile changes, as previ-ously suggested [14]. However, our results presented below indicate that other factors can cause such changes as well. Thus, although the NEXTflex, NEBNext, SMAR-Ter and CATS kits give a more faithful picture of the true expression levels of sRNAs, even these methods are still biased. As a result, it remains difficult to quantita-tively compare the expression levels of different sRNAs.
Evaluation of RT and PCR as potential sources of bias
Adapter ligation or polyadenylation is followed by reverse transcription and PCR amplification, two potential add-itional sources of bias. In two previous studies, steps downstream of adapter ligation did not play a significant role in bias among sequences [6, 11]. However, it is also known that PCR polymerases differ significantly among each other in terms of bias introduction and it thus re-mains to be established whether these results can be gen-eralised to other sRNA library preparation protocols that rely on different polymerases. The Phusion polymerase provided with the Illumina kits is particularly bias-prone [21]. Instead of this enzyme, we therefore used the Kapa HiFi polymerase, which introduces much less bias [21], for the TruSeq libraries. For the NEXTflex and SMARTer libraries however, the enzymes provided with the kit (Duro Taq and AmpliTaq respectively) were used. To our knowledge, potential bias due to these enzymes had not been tested before. We thus amplified a standard TruSeq, NEXTflex and a SMARTer library for a total of 50 add-itional cycles with sample dilution every 10 cycles using Kapa HiFi polymerase, DuroTaq or AmpliTaq, respect-ively. No profile changes were observed even after 50 add-itional cycles of PCR with all three polymerases, arguing against a potential role for PCR in the bias observed with these libraries (Additional file4: Figure S4).
While PCR does not appear to introduce bias in sRNA libraries, reverse transcription was reported to be inhib-ited by the 2’ OMe modification; in fact, this feature has been used to map methylation sites by truncation of re-verse transcriptase extension products [22]. Using AMV-or excess amounts (up to 200 units) of M-MuLV reverse transcriptase reduced this effect [5]. The TruSeq, NEXT-flex and SMARTer protocols all use at least 200 units of (variants of ) the M-MuLV enzyme, and therefore reverse transcriptase effects are expected to be limited. We nevertheless tested if, when using AMV instead of M-MuLV reverse transcriptase the representation of 2’ OMe RNAs could be improved. A library was prepared following the classical TruSeq protocol but using AMV reverse transcriptase. No significant profile change was observed and bias against 2’ OMe RNAs did not de-crease (Additional file4: Figure S4).
Evaluation of the individual contribution of HD adapters and PEG to bias reduction
As shown above, the NEXTflex protocol has less bias than the TruSeq protocol. While this is expected to be due mainly to the use of HD adapters and PEG for the ligation reactions, their relative contribution has not been evaluated. In addition, it remains possible that other factors play a role in the difference between the two kits. To address these questions, we modified both protocols as follows. In the TruSeq protocol, the classical Illumina adapters were replaced by HD adapters while leaving the other parameters unchanged (TS2), PEG was added to the ligation reactions to a final concentration of 20% in combination with the Illumina adapters (TS3), or in combination of HD adapters (TS4). With the NEXTflex protocol, the reverse experiment was per-formed; the HD adapters were replaced by Illumina adapters (Nf3) or PEG was left out of the reaction mix-tures while keeping the HD adapters (Nf4). Note here that the standard NEXTflex protocol uses HD adapters in combination with PEG.
For both kits, HD adapters present less sequence bias than Illumina adapters, as previously reported [7–11] (Fig. 2a, compare protocols TS1 with TS2 and Nf2 with Nf3). Somewhat surprisingly, they also reduce overall 2’ OMe bias (Fig. 2bcompare protocols TS1 with TS2 and Nf2 with Nf3). As shown in Additional file1: Figure S1, for each RNA (except for RNA5 in TS2) the difference in representation of the unmodified- and 2’ OMe variant was less with HD adapters than with standard Illumina adapters (compare protocols TS1 with TS2 and Nf2 with Nf3). A likely hypothesis to explain reduced sequence bias due to HD adapters is that they would neutralize preferential ligation of certain RNAs with a given adapter due to favourable co-folds, while RNAs with un-favourable structures would be ligated less efficiently. It is difficult to apply the same model to explain reduced 2’ OMe bias since the 2’-OMe modification is not expected to affect RNA structure. Nonetheless, while the exact mechanism remains unclear, HD adapters substantially improve the detection of 2’-OMe RNAs.
PEG reduced, but did not eliminate 2’ OMe bias and se-quence bias with both kits (Fig.2a,band Additional file1: Figure S1, compare TS1 with TS3, and Nf2 with Nf4). Our results thus showed a smaller effect of PEG on bias against 2’-OMe RNAs than in the study by Munafo and Robb [5], where only a single sRNA sequence was tested. In this light, it is important to note that bias against 2’-OMe RNAs strongly depends on the RNA sequence; while for RNA4 and 5 there was an almost equal detection of the unmodified and the 2’OMe variants (Additional file 1: Figure S1, protocol TS3), substantial bias remained for the other RNAs. Thus, by using a pool of different RNAs, our study provides a more complete picture of the effect
of PEG on bias against 2’-OMe RNAs, and in addition confirms that PEG reduces sequence bias.
However, as compared with the standard TruSeq protocol, the use of HD adapters or the addition of PEG also led to the formation of numerous side products, mainly consisting of adapter dimers or short inserts (10–20 nt and 22–24 nt) that did not correspond to any of the RNA(OMe1–6) or to the 21 nt random RNAs (Fig.2c, TS2 and− 3).
The combined use of HD adapters and PEG following the Illumina protocol further reduced bias (Fig. 2a and
b, TS4). However, there was an excessive formation of adapter dimers (Fig.2c, TS4). It was striking to see that the combination of HD adapters and PEG led to a strong accumulation of adapter dimers with the TruSeq kit, while the NEXTflex kit produced very small amounts of adapter dimers (Fig. 2c, compare TS4 with Nf2). It should be mentioned here that different strategies are used by the two protocols to reduce the formation of
adapter dimers. The TruSeq protocol uses a ‘STOP’
oligonucleotide that hybridises to the 3′ adapter to pre-vent ligation of unligated 3′ adapter with the 5′ adapter. The NEXTFlex protocol instead includes a purification step after 3′ adapter ligation to remove excess 3′ adapter. Adding this step to the TruSeq protocol effi-ciently reduced the levels of adapter dimers, but the for-mation of other short side products increased (Fig. 2c, compare TS4 with TS5). Alternative solutions to reduce adapter dimers also exist. For example, Xu and col-leagues, who also observed an abundant formation of adapter dimers in the presence of PEG and HD adapters, published a protocol that uses the exonuclease RecJ to eliminate excess 3′ adapter before 5′ ligation [18].
Intriguingly, the addition of a purification step led to increased bias as compared to the protocol without this step (Fig. 2a, b, compare TS4 with TS5). In addition, there was a marked profile change (Additional file 1: Figure S1, compare TS4 with TS5). Importantly, this re-sult illustrates that even when using the same adapters, the addition of a simple purification step can substan-tially affect expression profiles. This highlights the im-portance to use exactly the same protocol for a series of samples that are to be compared.
Both sequence bias as well as 2’ OMe bias remained lower than with the NEXTflex protocol (Fig. 2a and b, compare TS5 with Nf2), raising the question of what may cause this difference. In both protocols a very simi-lar procedure is followed for 3′ adapter ligation (see
Methods for details), but the concentration of PEG is 20% in the TruSeq protocol, against 12% in the NEXT-flex protocol. This is likely to contribute to the lower 2’ OMe bias observed with the TruSeq protocol, since it has been shown previously that the use of 25% PEG bet-ter reduces 2’ OMe bias than the use of 12.5% PEG [5].
In conclusion, HD adapters and PEG have roughly similar effects, i.e. they both reduce sequence bias as well as 2’ OMe bias. The combination of HD adapters and PEG with a purification step had less bias with the TruSeq kit (TS5) than with the NEXTflex kit (Nf2). Our results further indicate that small changes in protocols, even when keeping the same adapters, can have pro-found effects on expression profiles.
Comparison of bias with HD adapters and MRL adapters
Fuchs and colleagues developed a variant of HD adapters, called ‘MidRand’, in which the randomised re-gions are in the middle of the adapters rather than at the extremities [11]. In addition, there is a region of complementarity between the 3′ and 5′ adapter, which may help to improve ligation efficiency. These authors reported that MidRand adapters reduce sequence bias, indicating that the randomised region does not have to be close to the ligation junction. However, whether this type of adapters performs better or not than HD adapters has not been addressed. Here we use a variant of MidRand adapters, which we call MidRand-Like (MRL) adapters, with the following changes: (1) the se-quences of both adapters were adjusted to make them compatible with the TruSeq/NEXTflex reverse transcrip-tion- and PCR primers, so that they can easily be used with these kits. In addition, (2) the 5′ adapter was a chimera of DNA and RNA instead of all RNA to make it less sensitive to degradation and less prone to form sec-ondary structures. We used MRL adapters both in the absence (TS6 and Nf5) as well as in the presence of PEG (TS7 and Nf6). Our data indicate that MRL adapters re-duce bias as compared with Illumina adapters (Fig. 2a
and b, compare TS6 with TS1). However, as compared
with HD adapters, no clear further reduction of bias is observed with MRL adapters in the absence of PEG
(Fig. 2a and b, compare TS6 with TS2 and Nf5 with
Nf4). When MRL adapters are combined with PEG, a more consistent bias reduction is observed as
com-pared with HD adapters and PEG (Fig. 2a and b,
compare TS5 with TS7 and Nf2 with Nf6). While using the TruSeq kit the percentage of side products did not change significantly, with the NEXTflex kit the formation of side products increased from 10 to 15% with HD adapters to about 50% with MRL adapters (Fig. 2c, compare Nf2 with Nf6). A substan-tial proportion of these side products were “long side products” (larger than 25 nt after trimming) and con-tained partial 3′ adapter sequences, either or not pre-ceded by a sequence corresponding to RNA(OMe)1–6 or an unidentified sequence, for which trimming was unsuccessful. All adapters used in this study were checked on polyacrylamide gels (see Methods), and no faster migrating species were seen for the MRL adapters.
It is therefore at present not clear what these partial adapter sequences originate from.
Bias does not prevent the quantitative detection of sRNAs with or without 2’ OMe
The strong bias observed with the classical TruSeq protocol raises questions of the capacity to detect ex-pression changes of a given sRNA in different condi-tions. It was previously reported that despite strong sequence bias 10–1000 fold changes were well detected [6], and a similar fold change among conditions was de-tected using either Illumina or HD adapters [7]. Thus, sequence bias does not appear to prevent the identifica-tion of differentially expressed sRNAs. However, these studies examined relatively large fold changes and a po-tential influence of 2’ OMe bias has not been investi-gated. We tested the capacity of protocols TS1, TS5, Nf2, and S to detect small (2–10)-fold changes in abun-dance of RNAs 1–6 and RNA-OMe1–6 (Additional file5: Figure S5). We prepared libraries from the synthetic RNA mixture described above, with RNAs1–6 and RNA-OMe1–6 at 1% molar concentration each (mix A), or from a mixture with altered levels of each RNA (mix B). All four protocols generally detected the theoretical fold changes for most RNAs quite well, irrespective of the ab-sence or preab-sence of the 2’ OMe modification, with coeffi-cients of determination ranging from 0.83 to 1.00. Even the 2- and 0.5-fold expression changes of RNA(OMe)4 and 5 were accurately detected by TS1, indicating that the strong bias with this protocol does not lead to a less quan-titative detection of sRNAs with or without 2’ OMe. How-ever, for some RNAs detection may be more accurate than for others. Finally, it should be noted that even though 10 million reads per library were generated in this experiment, only a few reads were obtained for the most weakly expressed RNAs with the TruSeq protocol, while for the other protocols at least 80–100 reads corre-sponded to the most weakly detected RNA. It there-fore follows that, especially in the case of 2’ OMe RNAs, the TruSeq protocol will require sequencing at much greater depth than the other protocols for ac-curate quantitative detection.
To further confirm these observations, we selected a few protocols (TS7, Nf2, and Nf6) to prepare libraries using B. napus sRNA preparations from either stems and leaves or from flower buds, and miRNA expression changes were measured. As shown in Additional file 6: Figure S6, similar fold changes were obtained using the different protocols.
To summarise the above sections, our analysis with the synthetic RNAs revealed that the SMARTer and CATS kits had less bias than the standard TruSeq and NEXTflex protocols. However, upon modification, bias levels with the TruSeq kit strongly decreased and
dropped below those obtained with the SMARTer and CATS kits. MRL adapters introduce less bias than HD adapters with both the TruSeq and NEXTflex kits. Un-fortunately, low bias conditions also favoured the for-mation of side products. There was a striking reverse correlation between bias levels and side product forma-tion, and the performance of a protocol will thus de-pend on a balance between these two. For 2’ OMe RNAs there is, next to sequence bias, also 2’ OMe bias to be taken into account in this balance. As a result, protocols that perform best for unmodified RNAs may not be the same as those that yield the best results for 2’ OMe RNAs.
Comparison of miRNA detection in biological samples using the different protocols
We next wished to determine how the various protocols would perform with biological samples. Our experimen-tal strategy was to compare these protocols for the de-tection of either human miRNAs, that are unmodified, or Arabidopsis miRNAs, that are known to contain a 2’OMe modification. We assessed the protocols for three different aspects: (1) the percentage of sequencing reads corresponding to miRNAs, (2) the formation of side products, and (3) the number of different (i.e. unique) miRNAs detected. The libraries were sequenced using Illumina technology and the reads were trimmed for adapter sequences and mapped to human or Arabidopsis
miRNA databases (miRBase; see Methods for details).
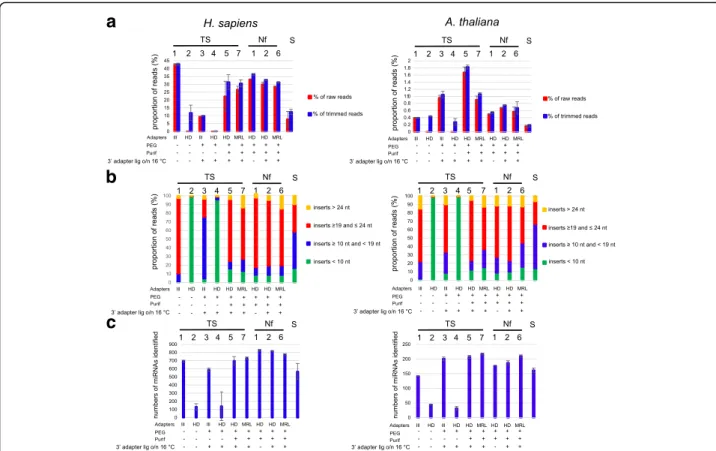
Adapter trimming removed all sequences with inserts shorter than 10 nt. We considered inserts from 19 to 24 nt as potential miRNAs and used this size range for mapping, while inserts of 10 nt to 19 nt or longer than 24 nt were considered side products (technical noise or biological material other than miRNAs). Mapping was done with Bowtie [23], considering only perfect matches. The percentage of the total numbers of reads mapping to miRNAs for the various protocols is shown in Fig.3a. With the standard TruSeq protocol (TS1), ~ 42% of the reads mapped to human miRNAs. While we did not ex-pect an increased percentage of mapping with the re-duced bias protocols, a decrease was observed. This can be explained largely by a loss of sequences due to an in-creased formation of adapter dimers and other side products (Fig. 3b). Especially in the case of protocols TS2 and TS4, there was an excessive formation of adapter dimers, leading to an almost complete loss of in-formative sequences. For protocols TS3 and S there was also a substantial loss of informative sequences, but mainly due to the formation of short side products. In the case of protocol TS3 these consisted mainly of frag-ments of the Illumina STOP oligonucleotide, which is added after 3′ adapter ligation. In the case of protocol S these products were mainly biological RNAs other than
miRNAs, potentially degradation intermediates of larger RNA species (Additional file7: Figure S7).
Strikingly, for Arabidopsis only ~ 0.4% of reads mapped to miRNAs with protocol TS1. In contrast to the human miRNAs, the percentage of reads corre-sponding to Arabidopsis miRNAs increased with the other protocols, likely owing to reduced 2’ OMe bias, ex-cept for protocols TS2, TS4 and S. Here, again there was a massive loss of sequences due to adapter dimers (TS2, TS4) and short side products (S). With all protocols, the percentage of mapped reads remained modest, which is consistent with literature data [18,24]. This probably re-flects, at least in part, remaining bias against 2’-OMe RNAs. Also with the synthetic RNAs, the 2’ OMe variants remained less represented than the unmodified RNAs even with the best performing protocols, but the differ-ence was less pronounced (Fig. 2band Additional file 1: Figure S1). Thus, it is possible that in the biological sam-ples used here remaining bias against 2’ OMe RNAs is stronger than in the synthetic mix, or the actual amounts of miRNAs may be lower in the Arabidopsis material than in the human RNA sample.
We next asked which protocol would allow to detect the widest possible range of different miRNAs. As this is likely to depend on the sequencing depth, we considered the same number of reads (one million) for all libraries sequenced. The numbers of miRNAs mentioned are mean values from at least two independent experiments. With TS1, 690 known human miRNAs were identified, which represents ~ 27% of the total number in miRBase (2588 human miRNAs) (Fig. 3c). The lack of detection of the other miRNAs may be explained either by the fact that the other miRNAs were absent from the starting material or that they escaped detection. While the proto-cols TS2, − 3 and − 4 detected less miRNAs than TS1, a modest increase in miRNA detection was seen with TS5, and − 6, capturing 714 and 730 miRNAs, respectively. A more marked increase was obtained with the NEXTflex protocols; Nf1, − 2, and − 5 captured 827, 816 and 773 miRNAs, respectively. The SMARTer protocol, strik-ingly, performed relatively poorly with only 565 miRNAs detected. These results thus indicate that with the stand-ard TruSeq protocol a substantial proportion of the miRNAs present in the starting material for library prep-aration escape detection at a sequencing depth of 1 mil-lion sequences, and that the NEXTflex protocols improve the capture of miRNAs.
For Arabidopsis, the TS1 protocol detected 142 known miRNAs, which represents ~ 33% of the total number of miRNAs registered in miRBase (427). As for the human miRNAs, protocols TS2 and TS4 performed less well, but in contrast TS3 performed better than TS1, with 201 miRNAs detected. Another difference was that for Arabidopsis the best results were obtained with protocol
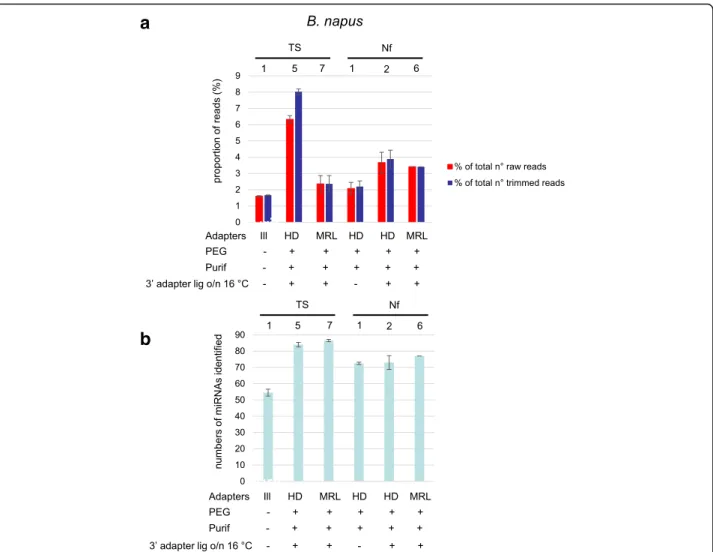
TS6 (217 miRNAs identified). Both in the TruSeq as well as in the NEXTflex kit, MRL adapter performed better than HD adapters (compare TS5 with TS6, and Nf2 with Nf6). The SMARTer protocol detected 161 miRNAs, slightly better than TS1. To validate these observations, the same experiment was done with Brassica napus (oilseed rape) RNA (except that protocols TS2, 3, 4, and S were not included). Very similar results were obtained as for Arabidopsis, underscoring the repro-ducibility of the data (Fig. 4).
It should be noted that the numbers of miRNAs de-tected are without any threshold of read number per miRNA, and many of the miRNAs detected are covered by only one single read. We also examined the numbers of human or Arabidopsis miRNAs detected that have
enough coverage to allow accurate detection of expres-sion changes. We determined the numbers of miRNAs detected at thresholds of 10, 20, or 30 reads per miRNA (Additional file 8: Figure S8). The numbers of detected miRNAs significantly decreased for all protocols, but the differences among the protocols did not change.
To further substantiate the observations made with the plant miRNAs, we studied the representation of piR-NAs, which are 2’ OMe modified [1], in the human li-braries. The reads with 19–24 nt inserts were mapped to
the piRNA database (see Methods) and the
propor-tion of mapped reads and the numbers of different piRNAs detected with each protocol were determined (Additional file 9: Figure S9). Similar to the plant miRNAs and in contrast to the human miRNAs, the
a
b
c
Fig. 3 a Percentage of reads mapping to human or Arabidopsis miRNAs. The proportion of reads mapping to human miRNAs (unmodified) or Arabidopsis miRNAs (with 2’ OMe modification) in miRBase were determined for the different TruSeq protocols (TS1–6), the NEXTflex protocols (Nf1–5), and the SMARTer protocol (S). We calculated the percentage of the total numbers of raw reads (red bars) or the total numbers of reads after trimming (blue bars) that mapped to miRNAs. Shown are the mean values of at least two independent experiments and the error bars represent standard deviations. The histograms on the left and on the right show the results for human or Arabidopsis libraries, respectively. The type of adapters used for the various protocols and the presence (“+”) or absence (“-”) of PEG and a purification step after 3′ adapter ligation is indicated. b Percentage of informative reads and side products. Following adapter trimming, the obtained reads were subdivided in four size categories: (1) inserts < 10 nt, indicated by green bars, (2) inserts≥10 nt and < 19 nt, (3) inserts≥19 and ≤24 nt, and (4) inserts > 24 nt. Given de size distribution of miRNAs, the third category was considered to contain informative reads, while the others may contain side products. Shown are the mean values of at least two independent experiments. The histograms on the left and on the right show the results for human or Arabidopsis libraries, respectively. c Numbers of known human or Arabidopsis miRNAs identified. We determined the numbers of known miRs identified with the various protocols. For each protocol, one million of reads were trimmed and the 19–24 nt inserts were used for mapping to human or Arabidopsis miRNAs in miRbase. Shown are the mean values of at least two independent experiments with standard deviations represented by error bars. The histograms on the left and on the right show the results for human or Arabidopsis libraries, respectively
proportion of mapped reads increased with the “low bias” protocols (but remained low) as compared to TS1, and the numbers of detected piRNAs also slightly increased. These results confirm the notion that the low bias protocols have an improved detec-tion of 2’ OMe RNAs.
In summary, there are substantial differences among the various protocols in sRNA capture. For (unmodified) human miRNAs the standard NEXTflex protocol per-formed best, whereas modification of the TruSeq proto-col led to only a modest improvement. For the (2’ OMe modified) plant miRNAs, modification of the TruSeq protocol led to a more marked improvement of detec-tion and the best results were obtained with MRL adapters in both kits.
Differences in sRNA capture do not decrease when sequencing at greater depth
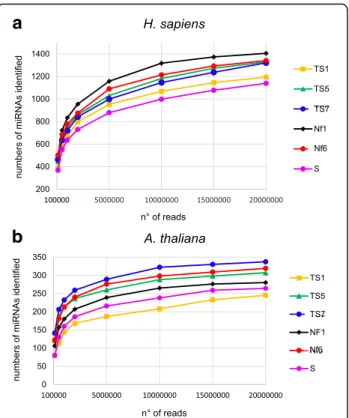
We next wished to determine whether the differences in miRNA detection among the protocols would persist at greater sequencing depths or if, when sequencing deeply enough, a similar number of miRNAs would be detected with all protocols. We therefore sequenced a series of human and Arabidopsis libraries following protocols TS1, − 5, − 7, Nf1, − 6, and S, and generated 20 million reads for each library. We determined the number of known miRNAs identified at increasing read numbers ranging from 100 thousand to 20 million reads (Fig. 5a
and b). For all protocols, the number of identified miR-NAs strongly increased along with read numbers up to ~ 2 million reads and then continued to increase more
b
a
Fig. 4 a Percentage of reads mapping to Brassica napus miRNAs. The proportion of reads mapping to B. napus (oilseed rape) miRNAs (with 2’ OMe modification) in miRBase were determined for TruSeq protocols TS1-, 5 and 7, and the NEXTflex protocols (Nf1, 2 and 6). We calculated the percentage of the total numbers of raw reads (red bars) or the total numbers of reads after trimming (blue bars) that mapped to miRNAs. Shown are the mean values of at least two independent experiments and the error bars represent standard deviations. b Numbers of B. napus miRNAs identified. We determined the numbers of known miRNAs identified with the different protocols. For each protocol, 0.5 million reads were mapped to B. napus miRNAs in miRbase (92 in total). Shown are the mean values of at least two independent experiments with standard deviations represented by error bars
slowly up to 20 million reads. Importantly, the increase in miRNA detection follows a very similar trend for all protocols and the differences in the number of detected miRNAs remain practically the same at each given read number. These observations indicate that even with the best performing protocols coverage of the miRNAs present in the libraries remains incomplete at 20 million sequences; indeed, there are still many miRNAs covered by only one read, confirming the lack of saturation (not shown). Thus, for all protocols, more sequences would be required to reach saturation, but the less well per-forming protocols would need much deeper sequencing than the better performing protocols. This is illustrated by the fact that, to detect 250 different Arabidopsis miR-NAs, 20 million reads are required with protocol TS1, whereas with protocol TS7 only 2 million reads are suffi-cient (Fig.5b).
We have thus established that some protocols detect much larger numbers of different miRNAs than others at the numbers of sequences generated. However, we
previously observed that each protocol has its specific biases (even the protocols with relatively low levels of bias) causing some sRNAs to be strongly detected while others are underrepresented. It is therefore possible that each protocol has its own specific subpopulation of miR-NAs that are well represented. To address this question, we compared the miRNA expression profiles for the dif-ferent protocols. Additional file 10: Table S1 shows the proportion of reads corresponding to all miRNAs de-tected with the various protocols and a heat map repre-sentation of the 50 best detected miRNAs is shown in Additional file 11: Figure S10. Rather different profiles were observed for the various protocols. The profiles cluster as a function of the type of adapter used; TS5, Nf1, and Nf2 (using HD adapters) cluster together as do TS7 and Nf6 (using MRL adapters), consistent with adapter-specific sequence bias. However, TS1 and TS3, although both using standard Illumina adapters, have ra-ther different profiles, indicating that PEG addition in TS3 changes the expression profile.
We asked if a combination of different protocols might help to further increase the number of different miRNAs detected. To test this possibility, we compared the num-ber of different human miRNAs detected with 1 million of reads for protocol Nf1 (827, Fig.3c), or for a combin-ation of protocols TS1, TS5, TS7, Nf1, and Nf6 (200 K reads each; 1 million in total). With this combination we detected 796 different miRNAs (data not shown). Thus, while combining different protocols may allow the capture of some miRNAs that would escape de-tection when using each individual protocol alone, the total number of detected miRNAs was not greater than for protocol Nf1.
Conclusions
In this study, we searched for a sRNA library prepar-ation protocol with the lowest possible levels of sequence- and 2’ OMe bias. The novel SMARTer smRNA-seq kit from Clontech and the CATS kit from Diagenode had less bias than the TruSeq and NEXTflex kits, probably owing to the absence of ligation steps. However, surprisingly, these kits also produced large amounts of side products and as a result did not perform better for the detection of biological miRNAs. The use of MRL adapters and PEG led to bias reduction in both the TruSeq and NEXTflex kit but also increased side product formation. For the detection of human (unmodified) miR-NAs the standard NEXTflex protocol performed best, and the modifications we introduced had little effect. In con-trast, for plant miRNAs (2’ OMe modified) these modifi-cations substantially improved detection, and the best results were obtained with PEG and MRL adapters in both the TruSeq and the NEXTflex kit. Our results thus yield improved conditions for the detection of 2’ OMe RNAs
b
a
Fig. 5 The differences in detection sensitivity among protocols do not change at increased sequencing depth. Sequencing libraries were prepared using three TruSeq protocols (TS1, TS5 and TS7), two NEXTflex protocols (Nf1- and 6), and the SMARTer protocol (S) with human (a) or Arabidopsis (b) sRNA. A total of 20 million sequences were generated for each library. For each protocol, 0.1, 0.5, 1, 2, 5, 10, 15 or 20 million reads were trimmed, the reads with 19–24 nt inserts were mapped to miRBase and we calculated the number of identified miRNAs
and in addition indicate that different protocols work best for different types of sRNA.
It should be mentioned here that we have not exhaust-ively tested all sRNA library preparation kits available on the market. However, at least to our knowledge, none of these other kits use randomised adapters and are there-fore likely to have more bias than the NEXTflex, SMAR-Ter and CATS kits. It should be kept in mind that despite the strong bias, the standard TruSeq protocol can quantitatively detect even small expression changes of both normal and 2’ OMe RNAs, provided that these are well detected.
Methods
Oligonucleotides
All oligonucleotides used in this study were purchased from Sigma-Aldrich or BIOO Scientific (HPLC purified). A series of six synthetic small RNAs, RNA 1–6, was pur-chased from Sigma-Aldrich. Of each RNA a 2’-OMe variant (RNA-OMe 1–6) carrying a single nucleotide (nt) substitution (to distinguish the 2’-OMe variant from the unmodified RNA) was purchased. To predict the secondary structures of RNAs1–6 alone, linked to the 3’ Illumina adapter, or linked to both the 3′ and 5’ Illumina adapters (as after 3′ and 5′ adapter ligation, respect-ively), we used the Mfold web server (http://unafold. rna.albany.edu/?q=mfold) [25]. The structures with the adapters provide an idea of the structures formed in the ligation reaction mixtures as the sRNAs and the adapters are expected to co-fold [7].
A mix of random 21 nt RNA oligonucleotides was purchased from BIOO Scientific. All of these RNAs car-ried a 5′ monophosphate. RNAs 1–6 and their 2’ OMe variants were added to the mix of random RNAs to a final concentration of 0.1μM each (1% of the total, con-centration of the total mix: 10μM).
In some of the library preparation protocols (see below), the adapters included in the kits were replaced by custom adapters; we used custom HD adapters and MRL adapters. The 3′ adapters were pre-adenylated fol-lowing a protocol described by Chen et al. [26]; 1 nmol of 5′ phosphorylated oligonucleotides were incubated with T4 RNA ligase 1 and 1 mM ATP at 20 °C overnight. All custom adapters were purified from 15% denaturing acrylamide gels followed by ethanol precipitation and dis-solved in water to a final concentration of 10μM. After purification, aliquots of the adapters were again migrated on 15% denaturing acrylamide gels for quality control. See Additional file12: Table S2 for oligonucleotide sequences and modifications.
RNA extraction
Individual plants for the two plants species Arabidopsis thaliana (ecotype Col-0) and Brassica napus (oilseed rape,
variety Darmor) were grown under controlled conditions (18 °C during 8 h at night and 21 °C during 16 h during the day) in the same climate chamber. Samples were col-lected all at once for each species. Total RNAs were ex-tracted from young leaves and stems or flower buds using the TRIzol® reagent following the manufacturer’s protocol (Invitrogen), with addition of 0.2 μL/mL beta-mercapto-ethanol to TRIzol® extemporarily. Human RNA (HeLa) was from the Total RNA-seq kit from ThermoFisher.
Library preparation
All protocols used in this study were based on the Illu-mina TruSeq Small RNA Sample Preparation kit, the BIOO Scientific NEXTflex Small RNA Sample Prepar-ation kit V2, the New England Biolabs NEBNext kit, the SMARTer smRNA-seq kit from Clontech, or the CATS kit from Diagenode. As starting material either the above-described mix of synthetic RNAs was used (10 pmol RNA per reaction) or biological small RNA samples. Biological small RNA samples were prepared as follows: 10 μg of total RNA from Arabidopsis, oilseed rape or human (HeLa) was migrated on 15% polyacryl-amide gels containing 8% urea alongside with molecular size markers. RNA was visualized with SYBR Gold (Life Technologies) and 15–30 nt RNAs were excised from the gel. The gel pieces were crushed by centrifugation using 0,5 mL Eppendorf tubes with tiny holes at the bot-tom. These tubes were put in 1,5 mL Eppendorf tubes followed by 2 min centrifugation at 13 krpm.
Subse-quently 300 μL 0,3 M NaCl was added to the crushed
gels and RNA was eluted by rotation overnight at 4 °C. RNA was ethanol precipitated and resuspended in 15μL water. We used 1μL of synthetic RNA mix (10 pmol, or about 70 ng) or 1 μL of gel-purified biological small RNA (~ 0,7 ng) for library preparation.
TS1. TruSeq – standard conditions. Library preparation was done using the Illumina TruSeq Small RNA library preparation kit following the manufacturer’s instructions, except that for 3′ adapter ligation 1 μL of synthetic or
bio-logical small RNA was mixed with 1 μL RA3 adapter
followed by 2 min’ denaturation at 70 °C. After this denatur-ation step the samples were put on ice and 4μL of water, 2μL of ligation buffer, 1 μL of RNA ligase 2 truncated (New England Biolabs) and 1μL of RNaseOUT was added.
TS2. TruSeq + HD adapters. The same procedure as for TS1 except that the Illumina adapters RA3 and RA5 were replaced by HD adapters.
TS3. TruSeq + PEG. The same procedure as for TS1 ex-cept that after the denaturation step for 3′ adapter ligation 4μL of PEG8000 was added instead of water and ligation was done at 16 °C overnight instead of 1 h at 28 °C.
TS4. TruSeq + PEG + HD adapters. The same proced-ure as for TS3 except that the Illumina adapters RA3 and RA5 were replaced by HD adapters.
TS5. TruSeq + PEG + HD adapters + purification. The same procedure as for TS4 except that, instead of adding STOP solution, a purification step was performed after 3′ adapter ligation to get rid of excess 3′ adapter. Two rounds of purification were done using AMPure beads (Beckman Coulter) as described in the protocol of the BIOO Scientific kit, except that the ligation products
were eluted in 9 μL H2O instead of 11 μL.
Subse-quently 2 μL of Illumina ligation buffer was added for 5′ adapter ligation.
TS6. TruSeq + MRL adapters. The same procedure as for protocol TS2 except that MRL adapters were used instead of HD adapters.
TS7. TruSeq + PEG + MRL adapters + purification. The same procedure as for protocol TS5 except that Mid-Rand adapters were used instead of HD adapters.
Nf1. NEXTflex protocol. Library preparation was done using the BIOO Scientific NEXTflex Small RNA-Seq kit V2 following the manufacturer’s instructions with 3′ adapter ligation for 2 h at 22 °C.
Nf2. NEXTflex protocol: as for protocol Nf1 but with 3′ adapter ligation overnight at 16 °C.
Nf3. NEXTflex protocol w/o HD adapters: the adapters from the NEXTflex kit were replaced by the Illumina adapters.
Nf4. NEXTflex protocol w/o PEG: PEG was replaced by water.
Nf5. NEXTflex protocol + MRL adapters w/o PEG: the adapters from the BIOO kit were replaced by MRL adapters and PEG was replaced by water.
Nf6. NEXTflex protocol + MRL adapters: the adapters from the BIOO kit were replaced by MRL adapters.
NN. NEBNext protocol: Library preparation was done following the manufacturer’s instructions with 3′ adapter ligation for 1 h at 25 °C.
S. SMARTer protocol: Library preparation was done using the standard protocol provided with the kit. For the libraries from the synthetic RNA mix ATP was added to the polyadenylation reactions and 7 cycles of PCR were done. For the libraries from the biological samples the polyadenylation reactions were done with-out supplemented ATP and 13 cycles of PCR were done. C. CATS protocol: Library preparation was done fol-lowing the manufacturer’s instructions.
Next-generation sequencing and bioinformatics analyses
All sequencing was done using Illumina platforms, either the MiSeq or the NextSeq500 instrument. For each protocol, several independent libraries were prepared; the mean values are represented in the Figures. Cutadapt [27] version 1.14 was used to remove standard Illumina and MRL adapter sequences. The minimum overlap be-tween the read and the adapter was set to 4 nucleotides, and reads shorter than 10 nucleotides were discarded.
Python scripts were used to trim HD adapters and also the random 3-base sequences upstream of the small RNA inserts for the SMARTer protocol. The microRNA
databases were downloaded from http://www.mirbase.
org/ftp.shtml (download date July 16, 2015); we only used the mature sequences of Arabidopsis thaliana, Homo sapiens and Brassica napus. For piRNA detection, the reads of the human libraries were mapped to piR-Base (http://www.regulatoryrna.org/database/piRNA/; downloaded March 2, 2017). The sampling of the reads was done using seqtk, version 1.0-r31 (H. Li, https:// github.com/lh3/seqtk/). Only the reads with a length be-tween 19 and 24 nt were kept using python scripts. Mapping to the databases was performed with
Bow-tie2, version 2.1.0, [23] allowing no mismatches.
Python scripts were used to count the number of miRNAs detected.
For the annotation of the short side products (10– 18 nt inserts) obtained with the SMARTer libraries from human or Arabidopsis RNA, the obtained sequences were trimmed for adapter sequences and were mapped to various databases. For human, the sequences were mapped to the database of small human non-coding
RNAs (DASHR; downloaded on October 5, 2017) [28],
mirBase (for partial miRNA sequences), and the regula-tory RNA database (http://www.regulatoryrna.org/data base/piRNA/download/archive/v1.0/fasta/) for piRNA sequences. The Arabidopsis sequences were mapped to databases for various non-coding RNAs;ftp://ftp.ensembl genomes.org/pub/release-24/plants/fasta/arabidopsis_tha liana/ncrna/Arabidopsis_thaliana.TAIR10.24.ncrna.fa.gz), tRNAs (http://gtrnadb2009.ucsc.edu/Athal/Athal-tRNAs.fa) and miRNAs (miRbase). All of these databases were down-loaded on October 6, 2017.
To generate the heat map shown in Additional file11: Figure S10 we used the heatmap.2 function from the R package gplots (R version 3.4.2).
Additional files
Additional file 1: Figure S1.Histograms representing the percentage of the total numbers of raw reads (before trimming) corresponding to RNA(OMe)1–6 with the TruSeq protocols TS1–7, the NEXTflex protocols Nf1–6, the NEBNext protocol (NN), the SMARTer protocol (S) and the CATS protocol. Blue bars represent the numbers of reads corresponding to each individual RNA, red bars represent the numbers of reads corresponding to RNA1–6 (total RNA) or RNA-OMe1–6 (total RNA-OMe). Shown are the mean values of at least two independent experiments. Error bars represent standard deviations. Note that in the absence of bias or loss of sequences, for each individual RNA the percentage of the total number of reads should be 1%, and for the sum of the unmodified or the 2’ OMe RNA this percentage should be 6%. For each RNA the ratio of the read numbers for the unmodified- and the 2’ OMe variant is indicated below the histograms (2’ OMe bias; in yellow). (PDF 1.01 mb)
Additional file 2: Figure S2.Box plot representation of the proportion of reads (%) corresponding to RNAs 1–6 with the various protocols. In the ideal situation, 16,7% of the reads (indicated by a red line) should
correspond to each RNA, without significant variability among the different RNAs. The data for each individual replica of the various protocols are shown. Horizontal black bars indicate the median RNA (MR). (PDF 1.01 mb)
Additional file 3: Figure S3.Polyacrylamide gel analysis of ligation products of RNA1, RNA1-OMe, RNA4 and RNA6. Samples were taken after 3′ and subsequent 5′ adapter ligation followed by electrophor-etic separation on a 10% denaturing polyacrylamide gel. Mixtures of the synthetic RNAs and 3′ adapter without ligation (−) were migrated along with the ligation products. Unligated 3′ adapter and synthetic RNAs, which almost co-migrated in the gels, are indicated by an accolade. Asterisks indicate from bottom to top: unligated 5′ adapter, RNA ligated with 3′ adapter, RNA ligated with 5′ adapter, and RNA ligated with both adapters. Note that RNA ligated with 3′ adapter migrates faster than RNA ligated with 5′ adapter because the 3′ adapter (21 nt) is smaller than the 5′ adapter (26 nt). (PDF 1.01 mb)
Additional file 4: Figure S4.Histograms representing the percentage of the total numbers of raw reads corresponding to RNA(OMe)1–6 with (A) the TruSeq protocol (TS1), (B) the NEXTflex protocol (Nf2), and (C) the SMARTer protocol (S). Green bars represent the results obtained with the standard numbers of PCR cycles (11 cycles for TS1, 14 cycles for Nf2, and 7
cycles for S), blue bars represent 50 additional cycles of PCR, and red bars represent the standard number of PCR cycles but using AMV reverse transcriptase instead of Superscript II for cDNA synthesis. (PDF 1.01 mb)
Additional file 5: Figure S5.Assessment of quantitative detection of synthetic RNAs with protocols TS1, TS5, Nf2, or S. Libraries were prepared from a synthetic RNA mixture in which RNA(OMe)1–6 were each at 1% final concentration, supplemented with random 21 nt RNAs (mix A).
Alternatively, an RNA mixture was used in which the concentrations of RNA(OMe)1–6 were changed (mix B); see table1for details. The coefficients of determination (R2) were determined for the fold changes obtained with
each protocol for the unmodified RNAs (R2
OH,blue dots) and for the 2’OMe
RNAs (R2
OMe,red dots) separately, and for the collection of the unmodified
and 2’ OMe RNA together (R2tot). The fold changes obtained with the
various protocols were compared with the theoretical values and the different protocols were compared to each other. (PDF 1.01 mb)
Additional file 6: Figure S6.Quantitative detection of oilseed rape miRNAs using protocols TS7, Nf2, and Nf6. Libraries were preparing from B. napus small RNA preparation originating either from floral buds or from stems and leaves and miRNA expression changes were measured. The detected fold changes with the different protocols were compared to each other and the coefficients of determination (R2) were calculated.
(PDF 1.01 mb)
Additional file 7: Figure S7.Annotation data for the short side products (10–18 nt inserts) with human and Arabidopsis libraries. After adapter trimming the human sequences were mapped to the database of small human non-coding RNAs (DASHR), mirBase (for partial miRNA se-quences), and the regulatory RNA database for piRNA sequences. The Arabi-dopsis sequences were mapped to databases for various non-coding RNAs (Ensemblgenomes), tRNAs (Genomic tRNA database) and miRNAs. See
Methodsfor details. (PDF 1.01 mb)
Additional file 8: Figure S8.Numbers of known human or Arabidopsis miRNAs identified with different thresholds of coverage. We determined the numbers of known miRNAs identified with the various protocols for human or Arabidopsis with a minimum coverage of 1 read per miRNA as shown in Fig.3. Alternatively, we set thresholds at minima of 10 (green bars), 20 (yellow bars), or 30 (pink bars) reads per miRNA. For each protocol, one million of reads were trimmed and the 19–24 nt inserts were used for mapping. Shown are the mean values of at least three (human) or two (Arabidopsis) independent experiments with standard deviations represented by error bars. (PDF 1.01 mb)
Additional file 9: Figure S9.Numbers of known human piRNAs identified. We determined the numbers of known
piRNAs identified with the various protocols. For each protocol, one million of reads were trimmed and the 19–24 nt inserts were used for mapping to human piRNAs in piRBase (seeMethodsfor details). Shown are the mean values of at least two independent experiments with standard deviations represented by error bars. (PDF 1.01 mb)
Additional file 10: Table S1.(XLSX 154 kb)
Additional file 11: Figure S10.Heat map representation of miRNA expression profiles obtained with protocols TS1, TS3, TS5, TS7, Nf1, Nf2, Nf6, and S. We determined the proportion of reads mapping to each miRNA as a percentage of the total number of mapped reads. These proportions are represented by a colour spectrum from very light red (weak expression) to dark red (strong expression). Shown here are the results for the 50 most highly expressed miRNAs, and the sequences and names of the miRNAs are indicated on the right. Data for all detected miRNAs are shown in Additional file2: Table S2. (PDF 1.01 mb)
Additional file 12: Table S2.Oligonucleotides used in this study. (XLSX 9 kb)
Abbreviations
2’-OMe:2’ O-methyl; HD adapters: High definition adapters; miRNA: microRNA; MRL adapters: MidRand-Like adapters; Nf: NEXTflex; NGS: Next-generation sequencing; PEG: Polyethylene glycol; S: SMARTer; sRNA: Small RNA; TS: TruSeq Acknowledgements
All library preparation, Illumina sequencing and bioinformatics analyses for this study were performed at the I2BC Next-Generation Sequencing (NGS) facility. We thank Dr. Laurence Amar for a generous gift of RNA material. Dr. Helene Touzet is gratefully acknowledged for stimulating discussions. The members of the I2BC NGS facility are acknowledged for critical reading of the manuscript and helpful suggestions.
Funding
This work was supported by the National Center for Scientific Research (CNRS), The French Alternative Energies and Atomic Energy Commission (CEA) and Paris-Sud University.
Availability of data and materials
The datasets used and/or analysed during the current study have been deposited in the NCBI Sequence Read Archive (SRA) database and are available under accession numbers SRP128925 and SRP128978. Author’s contributions
EVD and CT conceived the study, assisted by YAC and KA through helpful discussions. KA performed plant RNA extractions. EVD designed, planned and performed the experiments. CDD developed bioinformatics methods and analysed data, DN analysed data. CDD, CT and EVD wrote the manuscript and all authors reviewed it. All authors read and approved the final manuscript. Ethics approval and consent to participate
Not applicable. Consent for publication Not applicable. Competing interests
The authors declare that they have no competing interests.
Publisher’s Note
Springer Nature remains neutral with regard to jurisdictional claims in published maps and institutional affiliations.
Author details
1Institute for Integrative Biology of the Cell, UMR9198, CNRS CEA Univ Paris-Sud,
Université Paris-Saclay, 9198 Gif sur Yvette Cedex, France.2GQE– Le Moulon, INRA, Univ. Paris-Sud, CNRS, AgroParisTech, Université Paris-Saclay, 91190 Gif-sur-Yvette, France.
Received: 20 July 2017 Accepted: 22 January 2018
References
1. Ghildiyal M, Zamore PD. Small silencing RNAs: an expanding universe. Nat Rev Genet. 2009;10:94–108.
2. Chang TC, Mendell JT. microRNAs in vertebrate physiology and human disease. Annu Rev Genomics Hum Genet. 2007;8:215–39.