HAL Id: hal-02011120
https://hal.archives-ouvertes.fr/hal-02011120
Submitted on 7 Feb 2019HAL is a multi-disciplinary open access
archive for the deposit and dissemination of sci-entific research documents, whether they are pub-lished or not. The documents may come from teaching and research institutions in France or abroad, or from public or private research centers.
L’archive ouverte pluridisciplinaire HAL, est destinée au dépôt et à la diffusion de documents scientifiques de niveau recherche, publiés ou non, émanant des établissements d’enseignement et de recherche français ou étrangers, des laboratoires publics ou privés.
An improved model for the accurate calculation of
parallel heat fluxes at the JET bulk tungsten outer
divertor
D. Iglesias, P. Bunting, J. W. Coenen, G. F. Matthews, R. A. Pitts, S.
Silburn, I. Balboa, I. Coffey, Y. Corre, R. Dejarnac, et al.
To cite this version:
D. Iglesias, P. Bunting, J. W. Coenen, G. F. Matthews, R. A. Pitts, et al.. An improved model for the accurate calculation of parallel heat fluxes at the JET bulk tungsten outer divertor. Nuclear Fusion, IOP Publishing, 2018, 58 (10), pp.106034. �10.1088/1741-4326/aad83e�. �hal-02011120�
An improved model for the accurate calculation of
parallel heat fluxes at the JET bulk tungsten outer
divertor
To cite this article: D. Iglesias et al 2018 Nucl. Fusion 58 106034
View the article online for updates and enhancements.
Related content
Thermal analysis of protruding surfaces in the JET divertor
Y. Corre, P. Bunting, J.W. Coenen et al.
-Experiments on transient melting of tungsten by ELMs in ASDEX Upgrade
K. Krieger, M. Balden, J.W. Coenen et al.
-Heat loads on poloidal and toroidal edges of castellated plasma-facing components in COMPASS
R. Dejarnac, Y. Corre, P. Vondracek et al.
-D. Iglesias1, P. Bunting1, J.W. Coenen2 , G.F. Matthews1, R.A. Pitts3 , S. Silburn1, I. Balboa1, I. Coffey1, Y. Corre4, R. Dejarnac5, J. Gaspar6, E. Gauthier4, S. Jachmich7,8, K. Krieger9 , S. Pamela1, V. Riccardo10, M. Stamp1 and JET contributorsa
EUROfusion Consortium, JET, Culham Science Centre (CSC), Abingdon, OX14 3DB, United Kingdom of Great Britain
1 UKAEA—Culham Centre for Fusion Energy, Abingdon, OX14 3DB, United Kingdom of Great Britain 2 Forschungszentrum Jülich GmbH, Institut für Energie- und Klimaforschung—Plasmaphysik, Partner
of the Trilateral Euregio Cluster (TEC), 52425 Jülich, Germany
3 ITER Organization, Route de Vinon-sur-Verdon, CS 90 046, 13067 St. Paul Lez Durance Cedex, France 4 CEA, IRFM, Saint-Paul-Lez-Durance, France
5 Institute of Plasma Physics CAS, Praha, Czech Republic
6 IUSTI UMR 7343 CNRS, Aix-Marseille University, Marseille, France
7 EUROfusion PMU, JET, Culham Science Centre, Abingdon, United Kingdom of Great Britain 8 LPP, Ecole Royale Militaire/Koninklijke Militaire School, TEC partner, Brussels, Belgium 9 Max-Planck-Institut für Plasmaphysik, Garching, Germany
10 Princeton Plasma Physics Laboratory, PO Box 451, Princeton, NJ 08543-0451,
United States of America E-mail: daniel.iglesias@ukaea.uk
Received 15 December 2017, revised 18 July 2018 Accepted for publication 6 August 2018
Published 30 August 2018
Abstract
Parallel heat flux calculations at the JET divertor have been based on the assumption that all incoming heat is due to the projection of the heat flux parallel to the magnetic line, q , plus a constant background. This simplification led to inconsistencies during the analysis of a series of dedicated tungsten melting experiments performed in 2013, for which infrared (IR) thermography surface measurements could not be recreated through simulations unless the parallel heat flux was reduced by 80% for L-mode and 60% for H-mode. We give an explanation for these differences using a new IR inverse analysis code, a set of geometrical corrections, and most importantly an additional term for the divertor heat flux accounting for non-parallel effects such as cross-field transport, recycled neutrals or charge exchange. This component has been evaluated comparing four different geometries with impinging angles varying from 2 to 90°. Its magnitude corresponds to 1.2%–1.9% of q , but because it is not affected by the magnetic projection, it accounts for up to 20%–30% of the tile surface heat flux. The geometrical corrections imply a further reduction of 24% of the measured heat flux. In addition, the application of the new inverse code increases the accuracy of the tile heat flux calculation, eliminating any previous discrepancy. The parallel heat flux computed with this new model is actually much lower than previously deduced by inverse analysis
Nuclear Fusion
An improved model for the accurate
calculation of parallel heat fluxes at the JET
bulk tungsten outer divertor
D. Iglesias et al
An improved model for the accurate calculation of parallel heat fluxes at the JET bulk tungsten outer divertor
Printed in the UK 106034 NUFUAU © 2018 EURATOM 58 Nucl. Fusion NF 10.1088/1741-4326/aad83e
Paper
10 Nuclear Fusion IOPOriginal content from this work may be used under the terms of the Creative Commons Attribution 3.0 licence. Any further distribution of this work must maintain attribution to the author(s) and the title of the work, journal citation and DOI.
International Atomic Energy Agency
a See the author list of Litaudon et al [31]. 2018
1741-4326
https://doi.org/10.1088/1741-4326/aad83e Nucl. Fusion 58 (2018) 106034 (17pp)
of IR temperatures—40% for L-mode and 50% for H-mode—while being independent of the geometry on which it is measured. This main result confirms the validity of the optical projection as long as a non-constant and non-parallel component is considered. For a given total heating power, the model predicts over 10% reduction of the maximum tile surface heat flux compared to strict optical modelling, as well as a 30% reduced sensitivity to manufacturing and assembling tolerances. These conclusions, along with the improvement in the predictability of the divertor thermal behaviour, are critical for JET future DT operations, and are also directly applicable to the design of the ITER divertor monoblocks.
Keywords: JET, divertor, parallel heat flux, optical projection, ITER-like wall (Some figures may appear in colour only in the online journal)
1. Introduction
The JET first wall underwent a major upgrade which was completed in May 2011 [1]. Amongst other components, a set of W-coated CFC tiles replaced the existing CFC divertor tiles at the outer and inner targets [2]. Bulk tungsten was used instead for the central tile, and its design was changed from the previous large flat tile arrangement to a complex assembly of blades—or lamellas—organized in four stacks on each carrier tile [3]. During the first 11 months of operation, the divertor was tested to the maximum load and energy limits; no damage was observed [4].
Tungsten melting experiments were performed at JET in 2013 using a special lamella with a sharp leading edge, con-firming the absence of significant melt splashing during edge localized modes (ELMs) with energy densities comparable to those expected during mitigated ELMs on ITER [5]. One of the key diagnostics in this W melt experiment is infrared (IR) thermography, which can measure the temperature at the top surface of the lamellas, but not at the vertical surface of the protruding edge geometry where the power loading is maximum. As a result, thermal analysis is required to infer the heat flux density flowing parallel to the field lines, which strikes the leading edge at near normal incidence from a measurement of the top surface. The analysis performed at the time of the 2013 experiment found an unexpected and significant discrepancy between the parallel heat flux calcu-lated through IR measurements and the value estimated from thermal simulations of the lamella. The model used in inter-preting the experiment—which assumed that all heat flux followed an optical projection along field lines [6]—required post-processing correction coefficients as low as 0.2 and 0.4 for L-mode and H-mode respectively to match the exper-imental temperatures.
Partly in an attempt to understand these puzzling JET observations, a series of dedicated experiments were per-formed on several other devices within the framework of the International Tokamak Physics Activity [7]. The result of this study has been largely to confirm the validity of the optical projection within experimental uncertainty. No significant discrepancies of the magnitude found on JET were observed. In the case of the COMPASS tokamak, a non-negligible perpend icular power load component was identified in lim-iter configuration, attributed to local perpendicular radiation
heating [8]. COMPASS results are in line with previous find-ings from Tore Supra using the toroidal pumped limiter [9]. Recent studies of the inboard limiter on TCV have also found a significant non-parallel heat flux at grazing incidence due to perpendicular transport corresponding to ∼20% of the peak heat flux deposited on the tile [10].
On JET, a second divertor lamella melting experiment was performed between 2015 and 2016 using an alternative geom-etry. The new ‘sloped lamella’ shape facilitates the direct measurement of temperatures at the plasma loaded surface. New analysis of the experimental data for the more recent sloped geometry and the original misaligned experiment has been performed using two different strategies. Each greatly improves on JET divertor lamella models by using 3D FEM meshes for the forward thermal analysis, including precise consideration of the shadowing effects.
The first method is based on fitting the well-known physics-based divertor target heat profile models defined in [13], by iterating on their parameters until the temperature evolution matches the measured IR. The results for L-mode shots obtained using this approach were presented in [14]; the best match was obtained using a profile with a 50% reduction of the parallel heat flux density with respect to the standard method (in which the incoming heat flux density is derived from an inverse calculation based on the measured surface temperature) [6]. Although this is a considerable improvement on the former reduction of 80%, the differences between the parallel heat profiles extracted through inverse analysis of IR measurements and those fitted by iterative forward analysis are important.
The second strategy, presented here, aims to explain the origin of the discrepancies in the parallel heat flux calcul-ations based on inverse analysis. This has been done by exam-ining the nature of the divertor heat load and improving the calculation of the heat flux density at the tile surface. It has been found that the parallel heat flux is actually much lower than previously estimated for all experiments on the JET–ILW bulk tungsten divertor. The proposed procedure leads to equal parallel heat flux profiles on four different lamellas—the leading edge and sloped protruding geometries, along with the ‘standard’ and flat lamellas—confirming the validity of the optical projection approximation.
This paper is structured in the following sections: sec-tion 2 presents the proposed methodology for interpreting
IR measurements at any divertor tile with local shadowing. Section 3 details the application of this procedure to sev-eral L-mode and H-mode JET pulses, including a discussion of the findings and their implications for the divertor load definition. A final summary provides an understanding of the apparent reduction factors found in the first analysis of the melting experiment, along with a detailed breakdown for the contrib ution of each of the corrections to the plasma-wall heat loads.
2. Methodology
The surface heat load on a divertor tile can be reconstructed by an inverse analysis of the top surface temperature measure-ments. The heat load conducted and convected by the plasma parallel to the field lines is then typically calculated [11, 12] as
q (r, t) =
qn− qBG sin(θ) ,
(1) where
qn(r, t) is the heat flux onto the surface of the tile;
θ(r, t) is the angle between the magnetic lines and the tile’s surface; and
qBG(r) is a constant background heat flux from distant sources such as plasma radiation, which does not depend on the strike point location.
The following corrections to both stages of the reconstruc-tion of the parallel heat flux are proposed here:
Geometrical correction: the first correction is purely
related to differences between the underlying 2D model of the inverse codes—a slab—and the real lamella shape. The output of the inverse code is adjusted in the following way to calculate the heat flux at the tile surface:
qn(r, t) = q2Dfqfm
(2) with
q2D(r, t) the heat flux normal to the divertor tile com-puted by a 2D inverse code heat flux;
fq a power factor adjusting the flat 2D model to the
actual plasma-facing surface complexity; and fm a mass factor accounting for the bulk 3D
geom-etry effects.
Plasma heat load correction: the second correction takes
into account a non-parallel component of the plasma heat flux, q∦, which—unlike the background heat flux—is not constant in time or space. Both are removed from the tile surface heat flux before extracting the parallel heat flux density: q (r, t) = qn− qBG− q∦ sin(θ) (3) where
q∦(r, t) is mainly produced by cross-field plasma transport,
q⊥(r, t), but also includes other effects such as heat from neutral particles and local divertor radiation.
The effect of these corrections can then be analysed by comparing the following three models for the parallel heat flux:
Previous interpretation represents the typical
method-ology defined by equation (1), where the output of the 2D inverse models is directly interpreted as the normal heat flux onto the tile surface:
q (r, t) = qnsin(θ)− qBG =q2Dsin(θ)− qBG;
(4)
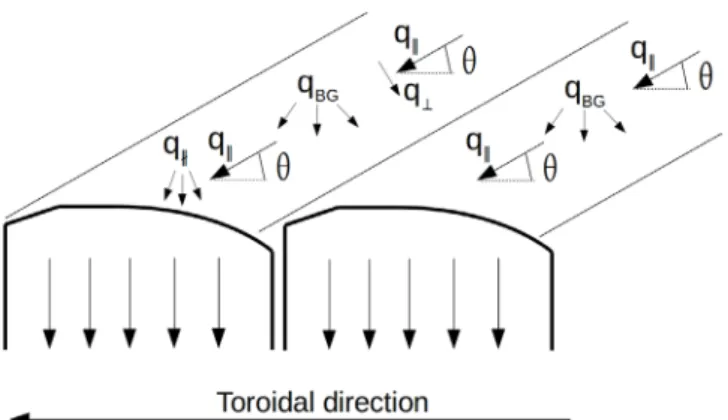
Strict optical projection includes only the geometrical
cor-rections for the calculation of the tile-normal heat flux (figure 1 left). In a similar way to the previous interpreta-tion, it considers all the heat flux arriving parallel to the magnetic lines with an additional constant background:
q (r, t) = qnsin(θ)− qBG =fmfqsin(θ)q2D− qBG;
(5)
Corrected optical projection considers both the
geo-metrical and plasma heat load corrections (figure 1 right):
q (r, t) = qn− qBG− q∦ sin(θ) = fmfqq2D− qBG− q∦ sin(θ) . (6) It will be shown that this last model leads to much more accurate results for all the analyses performed, including the reconstruction of parallel heat flux profiles, forward model-ling of the temperature evolution compared to IR data, and the shape characterization of the melted areas observed during the misaligned edge experiments.
Surface temperature measurements are used as the starting point for the analysis workflow shown in figure 2, which con-sists of several stages: a first calculation of the heat load, an intermediate interpretation based on geometrical parameters, and a final full 3D forward analysis using the projected heat flux. 2.1. Experimental setup
The two different arrangements shown in figure 3 have been tested and analysed. The first one corresponds to the 2013 Figure 1. Plasma heat load interpretations: corrected optical projection (left) with non-parallel SOL cross-field, charge-exchange and recycled neutrals components, and strict optical projection (right) with all the heat flux parallel to the magnetic line; both considering a constant background.
melting experiment (figure 3 upper), for which three different geometries were installed:
Leading edge lamella, with its front face exposed to the
plasma with almost perpendicular incidence. The height of the protruding edge varies from 2.5 mm at the high-field side to 0.24 mm at the low-high-field side.
Standard lamella, is the standard geometry used for all
9260 individual lamellas constituting the bulk W outer divertor target. These standard units have a carefully shaped top surface to optimize power deposition and avoid leading edges (see figure 1 and [26]). The one selected for analysis here is located on the downstream side of the leading edge lamella.
Flat lamella, located in front (upstream side) of the leading edge lamella. These special unshaped lamellas were included to ensure sufficient field line penetration from the upstream side onto the leading edge lamella [5]. The 2015–16 experiment was performed with a different geometrical configuration in which special flat lamellas are no longer required. In addition to the standard lamella, the fol-lowing elements are studied (figure 3, lower):
Sloped lamella, similar to a standard lamella, but with a
poloidally 20 mm wide sloped section. The angle with respect to the tile reference plane is 15°.
Shadowed lamella, geometrically identical to a standard
lamella, but with its first 20 mm of length shadowed by the sloped lamella.
The temperature profiles are measured at the top surface of the tiles using a high speed medium-wavelength infrared (MWIR) camera, known locally on JET as KL9A [15]. This camera views the horizontal divertor target from above with a pixel field of view of approximately 1.7 mm/pixel, observing black body radiation from the tile in the wavelength range 3.1–4.7 μm. The recorded intensity is calibrated to give
surface temperature using data from in-vessel calibrations performed in 2015, and the known wavelength and temper-ature dependent emissivity of bulk tungsten. The maximum camera frame rate was 3 kHz and 7.8 kHz for L-mode and H-mode shots, respectively. Such a high frame rate is achieved by reducing the field of view of the IR camera, covering half the width and length of the tile. 1D temperature profiles in the radial direction along the W lamellas of interest are extracted from each video frame. The locations of the relevant line pro-files used for the previous and current melt experiments are shown in figure 4. In both cases, the signal for the lamella M (SM) corresponds to the profile on the protruding lamella.
The local coordinate system has its origin sa = 0 at the
inboard (high field side) edge of the lamella, with sa increasing
with device major radius (towards the low-field side). There is a 14.55° angle—shown in figure 5—in the vertical-poloidal
plane between the tile surface and the viewing plane of the camera, which defines the transformation between the radial and local coordinate systems.
The angle θ (see equation (1)) is defined by the intersection of the 3D field line trajectory and the divertor tile surface. As was noted in previous studies [6], the variation of this angle along the 58 mm poloidal width of the lamella is of ∼1°. The dot product of the magnetic field vector and the lamella sur-face normal defines the cosine of the impinging angle, which depends on the poloidal coordinate as shown in figure 6 for the L-mode shot JPN 84514.
The inverse thermal analysis of the IR temperatures pro-vides the normal heat flux on the divertor tiles. In JET, this is automatically calculated and stored using the THEODOR code [18]. To double check this analysis stage, a new code ALICIA [16] has been developed and applied for the surface load reconstruction. The 2D geometries used for both codes are equivalent and based on the midplane rectangular sec-tion of the lamellas represented in figure 7. For the case of the sloped lamella, two independent rectangles are modelled at each side of the keyhole—one for the sloped section and another for the standard section. It has been checked that this Figure 2. Workflow for the experimental calculation and verification of the parallel heat flux: the inverse analysis heat flux is corrected by two geometrical factors, leading to a value for the heat load at the lamella flat surface, qn. The measurements on the shadowed lamella are
used to quantify the non-parallel component, q∦. This value is subtracted from qn—either considering its full value over time (corrected
projection) or just the constant radiation and background (strict optical projection)—before calculating the parallel heat flux using the magnetic field line incidence angle θ. The q profiles reconstructed in each way for different lamellas are compared. A final verification is performed using the q extracted from a standard lamella and projecting it back onto the protruding edges.
approximation has negligible effect on the surface heat flux density calculation, compared to other sources of error. Instead of the α-parameter [17] and the explicit integration rule of the present version of THEODOR used at JET, ALICIA applies augmented Lagrangian and implicit integration schemes to bound the error to 5 °C on the surface of the lamella. The implicit integration rule allows the application of an extremely fine finite element (FE) mesh in the plasma facing surface, which leads to a much better ELM capture while substantially improving the reconstruction of the L-mode heat flux.
Validation cases are presented in appendix A.2 using a synth etically generated heat flux profile to compare the cor-rected 2D inverse model to the 3D lamella behaviour. 2.2. Geometrical corrections
Two geometrical corrections are required to match the behav-iour of the approximate inverse models to the real lamella geometries: one related to the shape of the plasma-facing surface, and a second accounting for the 3D geometry of the bulk lamella. Each correction is applied using a corresponding
factor, leading to an improved interpretation of the time-aver-aged heat load, q2D:
Load factor fq relates the uniform load assumed by the
inverse codes with the normal flux defined in figure 8 for the irregular lamella geometry qn, and
Figure 3. CAD models of the centre tile of the JET divertor with protruding lamellas for 2013 (upper) and 2015–16 experiments (lower). The tile is comprised of four ‘stacks’ of lamellas, with Stack A the most inboard of the four and containing the special lamellas.
Figure 4. KL9A MWIR camera images for the inboard stacks of the divertor bulk-W tile, and line profiles used to extract the lamella temperatures for the 2015–16 experiment. Lamella P belongs to Stack B and the other lamellas to Stack A. In particular, lamella M is the protruding—melted—lamella.
Figure 5. Magnetic lines projected in the vertical-poloidal plane during experiment shots. Blue lines show equilibrium reconstruction when the strike point is on Stack A, and red lines correspond to the strike point shifted to Stack B.
Figure 6. Variation along the poloidal length of a Stack A lamella of the total angle between the 3D magnetic field and the lamella surface.
Mass factor fm is a correction factor which accounts
approximately for the 3D thermal mass distribution of the thin tiles.
As shown in figure 8, the top surface of a standard lamella is far from flat. Its geometry is a combination of shadowed areas at the front and rear, a flat 1.5 mm surface in its central section, and a parabolic surface to the front. The thickness of each lamella is 5.5 mm, and they are arranged toroidally with a separation of 1 mm, defining a 6.5 mm cyclic symmetry within the stack.
The load factor fq is defined as the ratio between the normal
load on the flat region of a lamella, qn, and the output of the
2D inverse codes, q2D. The key condition to be met is that the toroidally integrated power for the tile under study is equal to the power integrated in an equivalent continuous slab. Although the loading pattern of the standard lamellas is com-plex, the cyclic assembly symmetry allows this factor to be calculated straightforwardly as the ratio of the lamella thick-ness to the distance between the symmetry planes:
fq= qn
q2D =
5.5 mm
6.5 mm =0.85.
(7) This can be simply interpreted as the additional power that the lamellas receive due to the discontinuity produced by the gaps. Its consideration as a power factor facilitates its applica-tion to lamella geometries with no cyclic symmetry. It needs to be noted that the use of this factor assumes that the toroidal temperature profile produced by the complex surface heat flux has already formed. For the lamellas analyzed, this is true approximately 0.5 s after the strike point is fixed. Once this toroidal profile is stable, the net heat flow inside the lamella has a vertical direction, and the temperature rise at the surface is equivalent for all points located at the same poloidal coordi-nate (i.e. subjected to the same q2D).
For the protruding lamellas, the factor is calculated by the ratio of the total power in the real geometry to the power on a flat 5.5 mm long slab loaded by qn. As opposed to the standard
lamella, the flat surfaces of the leading edge and sloped lamellas have a well defined solid angle, which is used for the analytical integration of the heat load. The loading scheme
represented in figure 9 yields the following expression for the load factor of the protruding lamellas:
fq= ltile
lflat+lslope sin(θ+α)sin(θ) ,
(8) where α is an angle defining the geometrical shape of each of the special lamellas, and parameters l refer to the size of the various geometrical lengths in figure 9. The factor fq is
constant for the sloped lamella, but variable for the leading edge geometry since the height of the exposed edge changes linearly along its length:
• fq = 0.085–0.65 for the leading edge lamella, using:
– lflat=5.5 mm, – lslope=0.25–2.4 mm, – α =90°.
• fq = 0.18 for the sloped lamella, using:
– lflat=1.0 mm, – lslope= cos(α)4.2 mm, – α =15°.
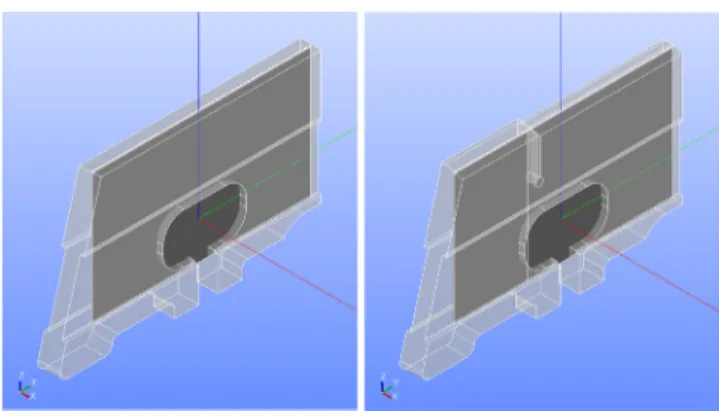
A second adjustment is needed to match the 2D rectangular models to the real 3D geometry thermal response. As previ-ously introduced, the inverse analysis 2D model is equivalent to a 3D block, which differs from a real lamella (see figure 7) in the following aspects:
• The real lamella thickness is not constant, with the plasma exposed section being thicker than the lower part. • There is a central hole required for their assembly and
packing by a tension chain.
• The 15° lamella has a keyhole separating the sloped sec-tion from the standard section.
The thermal mass factor, fm, is proposed to account for
these differences. Forward simulation using Abaqus [19] has been used to estimate the magnitude of this 3D solid geom-etry effect through a series of tests varying the peak heat flux and the location of the at which the peak heat flux strikes the lamella (corresponding approximately to the magnetic strike point position in the real experiment). Although the behaviour Figure 7. CAD models of the geometry for the protruding lamellas
for 2013 (left) and 2015–16 experiments (right), showing the rectangular 2D section used for the inverse analysis, which do not model the toroidal dimension.
Figure 8. Toroidal section loading assumptions for the 2D inverse analysis approximate models and the real profile of a single standard lamella.
of the real geometries relative to the equivalent block depends slightly on these two parameters, the following values of fm
have been found for each of the lamellas which limit the max-imum error to less than 5%:
• Std. lamella: fm = 0.9.
• Sloped 15° lamella: fm = 0.95.
• Leading edge lamella: fm = 0.95.
• Flat lamella: fm = 0.93.
The load and mass factors are applied for the interpretation of L-mode and H-mode time averaged heat fluxes. In the case of ELM heat loads, the geometrical factors do not apply since the transient heat loads they produce are much faster than the characteristic diffusion time of the lamella. The calculation of the ELM q is thus performed using the incident angle of the projected pixel for each of the profiles without any other geometrical consideration. Inter-ELM heat loads are also cal-culated using the load and mass factors, but might be affected by slightly larger error since the time between ELMs is shorter than the characteristic diffusion time of the lamellas in the toroidal direction (∼0.2 s). Nevertheless, for the typical ELM frequency of ∼25 Hz used in the experiments discussed here, the validation results provided in appendix A.2, show that this toroidal transient effect between ELM and inter-ELM heat loads is of the order of 0.01 s.
2.3. Plasma heat load corrections
The background heat flux, qBG, is measured when the strike point is moved away from the lamella. It has been checked that its value is similar for all geometries with different sur-face temperatures, independently of whether or not they are magnetically shadowed. This confirms the accuracy of the IR measurements and minimizes any source of errors affecting a specific lamella.
The non-parallel component of the heat flux is measured at the shadowed lamella before moving the strike point away. The poloidal length of the shadowed region is only 20 mm, with only 10 mm of these unaffected by the heat flux dis-continuities between shadowed and non-shadowed regions,
along with the one produced by the low-field side edge of the lamella. The modular transfer function (MTF) of the optical system smoothes the sudden jump of temperature along these discontinuities, preventing proper characterization of the profile of the non-parallel component. Nevertheless, its peak value can be derived from the measurements by removing the background:
q∦=qn,sh− qBG,
(9) where qn,sh is the surface heat flux in the shadowed region.
In the case of ELMs striking a misaligned lamella, the heat load may be affected by the increased gyroradius, which leads to Larmor smoothing and a reduced ELM load. This effect is dependant on the local lamella geometry, and can only be esti-mated by simulations of irregular surfaces [20]. For the pro-truding edges, PIC modelling [21] reports small adjustments required of ∆q (0.2 ± 0.1)qn. This has been taken into account via an additional 20% reduction of the ELM parallel heat flux projected to the protruding lamellas, leading to an excellent match of the ELM temperature increase measured at the sloped lamella surface.
2.4. Additional verifications
The thermal simulation loop—i.e. the inverse reconstruction of heat flux and forward simulation of temperatures at the lamella—also needs to be consistent with other measurements not related to the IR diagnostic system.
The melting of the leading edge surface is captured by a high definition visible light camera inbetween shots. The thermal simulation of each of the experiments’ first melting pulses should be able to reproduce the shape of the melted area. In each of the two special lamella experiments (leading edge and sloped), the thermal simulation should be able to capture the shape of the melt region observed optically imme-diately following the first of the pulses in which melting began. In the case of the sloped lamella, the melted zone is also observed directly by the IR system. The emissivity of the material is reduced instantly when melting starts, leading to an apparent reduction of the temperature measurements Figure 9. Toroidal section loading assumptions for the protruding edge profiles of the leading edge (left) and sloped (right) lamellas.
[22]. The comparison between simulated temperatures and IR measurements should therefore diverge at the exact moment of melting onset.
3. Results and discussion
3.1. L-mode
Two twin pulses have been chosen from the previous (JPN 84514) and new melting (JPN 89162) experiments. Both have the same parameters: toroidal field Bt=2.6 T, plasma cur-rent Ip=2.45 MA, neutral beam injection power PNBI= 2.0 MW, and resistive heating power Pohmic=1.5 MW. The pulses begin with the outer divertor strike point located on Stack B, followed by a 2 s excursion onto Stack A where directly strikes the special lamellas. The only slight difference between the two pulses is the position of the strike point. As the 2015–16 melting experiment sloped lamella section is just 20 mm wide poloidally, the strike point has been displaced 12 mm inboard during the excursion with respect to the 2013 experiment.
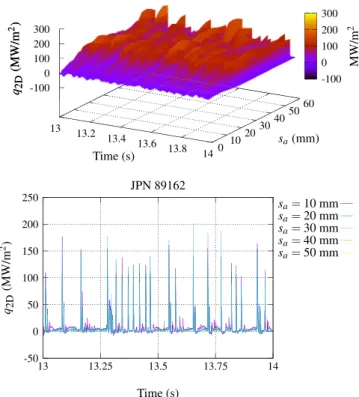
At the beginning of the transition to Stack A, the inverse codes give a slight overshoot of the reconstructed heat flux history, shown in figure 10 along the local poloidal coordinate sa. This effect was noted in the validation tests presented in
appendix A.2, and is produced by the irregular toroidal heat distribution. Once the toroidal temperature profile is formed, the calculated heat flux stabilizes. This transient effect lasts between 0.2 and 0.5 s, and is therefore avoided when selecting the time interval used for the characterization of the plasma load.
The transient response for the ALICIA model is repre-sented in figure 10. The smoothness of the output facilitates the identification of the apparent overshooting period. The stable phase on Stack A—where the lamella heat flow is domi-nated by 2D diffusion—corresponds to the interval between 16.5–18.0 s.
3.1.1. 2015–16 melting experiment. Completely independent calculations of the parallel heat flux density have been car-ried out using the IR temperature for the standard and leading edge geometries, respectively. The application of the proce-dure detailed in the previous section to each geometry leads to the following factors for the heat flux interpretation:
• Std. lamella: fq = 0.85, fm = 0.9.
• Special 15° lamella: fq = 0.17, fm = 0.95.
The time evolution of the reconstructed surface heat load averaged every 0.5 s, ¯q2D, is represented in figure 11, showing a stable peak power value and an almost constant profile. The results for the shadowed lamella shown in figure 12 give the two measurements required for adjusting the plasma heat load correction parameters:
• During the strike point excursion onto the slope, the value measured for the heat flux in the shadowed region is qn,sh= (900 ± 100) fq fm=690 ± 77 kW m−2.
• After the excursion, the background heat is evaluated. Its magnitude of qBG= (50 ± 40) fq fm=38 ± 30 kW m−2 is found to be of the order of the radiated power calcu-lated by the code TorusMC using bolometry data [23], which is negligible compared to the heat measured during the excursion.
The difference between the two gives the value for the non-parallel heat q∦= (650 ± 107) kW m−2. It is important to note that this represents a large fraction of the standard lamella surface heat flux density, q∦ 0.20 max(qn), even though the applied correction only corresponds to a small fraction of the parallel heat flux, q∦=1.2% q .
The discontinuity between shadowed and non-shadowed regions, as well as that separating the sloped and standard sections of the sloped lamella are affected by the MTF of the optical system. Instead of a discrete step in the heat flux, the smoothing of the temperatures produced by the IR diag-nostic system gives an apparent transition in the the shadowed region, and a poloidal overshoot in the non-shadowed part, affecting the calculated q in a similar way as was noted in [14]. An additional interpolated profile has been added to the analysis, in the case of the sloped lamella experiment, which skips the irregularity using a linear approximation between the two sides of the keyhole. Results for the computed plasma parallel heat density are compared in figure 13, with and without the plasma heat load correction.
A difference of 15% in peak power is found between the standard and exposed lamellas when using the strict optical projection, which disappears when the non-parallel heat Figure 10. L-mode heat flux reconstruction for pulse 89162 using ALICIA with 5 °C Augmented Lagrangian bounded error.
correction is applied. The poloidally integrated power is also very well matched for the latter, with a difference of just 3% when the discontinuity of the profile is corrected, and negli-gible without any interpolation.
3D forward analyses have been run for the sloped lamella using both the strict optical, and corrected optical profiles. Figure 14 shows how the IR temperatures are only matched for the sloped lamella when the corrected interpretation is used. Note that the projection model is irrelevant when model-ling the same geometry from which the parallel heat flux was calculated. This is why there is no difference for the standard side of lamella (sa > 20 mm).
3.1.2. 2013 melting experiment. An equivalent procedure has been performed for the re-interpretation of the old exper-imental results in L-mode. The power factors used for the lead-ing edge differ with respect to the 2015–16 sloped lamella, as detailed in section 2. Here, a third lamella geometry is now introduced, corresponding to a flat lamella installed upstream of the leading edge in order to allow field line penetration to the leading edge (see figure 3 upper). The analysis is per-formed using the following factors:
• Flat lamella: fq = 0.85, fm = 0.93.
• Std. lamella: fq = 0.85, fm = 0.9.
• Leading edge lamella: fq = 0.085–0.65, fm = 0.95.
In the absence of a local shadow, as the plasma param-eters are essentially identical for both experiments, the measured q∦ from the new experiment has been used to correct the parallel heat flux. The agreement between the profiles calculated using each of the geometries improves when this correction is applied (see figure 15), with a very good match of peak power density and integrated power along the lamella. The maximum difference of just 5% in these two measurements suggests that the correction effect was equally relevant for the leading edge geometry of the 2013 experiment.
Figure 16 shows the time evolution of the maximum temper-atures for the 3D forward simulation. The thermal model leads to unrealistic results when the strict optical approximation is used, while an excellent match to the IR temperatures has been found when using the corrected optical projection.
Figure 17 compiles the three q profiles extracted at
t = [18, 18.5] s when the surface temperature is maximum at 500 °C, illustrating the differences between the new approach with ALICIA (both strict optical and corrected optical) and the old analysis procedure using the THEODOR code. The latter grossly overestimates q across the whole poloidal length of the lamella.
Figure 11. Inverse analysis q2D profiles during L-mode pulse 89162
for the standard and sloped lamellas. Time averages every 0.5 s. Vertical solid line indicates the separation between the sloped and standard sections of the lamella.
Figure 12. Inverse analysis q2D smoothed profiles for standard
shadowed lamella during and after excursion for L-mode pulse 89162. Time averages every 0.5 s.
Figure 13. Parallel heat flux q independent calculation for each lamella during L-mode pulse 89162 using strict optical and corrected optical projections. Time averages between 17 and 17.5 s.
Figure 14. Temperature evolution for the sloped lamella during L-mode pulse 89162. Comparison between IR temperatures and 3D FEM forward analysis results for two points at the sloped surface (sa = 10.3 mm, and sa = 14.1 mm) and one point at the standard side (sa = 40.0 mm) using strict optical and corrected optical projections of q .
3.2. H-mode
In the course of the 2013 experiment, the leading edge lamella melted during pulse JPN 84779, with Bt=2.88 T, Ip=3.0 MA,
PNBI=21.0 MW, and ELM frequency of 32 Hz. To compare the H-mode response between the old and new experiments,
pulse number JPN 89445 for the sloped lamella has been selected as the discharge with highest power density before melting of the sloped surface. This pulse had Bt=2.88 T,
Ip=3.0 MA, PNBI=14.8 MW, PICRH=2.6 MW, and an ELM frequency of 25 Hz [22]. Selecting a shot without melting minimizes the uncertainty on the emissivity produced by the phase change, which is required for comparing the par-allel heat profiles between the sloped and standard lamellas. For completeness, the additional pulse 91965 has also been included in the forward analysis for which melting of the sloped surface did occur. This latest discharge used the highest values of Bt, Ip, and heating power [22], with Bt=3.03 T,
Ip=3.23 MA, PNBI=24.9 MW, and PICRH=2.8 MW. 3.2.1. 2015–16 melting experiment. The new exposed lamella design allows direct measurement of the temperature evo lution including ELM transients, represented in figure 18.
Figure 19 completes a series of time averaged heat flux pro-files (averaging period 0.5 s) across the standard and sloped lamella. The value for the averaged peak heat flux including ELM and inter-ELM is stable during heating in both geom-etries. In the case of the shadowed lamella, the equivalent time-averaged profiles are shown in figure 20. It is clear that the L-mode observation of heat deposition into the shadowed region also persists in H-mode.
The heat measured at the shadowed lamella is
qn,sh (3.0 ± 0.2) fq fm=2.3 ± 0.15 MW m−2, corre-sponding to a fraction of up to 35% of the standard lamella Figure 15. Time averaged L-mode profiles of q across the
standard, flat and leading edge lamellas using strict optical and corrected optical projections (time average between 17.0–17.5 s.
Figure 16. Temperature evolution of the measured and 3D forward analysis top surface temperature at the mid-point section of the leading edge lamella for L-mode pulse JPN 84514 (corresponding to the position of the peak temperature). The thermal analysis is performed for both the strict optical and corrected optical projection of q .
Figure 17. Comparison of the previous interpretation of the L-mode q using THEODOR and no corrections, with the strict optical and corrected optical projections calculated using the new ALICIA inverse code along with the proposed corrections (time average for the maximum temperature interval, between 18.0–18.5 s).
Figure 18. ALICIA reconstruction of surface flux density on the standard lamella for H-mode pulse JPN 89445 over a 1 s time interval with strike point positioned on the high field side (sa∼ 10 mm). The ELM excursions are clearly visible.
heat flux, qn. The background effect is measured at the standard and shadowed lamella after t = 15.0 s (when the strike point has moved away from the slope), giving the same result for both, qBG= (0.6 ± 0.3) fq fm=0.46± 0.23 MW m−2, which leads to a value of the non-parallel heat of q∦= (1.84 ± 0.38) MW m−2. In this case, its fraction of the normal heat, q∦ 0.3 max(qn), is even larger than in the case of the L-mode pulses.
The increased heat flux density measured on the shad-owed lamella surface in H-mode compared to L-mode can be explained by the contribution of the ELMs. Figure 21 com-piles the heat flux profiles for the ELM and inter-ELM heat loads, compared with the time-averaged profile. The heat flux in the shadowed region is much larger during ELMs, which might be related to an increased ion temperature. Further sim-ulation of the Larmor effects during ELMs would be required to test this hypothesis. It should be noted, however, that the evaluation of the inter-ELM profile on this shadowed lamella tile is prone to a large error, since the toroidal heat redistribu-tion due to ELMs affects the measurement of q2D for at least 0.01 s after an ELM event. On the other hand, the dominant ELM effect has a practical benefit, as it allows using the same value for q∦
q for both ELM and inter-ELM loads. It will be shown in the forward analysis that this assumption leads to a
very accurate prediction of both the ELM temperature rise and the global lamella behaviour during 3D forward simulation.
The results for q including ELM and inter-ELM are shown in figure 22. These are calculated independently for the sloped and standard lamella, in a similar way as performed for the L-mode case (see figure 13). When the profiles are extracted using the strict optical approach, a large difference is observed. If the background and non-parallel contributions are used in correcting each of the profiles, the ratio between the calcu-lated parallel profiles approaches unity within an error margin of 10%. It is worth noting that the value for q∦ corresponds just to 1.9% of the maximum q , even after the latter is cor-rected (see 1.2% in the L-mode case).
To further confirm the observed differences between the strict and corrected projections, 3D forward analysis has been performed using the q reconstructed from the standard lamella measurements. A time step of 0.13 ms has been used, corresponding to the 7.8 kHz rate of the IR cameras. Such a small time step is needed to capture the fast transients of the H-mode, and explains the improved reconstruction of the temperatures compared to the simulations performed for the L-mode shots of the sloped lamella (figure 14), which used a larger time step of 34 ms. Figure 23 shows the results for each projection, along with the IR measurements. This very close match between the simulated surface temperature for the corrected projection of q and the IR measurement is a good demonstration of consistency of the approach. In addition, it is important to note that the simulation results using the strict optical projection would predict generalized melting of a large portion of the sloped lamella, which was not observed exper-imentally in this particular discharge.
In order to further test the accuracy of the corrected projec-tion, two of the pulses for each experiment (leading edge and sloped lamella) where melting occurs have also been analysed. In the case of the 2015–16 experiment, the simulated temper-atures are compared to the IR measurements in figure 24, showing again a perfect match until the onset of melting. The change of emissivity once the melting begins affects the IR measurements, and from that point on the match is lost.
Finally, figure 25 compares the melted profile obtained by the forward simulation with the optical image of the lamella taken in situ immediately after the first pulse in which melting Figure 19. Inverse analysis q2D heat flux profiles during H-mode
pulse 89445 for standard and sloped lamella. Time averages every 0.5 s. Vertical solid line indicates the separation between the sloped and standard sections of the lamella.
Figure 20. Time averaged heat flux reconstruction profiles q2D for
H-mode pulse 89445 on the shadowed lamella during (t < 14.5 s) and after (t > 15 s) Stack A excursion.
Figure 21. Time averaged heat flux during H-mode pulse 89445 for the shadowed lamella (t = 53–54.5 s) with breakdown of the inter-ELM and inter-ELM contributions.
was observed. Both the location and the shape are very well captured. The minor discrepancies between the actual melt profile and that inferred from the thermal analysis are likely due to the limited applicability of the formulation used for the forward analysis, which does not take into account any latent heat of fusion, thermionic emission, or vapour shielding effect.
3.2.2. 2013 melting experiment. The correction presented for the H-mode heat flux derived from the sloped lamella in the previous section is now applied to the leading edge geometry
in the older experiment. The pulse under study, 84779, cor-responds to the first discharge in which melting was observed. The profiles for q are obtained following the same pro-cedure and correction values used for the L-mode study (see figure 15). Figure 26 compares the time-averaged parallel heat flux (including both ELM and inter-ELM contributions) between the previous analysis using the THEODOR code [5] and the new ALICIA calculation using the corrected models. For the latter, both the strict optical and fully corrected projec-tion are shown. In this case, the two inverse codes differ only by 10%, so that the main differences observed correspond to the procedure for extracting the parallel heat flux component. Figure 22. Comparison between parallel heat flux for standard and
sloped lamellas using strict optical and corrected projection (upper), and ratio between measurements for each projection (lower). Time average profiles between 13–14.5 s, including ELM and interELM contributions.
Figure 23. Temperature evolution of the measured and 3D forward analysis top surface temperature at the maximum heat flux density section (sa = 14 mm) of the sloped lamella during H-mode pulse 89445. The thermal analysis is performed for both the strict optical and corrected optical projection of q .
Figure 24. Maximum temperature evolution for sloped lamella during H-mode pulse 91965. Comparison between IR temperatures and 3D FEM forward analysis results using strict optical projection and corrected optical q . Melting onset during ELM at t = 13.144 s.
Figure 25. 3D temperature distribution for the sloped lamella during H-mode pulse 91965 where melting occurred. Results obtained by forward analysis using the ANSYS code and the corrected optical projection. Damage profile prediction (upper) compared to the real damage captured by a visible light camera after the pulse (lower).
The factor of 0.4 between the corrected optical profile (green curve in figure 26) and the original THEODOR analysis without any correction (red curve) was precisely the value required by MEMOS code to match the observed melt profile during the leading edge lamella exposure [7].
Post-mortem analysis of the leading edge lamella concluded that the observed topological damage was a consequence of ELM-induced flash melting [5]. A forward analysis using full 7.8 kHz IR signal has been run for the new profiles of the par-allel heat flux density projected with and without correction. The maximum temperature is achieved for all cases on the edge of the lamella, about 1/3 of the lamella length from the inboard side. The time evolution of this maximum temper ature is shown in figure 27. When no correction is applied, the temper-atures are much higher than the tungsten melting temper ature (3400 °C). Only the corrected heat flux is consistent with the occurrence of transient melting during the ELMs.
3.3. Discussion
The application of the methodology developed in the previous section has led to an explanation for the mismatch observed for protruding lamellas in the JET tungsten outer divertor target. The original apparent reduction factors referred to the ratio q forward
q IR , representing how much the parallel heat flux den-sity measured onto a standard lamella needed to be reduced in order to obtain the correct behaviour of the forward FEM thermal models of the special lamellas. The JET 2013 experi-ment required ratios of 0.2 in L-mode and 0.4 in H-mode [6]. For the L-mode case, the analysis of the new pulses along with the reinterpretation of the previous experiment has increased the ratio between the required forward load and the previous interpretation of q to ∼0.5. Figure 28 represents the corrections applied to the standard lamella heat flux meas-urements, and shows how the impact of the corrected optical projection explains almost all of this observed difference. The parallel heat flux is similar for the twin pulses 89162 and 84514, and at the same time agrees with the results presented in [14] within an error margin of 10%. What is more, all the
forward analyses are consistent with the corrected reconstruc-tion of the parallel heat flux density using the IR temper-atures, confirming the overestimation of q using the previous interpretation.
The new H-mode analysis reveals a higher influence of the non-parallel heat component. The breakdown between inter-ELM and inter-ELM contributions in the shadow region behind the sloped lamella concludes that ELMs are responsible for the increase of the non-parallel heat flux density component with respect to that calculated for L-mode shots.
The proposed correction of the parallel heat flux is based on the direct measurement of both the background and a non-parallel power density. The origin of this non-non-parallel frac-tion is unknown, and might be a combinafrac-tion of a number of possible contributors which this article does not attempt to unravel. Further physics studies, both experimental and theor-etical, will be required to elucidate the potential mechanisms. Nevertheless, the correction has proven to work in modelling the behaviour of up to four different geometries in several plasma conditions. The relative values between the different measurements for each pulse are summarized in table 1. Figure 26. Comparison of the previous interpretation of the
H-mode q using THEODOR and no correction, with the strict optical and corrected optical projections calculated using the new ALICIA inverse code along with the proposed corrections (time average for the maximum temperature interval, between 12.0–13.5 s).
Figure 27. Maximum temperature evolution for the leading edge lamella during H-mode pulse 84779 where flash melting was observed. 3D FEM forward analysis results with strict optical projection (predicting bulk melting) and corrected optical q
(predicting flash melting by ELMs).
Figure 28. Parallel heat flux q
q previous ratios with respect to the previous interpretation once the inverse analysis errors have been removed. Differences represent the effects of proposed geometrical (fq, fm reduction shown by the red bars) and optical projection (q∦
The ratios between the non-parallel and parallel heat flux may seem almost negligible—they are indeed close to the value of ∼0.5% reported by much earlier studies on DIII-D [25]—but not when compared to the tile surface flux. Overall, it has been shown that the q∦ component plays a major role in the characterization of the heat flux density.
Once the errors found during the inverse analysis stage have been corrected, the impact of the proposed model on the divertor heat loading can be isolated. As shown in figure 28, a larger reduction of the parallel flux is found for the H-mode pulses. Figure 29 shows how the non-parallel fraction impacts the ratio between q and qn at different solid angles. The rela-tive effect with respect to the typical optical projection is more important as the impinging angle gets shallower. For typical high-power operations with an angle of 2°, the calculated L-mode parallel heat flux is 25% lower than expected (blue line in figure 29), while the reduction in H-mode goes up to 35% (green line in figure 29).
The effects of the optical corrected projection for the JET divertor tile arrangement for a given SOL power are
two-fold. First, the tile heat flux density during H-mode dis-charges is predicted to be 10% lower for the typical range of JET toroidal wetted fraction, TWF = [0.6, 0.8], compared to the value given by the strict optical projection. Second, this corrected optical projection model leads to 1/3 less sensitivity to tolerance effects, as represented in figure 30
showing the effect of the impinging angle on the normalized heat flux density.
Diagnostic issues cannot be ruled out in the measurement of q∦ in the shadowed lamella, but even if there were errors affecting the measurements at the shadowed region, it would not affect the important reduction of q reported here as the parallel heat flux is derived from the temperature measure-ments on the standard lamellas. These lamellas are monitored by several IR protection cameras from different angles—all of them agreeing within 50 °C. In addition, the reduction of the parallel heat flux is particularly required to explain the melting observations on the leading edge and sloped lamellas. The nature of q∦ will need to be confirmed in further experi-ments, since its effect on the reduction of divertor heat loads is currently not understood in terms of our knowledge of divertor physics and plasma transport.
4. Summary and conclusions
The typical procedure for the reconstruction of the normal power flux density onto a divertor tile, qn(r, t), is to perform an inverse analysis of the temperature evolution along a poloidal profile. For attached plasma conditions, the heat density car-ried by the SOL is then calculated as q =qn/sin(θ), where θ is the angle between the magnetic lines and the tile surface. This paper has shown that both stages need significant adjust-ments when dealing with the particularities of a complex bulk W target such as that installed in the JET outer divertor region.
Two corrections need to be applied to the measured qn prior to the calculation of the parallel heat flux at the standard lamellas. The first correction is related to purely geometrical effects, and already accounts for a 24% reduction of qn. It is a consequence of the arrangement of the individual lamellas making up each divertor tile and the geometrical structure of each lamella. The effect on the thermal response has been Table 1. Ratio between the different measured and calculated
components of q , with qn the heat flux density at the tile, measured
at a standard lamella, and qn,sh the heat flux density at the magnetic shadow. Mode (pulse number) qn,sh qn q∦ qn,sh q∦ qn q∦ q L-mode (89162) 0.22 0.94 0.20 0.012 H-mode (89445) 0.35 0.80 0.28 0.019
Figure 29. Ratio between q /qn for the optical and corrected
projections in L-mode and H-mode (upper). Values normalized to the strict optical projection (lower) give the apparent reduction factors due to the plasma heat load projection model.
Figure 30. Effect of angular misalignment on the tile heat flux qn,
normalized to the values of the heat flux corresponding to an angle of 2°.
reduced to two factors: a power factor, fq, and a mass factor,
fm. The first takes into account the extra power arriving at each
lamella due to the gaps between them. Its value of fq = 0.85 is
deduced by the ratio between the toroidal length of the lamella (Lt=5.5 mm) and the separation between equivalent points in successive lamellas (Lt+gap = 6.5 mm). The second is related to the difference of the underlying 2D model used for the inverse analysis and the real 3D geometry of the lamella. A study has been performed comparing the behaviour between both (2D model and 3D lamella), leading to an averaged value of fm = 0.9.
A second, more striking effect, modifies the relation between qn and q in an unexpected way. During the JET melting experiments performed during 2015–2016, the magn-etically shadowed region downstream of a specially sloped lamella was used to precisely measure the value of a non-par-allel heat flux density component q∦. The origin of this non-parallel component is unknown, but it is much higher than the ‘background’ heat flux density measured when the strike point is moved away from the lamella. Its contribution to the tile heat flux is found to be 20% of qn for L-mode, and almost 30% for H-mode. The existence of this important non-parallel channel is confirmed by the results obtained using the cor-rected optical projection for three different measurements: (i) The parallel heat profiles calculated by a 2D inverse
analysis model using the IR temperatures from different lamella geometries match perfectly for L-mode and H-mode, even for similar pulses performed within dif-ferent experiments.
(ii) The 3D forward thermal simulations are an excellent match to IR measurements for the surface temperature evolution, and also for the ELM temperature peaks. (iii) The moment of melting onset of the protruding edges can
be accurately predicted.
The corrections apply to both L- and H-mode discharges, and have been measured for a wide range of values of input power (3–28 MW). The maximum power density calcu-lated for ¯q (time average including ELM and interELM contributions) is 100 MW m−2, which is ∼40% of the typ-ical values reported in the past for the JET outboard target. This provides an explanation for the apparent reduction observed in [6].
In addition to the experimental interpretation, the new analysis approach and corrections proposed here predict up to 10% lower tile surface heat flux for a given JET total SOL power, and reduce by 1/3 the sensitivity of the maximum heat flux density to misalignment tolerances.
Acknowledgments
This work has been carried out within the framework of the EUROfusion Consortium and has received funding from the Euratom research and training programme 2014–2018 under grant agreement No 633053. The views and opin-ions expressed herein do not necessarily reflect those of the European Commission or of the ITER Organization.
Appendix. Detail and validation of the forward analysis
A.1. Forward analysis models
The complicated parabolic profile of the standard lamella [26] shown in figure 8 is usually simplified either neglecting local shadowing effects [27], or—when including them—consid-ering the load on the wetted surface as a constant heat flux [28]. For the present simulations, the non-flat surface shadow is modelled with a constant slope. Its behaviour is perfectly equivalent to the parabolic profile once the pixel size of the IR camera diagnostic measuring the surface temperature on JET is taken into account. To ensure consistency between this simplification and the real parabolic distribution, the toroi-dally integrated power density is matched between the two, also taking into account the variable shadow length produced by the poloidal variation of the impinging angle. Figure A1
shows the toroidal section of the 3D geometry used for for-ward analysis, along with its equivalent section on the inverse models. A direct integration of the power in both models leads to:
5.5q2D=1.5qn+ 1.7 cos(α)qslope,
(A.1) where a shadow length of 1.6 mm has been assumed.
The real shadow depends on the impinging angle, and is variable along the lamella. Nevertheless, the 3D models used for the forward analyses have a constant shadow. The approx-imated geometry and shadow models have been validated, and are applicable whenever the thermal gradient inside the lamella is vertical. Since the heat flux density variation in time is smooth, this situation holds for all the L-mode forward sim-ulations. For H-mode shots, the load in the sloped section is adjusted using the following rule:
when the exact—radially variable—length (ln,shadow(r)) is used, then the value of the load at a slope angle α can be cal-culated by: qslope= 5.5 q2D− 1.5 qn 3.3 − ln,shadow cos(α) =qn sin(θ + α) sin(θ) . (A.2) The assumption of a shadow with constant length (1.6 mm for the standard lamella was taken) is valid only if the power is matched between the two models. This condition allows the calculation of the equivalent load to be applied in the forward 3D models for the standard lamella:
qslope=5.5 q2D1.7− 1.5 qn cos(α) = 4.2251.7 q2D cos(α). (A.3) Note that in order to satisfy the toroidal power balance, the exact length of the shadow needs to be calculated for complex heat flux profiles (i.e. using the real parabolic profile). It might be thought that these models would lead to a higher precision, but tests have shown that the numerical error due to the inac-curate application of the highly non-linear load leads to even poorer results. In the present case, where a constant slope and shadow length is used, the discretized model can be meshed to precisely match the shape of the loaded patch. If the real length
of the shadow is required, its value can easily be obtained by substituting equation (A.1) into equation (A.2):
ln,shadow=3.3 −4.2250.85 sin(θ) cos(α)sin(θ + α) .
(A.4)
A.2. Validation
Synthetic comparisons between the 2D inverse models—with the geometrical factors—and the 3D forward analysis meshes have been performed to ensure the validity of the procedure used to extract the heat fluxes. An initial synthetic profile is defined for qn which is projected onto a 3D finite element ANSYS [29] model of the lamella using variable magnetic impinging angles. The resulting 3D simulation temperature evolution is then plugged into ALICIA [16] to obtain q2D, and the proposed geometrical factors are applied to calculate qn.
It is worth clarifying the applicability of each model. Due to computational limitations, 2D models can have more refined meshes close to the surface of the lamella but neglect any toroidal heat flow inside the material. This initial consid-eration means that 2D models are in principle more suitable for capturing fast transients such as ELMs, but will lack the toroidal heat redistribution that appears on longer timescales. The element sizes required for the 2D ALICIA model to cap-ture Heaviside functions representing worst-case ELMs are as low as 50 μm. This value also depends on the time step of the analysis, and is valid up to the maximum MWIR camera fre-quency, fmax=7.8 kHz, used for H-mode shots.
For this validation case, the commonly employed convolu-tion of a Gaussian with an exponential funcconvolu-tion [13] is used to represent the divertor poloidal heat flux density profile. An L-mode simulation is run for a 2 s duration. The H-mode con-sists of a shorter analysis but includes two ELM events of 1 ms duration at a frequency of 25 Hz.
The L-mode validation test shows that the 2D model suf-fers an initial overshoot as shown in figure A2 during the time when the toroidal temperature profile develops. The typical MTF spreading of the JET IR system [30] is simulated with a Figure A1. Toroidal section for 2D inverse (left) and 3D forward analysis models of the standard lamella, representing the loading
assumptions.
Figure A2. Standard lamella L-mode validation test: 3D forward model temperature distribution (upper), time evolution of the maximum heat flux (centre), and profiles (lower).
5% smoothing of the temperatures. After a period of around 0.5 s, the heat flux is stabilized and the match between models is very good, confirming the validity of the geometric factors fm and fq. The main source of errors relates to the differences
in shape at the high field side of the lamella, as shown in the comparison between the 2D model and the exact lamella geometry in figure 7.
The H-mode validation has been also successful, with two different effects shown in figure A3 being worth explaining in detail:
• The overshoot in the L-mode validation due to the toroidal heat transient has a smaller effect, but its counterpart appears as an undershoot after an ELM which can lead to apparent negative fluxes of q2D. Their effect is more cosmetic, since under- and overshooting compensate each other, leading to a consistent balance of energy.
• The ELM loading evolution does not match perfectly due to the limitations of the 3D model. It has been checked that the apparent damping of the load is due only to a numerical effect and not to any transient toroidal heat flow. Even with these limitations, the peak flux value is captured well over the expected time scale of JET ELMs. Since this effect appears at both the rise and fall of the ELM, the energy of the system is preserved in a similar fashion as in the case of overshoot, but on a much shorter timescale.
Validation and comparison tests between 2D inverse codes can be found in [16] both for synthetic and real data.
ORCID iDs
J.W. Coenen https://orcid.org/0000-0002-8579-908X
R.A. Pitts https://orcid.org/0000-0001-9455-2698
K. Krieger https://orcid.org/0000-0003-0427-8184
References
[1] Matthews G.F. et al 2011 Phys. Scr. T 145 014001
[2] Matthews G.F. et al 2007 Phys. Scr. T 128 137–43
[3] Mertens P. et al 2009 Fusion Eng. Des. 84 1289–93
[4] Riccardo V. et al 2011 Fusion Eng. Des. 89 1059–63
[5] Coenen J.W. et al 2015 Nucl. Fusion 023010 55
[6] Arnoux G. et al 2015 J. Nucl. Mater. 415–9 463
[7] Pitts R. et al 2017 Nucl. Mater. Energy 12 60–74
[8] Dejarnac R. et al Nucl. Fusion 58 066003
[9] Corre Y. et al 2014 Nucl. Fusion 54 013013
[10] Nespoli F. et al 2017 Nucl. Fusion 57126029
[11] Eich T. et al 2011 Phys. Rev. Lett. 107 215001
[12] Makowski M.A. et al 2012 Phys. Plasmas 19 056122
[13] Eich T. et al 2013 J. Nucl. Mater. 438 S72–7
[14] Corre Y. et al 2017 Nucl. Fusion 023010 55
[15] Balboa I. et al 2012 Rev. Sci. Instrum. 83 10D530
[16] Iglesias D. et al 2017 Fusion Eng. Des. 145 71–6
[17] Herrman A. 2001 Limitations for divertor heat flux calculations of fast events in tokamaks Proc. 28th EPS
Conf. on Controlled Fusion and Plasma Physics
[18] Herrman A. et al 1995 Plasma Phys. Control. Fusion 37 17
[19] Abaqus 6.13 2013 ‘Abaqus Documentation’, Dassault Systèmes Simulia Corp, Providence, RI, USA [20] Komm M. et al 2013 Plasma Phys. Control. Fusion
55 025006
[21] Dejarnac R. et al 2014 Nucl. Fusion 54 123011
[22] Coenen J.W. et al 2017 Phys. Scr. T 170 014013
[23] Huber A. 2011 J. Nucl. Mater. 415 S566–9
[24] Matthews G.F. et al 2017 Nucl. Mater. Energy 12 227–33 [25] Matthews G.F. et al 1991 Nucl. Fusion 31 1383–5
[26] Mertens P. et al 2011 J. Nucl. Mater. 415 S943–7
[27] Mertens P. et al 2011 Phys. Scr. T 145 014002
[28] Grigoriev S. et al 2009 Fusion Eng. Des. 84 853–8. [29] ANSYS R Academic Research, Release 16.2, Help System,
Thermal Analysis Guide, ANSYS, Inc.
[30] Rigollet F. et al 2013 Quant. Infrared Thermography J. 10 96–111
[31] Litaudon X. et al 2017 Nucl. Fusion 57 102001
Figure A3. Standard lamella H-mode validation test: reconstructed heat flux map (upper), time evolution of the heat flux at the peak flux section (centre), and maximum heat flux detail for the second synthetic ELM (lower).