HAL Id: hal-01686477
https://hal.archives-ouvertes.fr/hal-01686477
Submitted on 17 Jan 2018HAL is a multi-disciplinary open access archive for the deposit and dissemination of sci-entific research documents, whether they are pub-lished or not. The documents may come from teaching and research institutions in France or abroad, or from public or private research centers.
L’archive ouverte pluridisciplinaire HAL, est destinée au dépôt et à la diffusion de documents scientifiques de niveau recherche, publiés ou non, émanant des établissements d’enseignement et de recherche français ou étrangers, des laboratoires publics ou privés.
Solid-liquid co-existent phase process: towards fully
dense and thermally efficient Cu/C composite materials
Clio Azina, Jerome Roger, Anne Joulain, Vincent Mauchamp, Bruno
Mortaigne, Yongfeng Lu, Jean-François Silvain
To cite this version:
Clio Azina, Jerome Roger, Anne Joulain, Vincent Mauchamp, Bruno Mortaigne, et al.. Solid-liquid co-existent phase process: towards fully dense and thermally efficient Cu/C composite materials. Journal of Alloys and Compounds, Elsevier, 2018, 738, pp.292-300. �10.1016/j.jallcom.2017.12.196�. �hal-01686477�
1
Solid-liquid co-existent phase process: towards fully dense and thermally
efficient Cu/C composite materials
Clio Azina,a,b Jérôme Roger,c Anne Joulain,d Vincent Mauchamp,d Bruno Mortaigne,e Yongfeng Lu,b Jean-François Silvaina,b
a CNRS, University of Bordeaux, ICMCB, UPR 9048, F-33600 Pessac, France
[email protected] ; [email protected]
bDepartment of Electrical and Computer Engineering, University of Nebraska-Lincoln,
Lincoln, Nebraska 68588-0511, United States
cUniversity of Bordeaux, Laboratoire des Composites Thermostructuraux (LCTS), UMR 5801,
33600 Pessac, France
dInstitut Pprime, CNRS–Université de Poitiers-ENSMA, UPR CNRS 3346, Téléport 2,
Futuroscope Chasseneuil, France
[email protected] [email protected]
eDGA/DS/Mission pour la Recherche et l'Innovation Scientifique, 92221 Bagneux, France
ABSTRACT:
Metal matrix composites are currently being investigated for thermal management applications. In the case of a copper/carbon (Cu/C) composite system, a particular issue is the lack of affinity between the Cu matrix and the C reinforcements. Titanium-alloyed Cu (Cu-Ti) powders were introduced in a Cu/C powder mixture and sintered under load at a temperature at which the Cu-Ti powders became liquid, while the rest of the Cu and C remained solid. Fully dense materials were obtained (porosity of less than 5%). The creation of regular and homogeneous interphases was confirmed. All Ti reacted with the carbon, hence purifying the Cu matrix. Thermal conductivities were enhanced as compared with the Cu/C composites without interphase. The chemical analyses are in agreement with thermodynamic simulations carried out to predict the phase transformation during the sintering process.
KEYWORDS: metal matrix composites, solid-liquid co-existent phase process, heat
2
1. Introduction
Heat sink materials are currently under intensive investigation as they could allow increased power densities in microelectronic components as well as promote the miniaturization of devices. Materials with high thermal conductivities (TC) and low coefficients of thermal expansion (CTE) are required for these applications. Currently, copper (Cu) or aluminum (Al) heat sinks are being used. However, the large CTE mismatch between the heat sink materials and the ceramic and silicon parts of the components causes thermomechanical stresses at the interfaces and results in component failure after a certain number of thermal cycles.
To overcome this challenge, we conducted research to replace the Cu and Al heat sinks with metal matrix composites (MMCs), more particularly, Cu matrix composites reinforced with carbon (C) [1]. By combining the high TCs of both entities and their drastically different CTEs, one can expect to obtain thermally conductive materials with adaptive properties.
The proper transfer of properties in MMC composites is often compromised by the absence of an effective interface, especially in nonreactive systems such as Cu-C. However, for a thermally conductive assembly, the interface should allow proper heat transfer between the two materials and efficient transfer of thermomechanical load during thermal cycling. That is only possible when there is a chemical bonding between the two materials [2].
Several studies have focused on the insertion of carbide-forming elements to induce a chemical interaction between the matrix and the reinforcements. The carbide-forming elements are used either as a coating for the reinforcements [3-5] or as alloying elements of the matrix powders [6-9].
Q. Kang et al. investigated tungsten carbide (WC) coatings on diamond particles to improve the interfacial bonding between Cu and diamond [10]. The presence of the coating increased both the relative density of the composites and the TC. J. Li et al. chose to use a zirconium (Zr)-alloyed Cu matrix [11]. The TCs obtained vary with the thickness of the zirconium carbide (ZrC) interphase. Although homogeneous carbide interphases are easily obtained by coating the reinforcements prior to sintering, the alloying of the matrix is not always as successful, resulting in inhomogeneous interphases or the creation of solid solutions and intermetallics in the matrix which affect the thermal properties of the final MMC materials [9].
3
Our investigation focused on the synthesis of composite materials with carbide interphases by alloying of the matrix. The process used is well known in Al-based composites [12] and is called the solid-liquid co-existent phase process. To our knowledge, however, the process has never been used for Cu-based MMCs. The presence of the liquid phase has been shown to enhance the reactivity between the carbide-forming elements and the carbon reinforcement as well as the density of the materials. In the case of Al-based composites, the liquid phase enhances the reactivity of Al with the reinforcement. In the case of Cu-based composites, we expect the liquid phase to enhance the reactivity of the additive with the C reinforcements.
2. Experimental
2.1. Thermodynamic assessments of the Cu-Ti-C system
Prior to experimental investigation, preliminary thermodynamic analyses of the equilibrium in the Cu-Ti-C system were performed with Thermo-Calc software [13]. The thermodynamic equilibria calculated from this software were based on the CALculation of PHAse Diagrams (CALPHAD) methodology [14,15]. The relevant thermodynamic descriptions of the Cu-Ti and Ti-C systems reported by J. Wang et al. and L.F.S. Dumitrescu et al., respectively, were used for the equilibrium calculations of the Cu-Ti-C system [16–18].
2.2.Composite materials
Materials in this work are composed of a Cu-based matrix and carbon fiber (CF) reinforcements. The Cu-based matrix is composed of a mixture of dendritic Cu powder (ECKA® Granules Germany GmbH), d
50 close to 35 m, and Cu-Ti alloyed powder, d50 close
to 16.7 m. The Cu-Ti alloy was produced by atomization with a composition of 27 at.% of Ti (NANOVAL GmbH & Co. KG). Differential thermal analysis of the alloy powder has shown that the melting temperature of the Cu-Ti powder is 888.5 ºC. Titanium was selected as the alloying element based on the favorable Gibbs free energy for the formation of titanium carbide (TiC). Carbon fibers (K223HM, CTN DIALEAD™/BOBBINS, Sumitomo Corporation Europe Limited) have an average length of 250 μm and an average diameter of 10 m. Powders were mixed in a Siemens 3D mixing device for 90 min at 20 RPM.
Two sets of composite materials were sintered: Set A, Cu/CF composites fabricated without Cu-Ti powders, and Set B, Cu(Cu-Ti)x/CF composites fabricated with Cu-Ti powders. The
sintering of the composites was carried out using a Termolab press. The powders were cold pressed in a carbon mold of 20 mm in diameter heated by an induction system. Powders for
4
Sets A and B were hot pressed at 650 and 950 °C, respectively, under 40 MPa for 30 min. After some tests of sintering Cu/CF composite materials at 950 °C and comparison with those sintered at 650 °C, no significant difference in thermal conductivity or density was observed. Therefore, the remaining Cu/CF composites were sintered at 650 °C to allow faster cooling. The temperature was controlled using a thermocouple inserted into the graphite mold close to the powder mixture. The chamber was evacuated (10-2 mbar range) to prevent oxidation during both heating and cooling. Composites with 10 to 60 vol% of CFs were densified. The amount of liquid Cu-Ti phase in Set B varied from 2 to 10 vol%. The pellets were then machined to obtain pellets with a diameter of 6 mm and thicknesses varying from 3 to 6 mm.
Table 1: Atomic fractions and ratios of Cu, Cu-Ti, and C in the composite materials for each volume fraction of Cu-Ti.
Vol% of Cu-Ti Cu Cu-Ti CF Ratios Cu : Cu-Ti : C At% 2 0.518 0.016 0.466 32 : 1 : 29 4 0.502 0.031 0.467 16 : 1 : 15 6 0.485 0.047 0.468 10 : 1 : 10 8 0.469 0.063 0.468 7 : 1 : 7 10 0.452 0.078 0.470 6 : 1 : 6 2.3. Density calculations
The theoretical density of the composites was calculated using the rule of mixture given below:
𝜌𝐶 = 𝜌𝑚∙ 𝑉𝑚+ 𝜌𝐶𝑢−𝑇𝑖∙ 𝑉𝐶𝑢−𝑇𝑖+ 𝜌𝑟∙ 𝑉𝑟, (1)
where ρm, ρCu-Ti, ρr, and Vm, VCu-Ti, Vr are the densities and the volume fractions of the matrix,
Cu-Ti alloy and reinforcement, respectively. Experimental measurements were carried out using the Archimedes’ method.
2.4. Microstructural, structural, and chemical characterization
The microstructure of the Cu/CF composites was characterized using scanning electron microscopy (SEM, VEGA II SBH, TESCAN). The samples were coated with resin and then polished (TegraPol 21, Struers) using silicon carbide (SiC) sandpapers and diamond pastes prior to SEM analyses. Chemical analyses were carried out using energy dispersive X-ray
5
spectroscopy (EDS, Apollo X, EDAX Inc.). The 10% enriched-CF samples were also investigated using transmission electron microscopy (TEM) with particular attention paid to the interphase between the CF and the Cu matrix. Electron diffraction patterns and TEM-EDX analyses were performed on a JEOL 2100 LaB6, 200 kV, on TEM lamellae prepared by ion
milling and polishing. Transmission electron microscopy foils were thinned by mechanical polishing down to 30 µm using the Tripod technique and subsequently glued on molybdenum grids. They were further thinned with a precision ion polishing system (PIPS) from Gatan, Inc. In addition, a detailed chemical analysis based on electron energy loss spectroscopy (EELS) [23] was also performed using a JEOL 2200FS microscope (200 kV, energy resolution of 0.9 eV) equipped with an omega filter on cross-section samples prepared using a field-emission gun scanning electron microscope (SEM-FEG) equipped with a focused ion beam (FEI Helios NanoLab™ G3CX Dualbeam™). Being a powerful tool for light element analysis, EELS is very complementary to EDX in terms of chemical analysis. In particular, the atomic concentration ratio [Ti/C] in the interphase was determined from the recorded spectra according to the following relation:
[𝑇𝑖 𝐶⁄ ] = 𝐼𝑇𝑖(∆).𝜎𝐶(𝛽,∆)
𝐼𝐶(∆).𝜎𝑇𝑖(𝛽,∆) (2) where 𝐼𝑖(∆) is the integrated area over the energy range Δ under the edge of element “I,” and
σi(β,Δ) is the corresponding atomic cross-section calculated for an acceptance angle β. In the
present study, Hartree-Slater cross-sections were used; and an energy range of 35 eV with a 20 eV offset from the edge onset, was considered (these parameters were optimized on reference TiC samples). In addition, the fine structures observed at the different core level edges (i.e., the C K, Ti L2,3,and Cu L2,3 edges) provided information on chemical bonding,
valency, or local order around the excited atom [19]. X-ray diffraction patterns were collected on a PANalytical X’pert PRO MPD diffractometer. The patterns were analyzed using EVA software (Bruker) and structural refinements were done using the FullProf software package [20].
2.5. Thermal characterization
The thermal conductivities of the composites were evaluated using the following equation:
6
where K is the thermal conductivity of the composite, α is the thermal diffusivity, ρC and Cp are the density and the specific heat capacity of the composite, respectively. The thermal diffusivity was measured at 70 °C using a laser flash apparatus (Netzsch LFA 457 MicroFlash®). The specific heat capacity was calculated using the following equation:
𝐶𝑝 = 𝑤𝐶𝑢𝐶𝑝𝐶𝑢+ 𝑤
𝑇𝑖𝐶𝐶𝑝𝑇𝑖𝐶+ 𝑤𝐶𝐶𝑝𝐶, (4)
where 𝐶𝑝 , 𝐶𝑝𝐶𝑢, 𝐶
𝑝𝑇𝑖𝐶, 𝐶𝑝𝐶 and wCu, wTiC, and wC are the specific heat capacities and weight
fractions of the composite, Cu, TiC, and C, respectively. To simplify the calculations, the weight fraction of TiC was considered to be equal to the weight fraction of Ti, which was inserted in the composite mixture, as we assume that all Ti reacted to form TiC.
3. Results and discussion
3.1. Thermodynamic calculations
Prior to the calculations regarding the reaction between Ti and C, defining a Cu-Ti alloy which melts at a temperature lower than the Cu melting temperature (1083°C) was a preliminary step. The Cu-rich side of the Cu-Ti calculated diagram is shown in Figure 1(a). At a temperature of 950 °C, which was used in the experimental procedure, it was found that a liquid phase was obtained for a Ti mole fraction comprised of between 0.15 and 0.40. Moreover, the eutectic composition was equal to 0.265 mole fraction of Ti. Consequently, the selected composition for the Cu-Ti alloy was rounded up to 0.27 mole fraction of Ti. The calculation of the isothermal section of the Cu-Ti-C diagram at 950 °C, shown in Figure 1(b), indicates that a reaction occurred between the liquid alloy and C to form titanium carbide (TiCx) with x = 0.97 for an excess of C. As the final volume percentage of TiC0.97 was
expected to be, at most, equal to 4% in the final composite and about 40% in CF, five compositions were identified. The expected volume percentage of TiC0.97 was then comprised
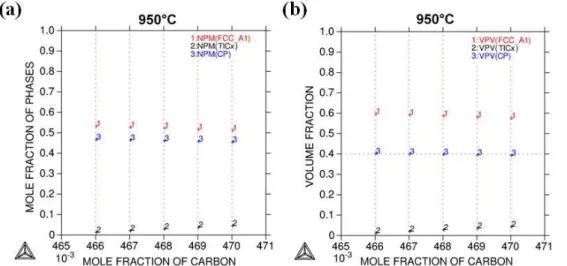
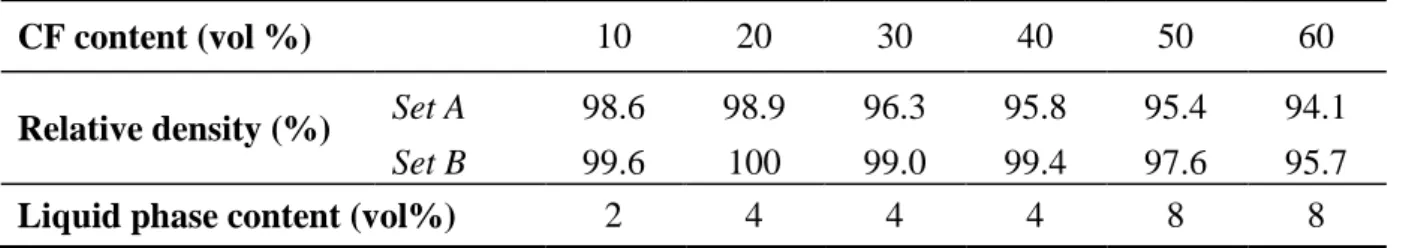
of between 0.8 and 4.0% in the composite. The corresponding compositions were indicated in the isothermal section by hourglass marks corresponding to the reaction between the liquid alloy and carbon and to the final composite (Figure 1 (c)). The mole and volume fractions of pure Cu (FCC_A1), TiC0.97, and CF within the final composite are given in Figure 2(a) and
(b), respectively. At 25 °C, as shown in Figure 3 (a) and (b), the calculations indicated that
the phases were pure Cu (FCC_A1), TiC0.99, and CF. The mole and volume fractions were
then practically similar at this temperature. These equilibrium calculations confirmed the occurrence of a reaction at the interfaces between the CFs and Ti-containing alloy to form
7
TiCx. The as-formed composite was mainly composed of pure Cu, CFs, and a low quantity of
TiCx phase, representing less than 4 vol%. The only variation identified by a temperature
change was an increase in the C content within TiCx when the temperature decreased.
Figure 1: Cu-Ti-C system: (a) Cu-rich side of the Cu-Ti phase diagram , (b) isothermal section at 950 °C, and (c) isothermal section at 25 °C [16–18].
(a)
(b)
25 °C
8
Figure 2: Equilibrium composition calculations of the five samples at 950 °C: (a) mole and (b) volume fractions of the phases.
Figure 3: Equilibrium composition calculations of the five samples at 25 °C: (a) mole and (b) volume fractions of the phases.
3.2. Solid-liquid co-existent phase process
Contrary to regular powder metallurgy processes, the solid-liquid co-existent phase process allows both solid and liquid phases to coexist. For the composite materials fabricated in this work, the liquid phase consisted of the Cu-Ti alloyed powders while the solid phase consisted of Cu dendritic powders and CF reinforcements. For this purpose, the Cu-Ti alloy needed to have a melting point lower than that of pure Cu. Therefore, the composition of the Cu-Ti alloyed powders was fixed to the composition of the eutectic transformation which occurred at 884 °C for a Cu composition of 73.5 at%. The sintering temperature was set to 950 °C, lower than the melting point of Cu (1083°C). One interesting point of this process is that the liquid can flow around the grains and infiltrate the pores created by the intertwining of CFs (a
9
downside of regular net-shaped processes with high reinforcement content). Furthermore, the diffusion and reactivity of the carbide forming species was enhanced, which allowed the carbide to be formed at lower temperatures and shorter time periods.
A schematic of the solid-liquid co-existent phase process is shown inFigure 4.
Figure 4: Schematic of the solid-liquid co-existent phase process. The initial powder mixture (Cu + Cu-Ti + CF) is sintered under 40 MPa at 950 °C. During the sintering plateau of 30 min, the Cu-Ti liquid phase is generated. At the end of the sintering program, the CFs are coated with a TiC interphase and are oriented in the plane perpendicular to the pressure axis.
3.3. Effect of the liquid phase on residual porosity
The theoretical and experimental relative densities of composites containing 10 to 60 vol% of CFs from Sets A and B are listed inTable 2. As expected, the relative density decreased with
an increase in the CF content, due to the increase in porosity caused by the intertwining of CFs. The relative density was higher for Set B composites as the Cu-Ti additive was present during sintering. We, therefore, confirmed that the liquid phase was formed during the sintering and existed sufficiently long to infiltrate the pores created. We have reached porosity levels as low as 4.3% for composites containing 60 vol% of CFs.
Table 2: Influence of the liquid phase on the Cu/CF relative density.
CF content (vol %) 10 20 30 40 50 60
Relative density (%) Set A 98.6 98.9 96.3 95.8 95.4 94.1
Set B 99.6 100 99.0 99.4 97.6 95.7
Liquid phase content (vol%) 2 4 4 4 8 8 Note: Set A–no liquid phase; Set B–Cu-Ti liquid phases of 2 to 8 vol%.
3.4. In-situ interphase creation
Figure 5 shows the SEM micrographs of the Cu/CF composites from Set B. The chemical contrast offered by the back-scattered electron mode of the SEM allows the interfacial zone
10
surrounding the CFs to be distinguished. The interphase created appears to be homogeneous and was present on a large amount of CFs.
Figure 5: SEM micrographs in back-scattered electron mode of Cu/TiCx/CF composites sintered with
(a) 4, (b) 8 , and (c) 10 vol% of Cu-Ti alloyed powders.
An energy dispersive X-ray spectroscopy (EDS) line scan across a coated CF, shown in
Figure 6, shows that the interfacial zone between the Cu matrix and the CF is rich in Ti. In addition, little or no Ti signal was observed in the matrix region which suggests that most of the Ti diffused to the CFs. To confirm this hypothesis, high resolution X-ray diffraction (XRD) data were collected for a 2 theta range between 30 and 65° on a bulk Cu/TiCx/CF20
composite. Le Bail type structural refinement was carried out to determine the lattice parameters of the Cu matrix. The XRD pattern is shown in Figure 7. The theoretical [21] and measured Cu lattice parameters (Bragg R-factor of 2.22) are listed in Table 3. There was no significant difference between the theoretical and the experimental lattice parameters which, therefore, confirms the absence of a solid solution of Ti in Cu for this composite.
11
Figure 6: EDS line scan obtained through the cross-section of a CF coated with a Ti-based interphase inside the Cu matrix.
Figure 7: High quality XRD pattern obtained from a Cu/TiCx/CF20 composite pellet, in a 2 theta
12 Table 3: Theoretical and calculated Cu lattice parameters.
a b c
Theoretical lattice parameters (Å) 3.615 3.615 3.615
Calculated lattice parameters (Å) 3.6189(9) 3.6189(9) 3.6189(9)
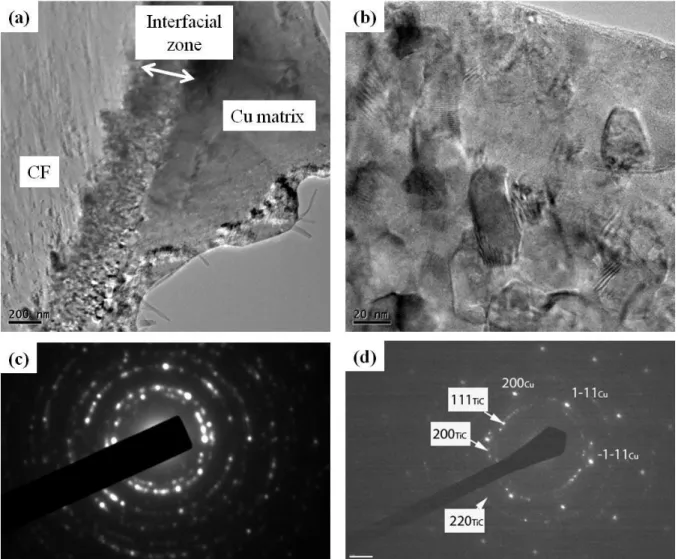
Figure 8(a) is a representative TEM image of a Cu/TiCx/CF10 composite which shows the
CF, the interfacial zone, and the Cu matrix. The interfacial zone is around 200 nm thick and is made up of facet-shaped nanograins (Figure 8(b)) of about 50 nm in size. No decohesion occurred at either interface (CF/interfacial zone or interfacial zone/Cu).
Figure 8: TEM images of Cu/TiCx/CF10 composite material. (a) Overall view of a CF, the interfacial
zone, and the Cu matrix, (b) enlarged interfacial zone of micrograph (a), where a polycrystalline structure is observed. (c) Electron diffraction patterns of interfacial zone and (d) an area where both the interfacial zone and the Cu matrix are present.
13
Figure 8(c) shows the electron diffraction pattern obtained in the interfacial zone. We
observed rings made up of discrete spots which are characteristic of nanocrystalline structures. The ring diameters corresponded to the TiC structure, while extra spots came from the Cu matrix. The diffraction pattern shown in Figure 8(d) was obtained from a selected area
containing both the interfacial zone and a Cu grain oriented along the [011] direction: TiC nanocrystalline spots are superimposed with the spots corresponding to the well-oriented microscopic Cu grains.
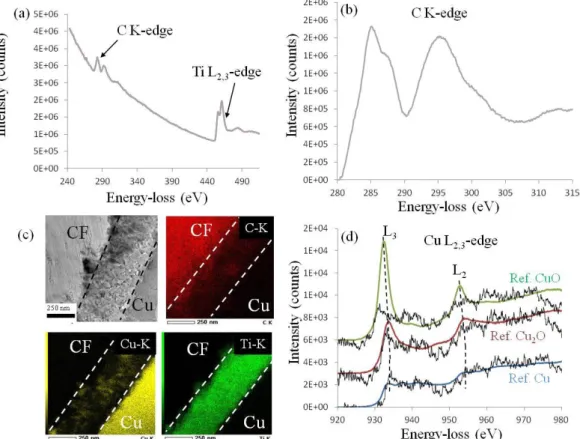
Figure 9 shows the EELS and EDX spectra collected on the interphase in the
Cu(CuTi)4/CF10 sample. For the EELS data, two different areas (~0.2–0.5 µm in diameter) of the interphase were investigated; and they presented very similar spectral features. As evidenced in Figure 9(a), the interphase contained both Ti and C: the quantification of the [Ti/C] atomic ratio deduced from the spectra (see Eq. 2) gives a composition between TiC0.95
and stoechiometric TiC. The fact that the measured TiC composition was almost stoechiometric is very consistent with the electron energy loss near edge structures (ELNES) at the C-K edge given in Figure 9(b). These fine structures were very similar to those reported by Calmels et al. [22] and, given the sensitivity of the C-K edge ELNES to alloying effects or vacancies [22–24], they confirmed that the local order around the C atoms is very close to that of pure TiC. Given that Cu was evidenced in the interphase region from EDX maps (Figure 9(c)), the energy range corresponding to the Cu L2, 3 edge was also investigated
by EELS. As shown in Figure 9(d), Cu (black line) was indeed present but in a very small concentration, which explains the poor signal-to-noise ratio. Given that the transition metal (TM) L2, 3 edge reflects the TM d-band filling, it is very sensitive to the valence of the
considered element. The Cu edge recorded in the interphase region was compared to reference spectra recorded in Cu, Cu2O, and CuO samples [25]. In addition to confirming the presence
of Cu, the comparisons provided in Figure 9(d) indicate that the Cu in the interphase region was in a rather metallic state. Figure 9(c) also shows the presence of C and Ti in the interphase zone. We noticed that no Ti was detected in the Cu matrix in the vicinity of the CF.
14
Figure 9: (a) EELS spectrum collected between 240 and 515 eV in the interphase area of the Cu(CuTi)4/CF10 sample. (b) ELNES at the C K-edge. (c) TEM bright field micrograph (left) and corresponding EDX map at the C-K edge (red), Cu-K edge (yellow), and Ti-K edge (green). The dashed lines indicate the boundary of the interfacial zone. (d) ELNES at the Cu L2,3 edge: the Cu edge recorded in the sample (black line) is compared to reference spectra obtained on Cu (blue line), Cu2O (red line), and CuO (green line), which were taken from [27]. For the sake of clarity, the reference spectra were vertically shifted, and the energy of the Cu edge onset was adjusted to that of the reference spectra.
3.5. Effect of the interphase on thermal conductivity
Theoretical thermal conductivity values of Cu/CF composite materials were calculated using the Fricke model [26], given below:
𝐾𝐶 = 𝐾𝑚[𝐾𝑟+(𝑛−1)𝐾𝑚−(𝑛−1)𝑉𝑟(𝐾𝑚−𝐾𝑟)
𝐾𝑟+(𝑛−1)𝐾𝑚+𝑉𝑟(𝐾𝑚−𝐾𝑟) ], (4)
where Kc, Km, and Kr are thermal conductivities of composite, matrix, and reinforcement
respectively; Vr is the volume fraction of reinforcement; and n is the shape factor of the
reinforcement. The shape factor was taken as 25 since it corresponded to the aspect ratio (250/10). The TCs of the Cu matrix and the CF reinforcement were set to be 385 and 277.5 W/K.m, respectively. Due to the random distribution of the CFs in the plane of measurement
15
(perpendicular to the pressure direction), the conductivity value of the CFs was taken to be the average of the conductivity along (550 W/K.m) and perpendicular to the CF axis (5 W/K.m).
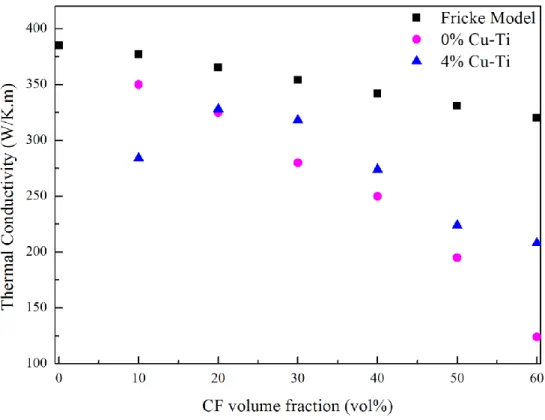
The thermal conductivities obtained using the Fricke model, for the composites of Sets A and B (with 4 vol% of Cu-Ti), are shown in Figure 10. As expected, the thermal conductivity decreased as the CF content increased since the CF conductivity was lower than that of the Cu matrix. The first observation is the drastic decrease in TC for 10 vol% CF when 4 vol% Cu-Ti was present in the material. The poor TC can be explained by the fact that the carbon within the composite was not sufficient to attract Ti towards it. Therefore, Ti has a tendency to remain in the Cu matrix as a solid solution. This tendency was verified by structural refinement of a high quality XRD pattern of the Cu/TiCx/CF10 composite. Only Cu peaks
were observed, and the calculated lattice parameter was equal to 3.62427(5) (Bragg R-factor of 0.184). We concluded that the expansion of the lattice was caused by the presence of Ti in a solid solution and explained the poor TC observed for 10 vol% of CF. It is known that the transport properties (thermal and electrical conductivities) of Cu-Ti solid solutions are lower than those of pure Cu. For example, for a solid solution of Ti in Cu that reaches 0.04 wt%, the electrical conductivity is much lower than that of pure Cu [27]. For CF content that exceeded 20 vol%, the TCs of Set B composites containing 4 vol% of Cu-Ti were higher than those of Set A. However, the values obtained for both sets were always lower than the TC values calculated with Fricke’s model.
16
Figure 10: Thermal conductivity values obtained for composites without (Set A) and with (Set B) 4 vol% of Cu-Ti, as well as theoretical values obtained with the Fricke model.
One can also observe the important slope mismatch between the Fricke model points and the measured points obtained for Sets A and B. This mismatch is indicative of the poor accuracy of the Fricke model for our composites. Indeed, the slope deviation here indicates that the CF orientation and the average assumed thermal conductivity of 277.5 W/K.m are not realistic. The deviation between Sets A and B composites can be explained by the creation of a strong interfacial bonding between the CF reinforcements and the TiC interphase (covalent bonding), as well as the one between the TiC interphase and the Cu matrix (metallic). The creation of such chemical interphases, in comparison with the mechanical one induced during cooling by the difference of CTEs between the CF and the Cu matrix in Set A materials, improves the heat transfer from the matrix to the reinforcement and vice-versa and thereby increases the final TC of the composite materials.
4. Conclusions
Cu/TiCx/CF composites were synthesized using the solid-liquid co-existent phase process
which involves the presence of a small fraction of liquid phase during the sintering process. We observed the in situ creation of homogeneous TiC interphases while the Cu matrix was purified during the process. The thicknesses of the interfacial zones increased with the amount
17
of liquid used. Copper/carbon fiber composite materials fabricated with the liquid phase showed higher relative densities than those fabricated without the liquid phase. Finally, the interfacial bonding enabled by the TiC interphase increased the thermal conductivities when compared to composites with mechanical bonding only.
AUTHOR INFORMATION
Corresponding Authors
Tel: +33(0)540008437, Fax: + 33(0)540008321, E-mail: [email protected]
Tel: +1(402) 472 8323, Fax: +1(402) 472 4732, E-mail: [email protected] ACKNOWLEDGEMENT
The authors thank Eric Lebraud and Dominique Denux of the Institut de Chimie de la Matière Condensée de Bordeaux for performing the XRD and DTA analyses, respectively. The authors thank Guillaume Amiard of the Pprime Institute in Poitiers for the FIB lamellae preparation and Julie Rousseau from the IC2MB institute in Poitiers for the XRD analysis. This work partially pertains to the French Government program “Investissements d’Avenir” (LABEX INTERACTIFS, reference ANR-11- LABX-0017-01). This work has been partially supported by the “Nouvelle Aquitaine” Region and the European Structural and Investment Funds (ERDF reference: P-2016-BAFE-94/95).
REFERENCES
[1] C. H. Zweben, “Advances in high-performance thermal management materials - A review,” J. Adv. Mater., vol. 39, no. 1, pp. 3–10, 2007.
[2] J.-F. Silvain, A. Veillere, J.-M. Heintz, C. Vincent, T. Guillemet, G. Lacombe, Y. Lu, and N. Chandra, “The role of controlled interfaces in the thermal management of copper-carbon composites,” Emerg. Mater. Res., vol. 1, no. EMR2, pp. 75–88, 2011. [3] J. Li, H. Zhang, Y. Zhang, Z. Che, and X. Wang, “Microstructure and thermal
conductivity of Cu/diamond composites with Ti-coated diamond particles produced by gas pressure infiltration,” J. Alloys Compd., vol. 647, pp. 941–946, 2015.
[4] Q. Kang, X. He, S. Ren, L. Zhang, M. Wu, C. Guo, W. Cui, and X. Qu, “Preparation of copper-diamond composites with chromium carbide coatings on diamond particles for heat sink applications,” Appl. Therm. Eng., vol. 60, no. 1–2, pp. 423–429, 2013. [5] Q. L. Che, J. J. Zhang, X. K. Chen, Y. Q. Ji, Y. W. Li, L. X. Wang, S. Z. Cao, L. Guo,
Z. Wang, S. W. Wang, Z. K. Zhang, and Y. G. Jiang, “Spark plasma sintering of titanium-coated diamond and copper–titanium powder to enhance thermal conductivity of diamond/copper composites,” Mater. Sci. Semicond. Process., vol. 33, pp. 67–75,
18 2015.
[6] V. Sinha and J. E. Spowart, “Influence of interfacial carbide layer characteristics on thermal properties of copper-diamond composites,” J. Mater. Sci., vol. 48, no. 3, pp. 1330–1341, 2013.
[7] Chung, Chih Yu, C. H. Chu, M. T. Lee, C. M. Lin, and S. J. Lin, “Effect of titanium addition on the thermal properties of diamond/Cu-Ti composites fabricated by pressureless liquid-phase sintering technique,” Sci. World J., vol. 2014, 2014.
[8] Q. L. Che, X. K. Chen, Y. Q. Ji, Y. W. Li, L. X. Wang, S. Z. Cao, Y. G. Jiang, and Z. Wang, “The influence of minor titanium addition on thermal properties of
diamond/copper composites via in situ reactive sintering,” Mater. Sci. Semicond.
Process., vol. 30, pp. 104–111, 2015.
[9] A. Veillère, A. Sundaramurthy, J. M. Heintz, J. Douin, M. Lahaye, N. Chandra, S. Enders, and J. F. Silvain, “Relationship between interphase chemistry and mechanical properties at the scale of micron in Cu-Cr/CF composite,” Acta Mater., vol. 59, no. 4, pp. 1445–1455, 2011.
[10] Q. Kang, X. He, S. Ren, T. Liu, Q. Liu, M. Wu, and X. Qu, “Microstructure and thermal properties of copper-diamond composites with tungsten carbide coating on diamond particles,” Mater. Charact., vol. 105, no. 1, pp. 18–23, 2015.
[11] J. Li, X. Wang, Y. Qiao, Y. Zhang, Z. He, and H. Zhang, “High thermal conductivity through interfacial layer optimization in diamond particles dispersed Zr-alloyed Cu matrix composites,” Scr. Mater., vol. 109, pp. 72–75, 2015.
[12] O. Beffort, F. A. Khalid, L. Weber, P. Ruch, U. E. Klotz, S. Meier, and S. Kleiner, “Interface formation in infiltrated Al(Si)/diamond composites,” Diam. Relat. Mater., vol. 15, no. 9, pp. 1250–1260, 2006.
[13] J.-O. Andersson, T. Helander, L. Hoglund, P. Shi, and B. Sundman, “Thermo-Calc & DICTRA, computational tools for materials science.,” CALPHAD Comput. Coupling
Phase Diagrams Thermochem., vol. 26, no. 2, pp. 273–312, 2002.
[14] N. Saunders, A. P. Miodownik, and Editors., Calculation of Phase Diagrams
(CALPHAD): A Comprehensive Guide. Elsevier, 1998.
[15] B. S. Hans Lukas, Suzana G. Fries, “Computational Thermodynamics The Calphad Method,” p. 324, 2007.
[16] J. Wang, C.-L. Liu, C. Leinenbach, U. E. Klotz, P. J. Uggowitzer, and J. F. Loffler, “Experimental investigation and thermodynamic assessment of the Cu-Sn-Ti ternary system.,” CALPHAD Comput. Coupling Phase Diagrams Thermochem., vol. 35, no. 1, pp. 82–94, 2011.
[17] L. F. S. Dumitrescu and M. Hillert, “Reassessment of the solubility of TiC and TiN in Fe.,” ISIJ Int., vol. 39, no. 1, pp. 84–90, 1999.
[18] L. F. S. Dumitrescu, M. Hillert, and B. Sundman, “A reassessment of Ti-C-N based on a critical review of available assessments of Ti-N and Ti-C.,” Zeitschrift fuer Met., vol. 90, no. 7, pp. 534–541, 1999.
19
[19] R. F. Egerton, Electron Energy-Loss Spectroscopy in the Electron Microscope, vol. 72, no. 1. 2011.
[20] J. Rodríguez-Carvajal, “FullProf: A Program for Rietveld Refinement and Pattern Matching Analysis,” Satell. Meet. Powder Diffr. XV Congr. IUCr, Toulouse, Fr., p. p.127, 1990.
[21] H. E. Swanson, R. K. Fuyat, and G. M. Ugrinic, Standard X-ray diffraction powder
patterns. IV. Data for 42 inorganic substances. 1955.
[22] L. Calmels, C. Mirguet, and Y. Kihn, “Evidence of alloying effects in TiCx N1-x compounds from calculated and experimental electron energy loss spectra,” Phys. Rev.
B - Condens. Matter Mater. Phys., vol. 73, no. 2, pp. 1–9, 2006.
[23] Y. Kihn, C. Mirguet, and L. Calmels, “EELS studies of Ti-bearing materials and ab initio calculations,” J. Electron Spectros. Relat. Phenomena, vol. 143, no. 2–3 SPEC. ISS., pp. 117–127, 2005.
[24] A. J. Scott, R. Brydson, M. MacKenzie, and A. J. Craven, “Theoretical investigation of the ELNES of transition metal carbides for the extraction of structural and bonding information,” Phys. Rev. B, vol. 63, no. 24, p. 245105, 2001.
[25] J. P. Ngantcha, M. Gerland, Y. Kihn, and A. Rivière, “Correlation between
microstructure and mechanical spectroscopy of a Cu-Cu2 O alloy between 290 K and 873 K,” Eur. Phys. J. - Appl. Phys., vol. 29, no. 1, pp. 83–89, 2005.
[26] R. L. Hamilton and O. K. Crosser, “Thermal Conductivity of Heterogeneous Two-Component Systems,” Ind. Eng. Chem. Fundam., vol. 1, no. 3, pp. 187–191, 1962. [27] D. Arnaud, J. Barbery, R. Biais, B. Fargette, and P. Naudot, “Propriétés du cuivre et de

![Figure 1: Cu-Ti-C system: (a) Cu-rich side of the Cu-Ti phase diagram , (b) isothermal section at 950 °C, and (c) isothermal section at 25 °C [16–18]](https://thumb-eu.123doks.com/thumbv2/123doknet/13271913.397591/8.892.131.781.215.774/figure-rich-phase-diagram-isothermal-section-isothermal-section.webp)
![[PDF] Support de cours pour débuter avec Camera raw | Formation informatique](data:image/gif;base64,R0lGODlhAQABAIAAAP///wAAACH5BAEAAAAALAAAAAABAAEAAAICRAEAOw==)