Design of a Mobile Torrefaction Reactor for In-Situ
Conversion of Agricultural Waste to Solid Biofuel
by
MASSACHUSETTS INSTITUTE
Megan Lynn O'Brien OF TECHNOLOGY
B.A.Sc., University of British Columbia (2014)
Department of Mechanical Engineering
LIBRARIES
ARCHIVES
Submitted to the Department of Mechanical Engineeringin partial fulfillment of the requirements for the degree of
Master of Science in Mechanical Engineering at the
MASSACHUSETTS INSTITUTE OF TECHNOLOGY June 2016
Massachusetts Institute of Technology 2016. All rights reserved.
Signature redacted
A u th o r ... ,. . . . . .. ... ... ... ... ... .. Department of Mechanical Engineering
Signature redacted
May17,2016C e rtifie d b y ... t y-T... ... Alexander H. Slocum Pappalardo Professor of Mechanical Engineering
Signature
redactedA
"rvisor
A cce p te d b y ... ... Rohan Abeyaratne Chairman, Department Committee on Graduate Theses
Design of a Mobile Torrefaction Reactor for In-Situ
Conversion of Agricultural Waste to Solid Biofuel
by
Megan Lynn O'Brien
Submitted to the Department of Mechanical Engineering in partial fulfillment of the requirements for the degree of
Master of Science in Mechanical Engineering
Abstract
Significant volumes of biomass waste are generated each year as a result of agricultural practices in India. Despite the negative environmental impacts, in-situ incineration of crop residues is common practice for disposal of this waste. Transportation of raw biomass accounts for a significant portion of the cost of biomass conversion processes due to its low energy density and high bulk volume. The use of raw biomass also reduces the overall efficiency of thermochemical conversion processes due to high moisture content, over-oxidation of the fuel resulting from high oxygen content, and the relatively high oxygen to carbon ratio. There has been much recent interest in improving the properties of biomass prior to gasification and pyrolysis through densification, drying, and mild thermochemical treatments. One approach is a process known as torrefaction, which is a mild pyrolysis process that is shown to produce an energy-dense fuel with improved transport, storage, and feedstock characteristics. Particularly in the Indian context, there is a need for the development of a small-scale system which can densify and upgrade the properties of agricultural residues after harvest.
This thesis presents the design and preliminary testing of a lab-scale moving-bed torrefaction reactor. Key learnings from the assembly and testing of this machine are identified and recommendations for improvement are made. A rudimentary model evaluating the heat transfer in packed bed of biomass is developed to provide a framework for analyzing future reactor designs. The functional requirements of a lab-scale screw conveyor torrefaction reactor are developed based on this analysis and a preliminary reactor architecture is proposed. Multiple studies are recommended to improve the reliability of the heat transfer model. Recommendations are made for future design iterations of the lab-scale screw conveyor torrefaction reactor.
Thesis Supervisor: Alexander H. Slocum
Acknowledgments
First and foremost, I would like to express my utmost gratitude to Professor Alex
Slocum. Your infectious passion for design has forever transformed the way in which
I will approach my work. If there are two lessons I will always remember from my time at MIT, they are:
1. Physics doesn't care about your feelings.
2. Hawaiian shirts are always acceptable attire as long as you have maximized
your avian linearity.
To the MIT Tata Center and to the Tata Trust, for supporting my research and
instilling in me a passion for creating large-scale impact.
To my labmates in PERG, I was so fortunate to be surrounded by your bright minds
and unparalleled friendship. I am particularly grateful to Kevin for always reminding
me that there is no stress that a long run with a friend can't alleviate, even when
Thursdays get hard. To David, for sharing your finest tea and a dose of humor on
Friday afternoons. To Tyler, for being my accomplice in late-night writing and
excessive coffee consumption. To Nevan, for sharing with me your network, your
wisdom, and your compassion.
To Cam, for your unwavering patience, kindness, and understanding. You have been
a pillar of support through my most challenging times.
Finally, to my family, who sent me love and packages full of homemade baking when
Contents
CHAPTER 1: INTRODUCTION ... 21
1.1 India's Energy Landscape ... 21
1.2 Decentralized Pow er Generation... 22
1.3 Biom ass as an Energy Source ... 23
1.4 Crop Residue M anagem ent... 24
1.5 A Sym biotic Solution ... 25
CHAPTER 2: LITERATURE REVIEW ... 26
2.1 Introduction ... 27
2.2 Feedstock Upgrading ... 30
2.3 Torrefaction ... 31
2.3.1 Overview ... 31
2.3.2 M odels of Product Evolution Kinetics ... 32
2.3.3 Experimental Investigations of Process Conditions... 35
2.3.4 End Product Utilization ... 38
2.3.5 Reactor Types ... 42
CHAPTER 3: FIXED BED PROTOTYPE ... 48
3.1 Proposed Gravity-Driven Fixed Bed Concept ... 49
3.2 M oving Bed Concept... 52
3.3 M oving Bed Prototype Design... 55
3.3.1 Storage & Feed Conveyor ... 56
3.3.2 Fixed Bed ... 61
3.3.3 Com bustor & Exhaust... 64
3.3.4 Low er Conveyor ... 66
3.3.5 Product Recovery System ... 68
3.4 Initial Testing: Challenges and Takeaways... 70
3.4.1 Design for Assem bly ... 72
3.4.2 M aterial Handling ... 73
3.4.3 Gas Sealing ... 79
3.5 Second-Generation Design ... 82
CHAPTER 4: DESIGN PROCESS ... 83
4.1.1 Full-Scale Reactor ... 83
4.1.2 Bench-Scale Prototype ... 85
4.2 High-Level Strategies & Concepts ... 86
4.2.1 Heat Transfer M echanism ... 86
4.2.2 Reactor Concepts... 88
4.3 Analysis ... 91
4.3.1 M ass Through put& Sizing ... 91
4.3.2 Pow er Consum ption ... 96
CHAPTER 5: HEAT TRANSFER M ODEL ... 99
5.1 Energy Input Requirem ent... 99
5.2 Heat Transfer Coefficient... 103
5.2.1 Therm al M odel ... 104
5.2.2 Estimation of the Wall-to-Surface Heat Transfer Coefficient ... 107
5.2.3 Heat Penetration M odel ... 109
5.3 Heat Transfer in the Reactor... 112
5.4 Im plications for Design ... 117
5.4.1 Reactor Architecture ... 117
5.4.2 M ixing in the Packed-Bed ... 117
5.4.3 Volatile and Steam Separation ... 119
CHAPTER 6: PRELIMINARY SECOND-GENERATION DESIGN... 120
6.1 M odules ... 121
6.1.1 Storage and Feed ... 122
6.1.2 Reactor and Heat Exchanger ... 123
6.1.3 Volatile Gas Collection ... 124
6.1.4 Com bustor ... 125
6.1.5 Char Collection ... 126
6.2 Reactor Design ... 127
6.2.1 Storage and Feed M odule ... 127
6.2.2 Reactor and Heat Exchanger M odule... 129
6.3 Design Considerations for Future M odules ... 134
6.3.1 Volatile Gas Production Rate ... 134
CHAPTER 7: CONCLUSIONS AND FUTURE WORK... 137
7.1 Validation of Heat Transfer M odel... 137
71.2 Thermal Model... 139
7.2 Revision of Lab-Scale Design ... 141
Bibliography ... 143
List of Figures
Figure 1 -Pine shavings at increasing torrefaction severity, from raw wood (a) to biochar (e). ... 32
Figure 2 -The two stages of thermochemical biomass decomposition...33
Figure 3 -Modeled solid yield composition (a) and volatile yield and composition (b) (% weight of initial) versus time (min). Reproduced from Bates & Ghoniem, 2012...34
Figure 4 -Effect of process parameters and raw biomass moisture content on energy density of torrefied material. Reproduced from Medic et al., 2012... 35
Figure 5 -Response surface and contour plot of temperature vs. reaction time on the energy value during torrefaction. Reproduced from Lee et al., 2012 ... 36
Figure 6 -Schematic of rotating drum arrangements. (a) Shows the arrangement of rotating drum inside the reactor and (b) shows the cross section of the drum. From: Dhungana, Basu, & Dutta, 2 0 1 2 ... 4 3 Figure 7 -Fixed bed reactor concept for biomass pyrolysis. Reproduced from: Verma et al., 2012 ... 44
Figure 8 -Circulating fluidized bed reactor schematic. Reproduced from: Trendewicz, Braun, Dutta, & Z ieg le r, 2 0 1 4 ... 4 5 Figure 9 -Auger-type screw reactor. From: Koppejan, 2012 ... 46
Figure 10 -Multiple hearth furnace reactor (Herreshoff Oven). Reproduced from: Koppejan, 2012 ..47
Figure 11 -The proposed architecture of the gravity-fed fixed bed torrefaction reactor concept. Reproduced from : Kung, 2014...49
Figure 12 -Schem atic of m oving-bed reactor concept... 54
Figure 13 -Sub-assemblies of the moving-bed prototype reactor... 55
Figure 14 -Cross-sectional view of the storage and feed sub-assembly ... 57
Figure 15 -No flow condition in a hopper due to material bridging over the exit. Image adapted from: http://production-oms.s3.amazonaws.com/static/Image/L23-3-Blockages.jpg...60
Figure 16 -Cross-sectional view of the fixed-bed sub-assembly... 62
Figure 17 -Cross-sectional view of the combustor sub-assembly... 65
Figure 18 -Cross-sectional view of the lower screw conveyor sub-assembly. ... 66
Figure 19 -Cross-sectional view of the product recovery sub-assembly. ... 69
Figure 21 -Propane burners installed in the base of the combustor module...71
Figure 22 - Example of a difficult-to-access bolted joint. Picture taken from the top of the combustor a sse m b ly ... 7 3 Figure 23 -Mechanical agitator installed above the horizontal feed screw conveyor...75
Figure 24 -Schematic of pine shavings forming a bridge above the vertical screw conveyor...76
Figure 25 -Tar formation on the surface of the screw conveyor flights. ... 77
Figure 26 -Material compaction zones in the (a) horizontal feed conveyer (b) vertical screw co n v ey o r...7 8 Figure 27 -Bolted flange joint with overlapping stress cones... 80
Figure 28 -(a) Batch-feed and (b) continuous feed nitrogen purge systems... 81
Figure 29 -Strategies and high-level concepts for transferring heat to biomass... 87
Figure 30 -Reactor-type concepts for remaining biomass heating strategies ... 88
Figure 31 -Example of a reactor with three screw conveyors operating in parallel...90
Figure 32 - Sizing analysis of a 1 kg/hr lab-scale screw conveyor reactor with a 40% fill fraction and 20 m inute residence tim e ... 93
Figure 33 -Sizing analysis of a 50 kg/hr parallel screw conveyor reactor with a 40% fill fraction and 20 m inute residence tim e ... 94
Figure 34 -Chosen design points to evaluate for development of the lab-scale reactor system...96
Figure 35 -Schematic of the First-Order Heat and Mass Transfer Model Used to Evaluate Reactor and D ry er Strateg ies... 1 0 0 Figure 36 -Concentric tube counterflow heat exchanger ... 102
Figure 37 - (a) Thermal circuit diagram between the inner wall of the heat exchanger and the m aterial in a (b) packed bed of spheres...105
Figure 38 -Wall-to-surface and bulk heat penetration thermal resistances in series. Reproduced from : O sm an et al., 20 12...106
Figure 39 -Effect of surface roughness and characteristic particle size on the wall-to-surface heat transfer coefficient. The region of interest for pine shavings is indicated in red...112
Figure 40 -The impact of fill fraction on particle temperature distribution in a heated screw conveyor. M odified from : Osm an et al., 2012 ... 118
Figure 42 -Cross-sectional view of the (1) storage and feed and (2) reactor and heat exchanger m o d u le s...1 2 7
Figure 43 -Cross-sectional view of a simplified model of the Tecweigh Volumetric Flex Feeder...128
Figure 44 -Top view of the reactor and heat exchanger module...129
Figure 45 -Top view of the drive-side bearing layout...131
Figure 46 -Exploded view of the bearing housing bolted joint...132
Figure 47 - Universal joint and quick-connect screw conveyor attachment...133
Figure 48 -Cross-section of reactor and heat exchanger module...134
Figure 49 -Annulus and core flow resulting from the clearance gap between the screw conveyor flights and the reactor w all...140
Figure 50 -Dimensions of Tecweigh Flex-Feed Volumetric Feeder. Reproduced from: http://www.tecweigh.com/assets/images/pdfs/12-Series-Feeder-Drawing-30020100.pdf.. 150
List of Tables
Table 1 -Composition of wood and torrefied wood. Modified from M.J. Prins et al., 2006...37
Table 2 -Fuel properties of woodchips, wood pellets, torrefied biomass, torrefied biomass pellets, and bitum inous coal. Adapted from Nunes et al., 2014 ... 40
Table 3 -Parameters for calculation of the horizontal conveyor total shaft power...58
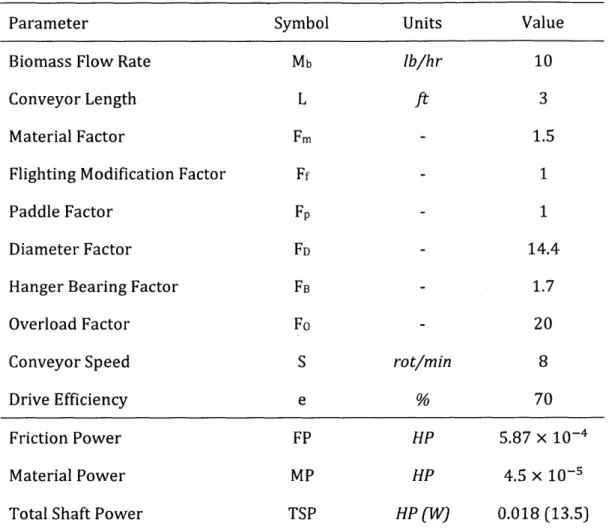
Table 4 -Parameters for calculation of the vertical conveyor total shaft power...67
Table 5 -Top-Level Functional Requirements for a Full-Scale Mobile Torrefaction System...84
Table 6 -Top-Level Functional Requirements for a Bench-Scale Prototype Torrefaction System...85
Table 7 -Parameters for the two standard cases used to analyze reactor concepts...92
Table 8 -Sum m ary of the three chosen design points ... 97
Table 9 -Parameters for the estimation of hw, using Schiinder's correlation (1981)...111
Table 10 -Parameters used for analyzing the heat transfer within the reactor...115
Table 11 -Calculated lengths of the dryer and heater portions and the required operating power of the reactor for the chosen design points...117
Table 12 -Functional requirements for the storage and feed module...123
Table 13 -Functional requirements for the reactor and heat exchanger module...124
Table 14 -Functional requirements of the volatile gas collection module. ... 125
Table 15 -Functional requirements of the combustor module...126
Table 16 -Functional requirements of the char collection module...126
Nomenclature
0 Conveyor Fill Fraction 1-]
OA Accommodation Coefficient 1-]
ow Wall Coverage Factor [-]
1G Gas Dynamic Viscosity [m2/s]
AD Surface Area of Dryer [m2]
Atot Total Surface Area [m2]
Ax Convective Surface Area per unit Length [im]
CP Bulk Heat Capacity U/kg K]
CPB Heat Capacity of Biomass U/kg K]
CPH201 Heat Capacity of Liquid Water U/kg K]
CPH2O Heat Capacity of Gaseous Water U/kg K]
D Reactor Diameter [im]
d Particle Diameter [im]
Do Screw Outer Diameter [im]
Ds Screw Shaft Diameter [im]
e Drive Efficiency [-]
f Rotational Frequency [Hz]
FB Bearing Factor [-]
FD Diameter Factor [-]
FF Flighting Modification Factor [-]
Fo Overload Factor [-]
FP Friction Power [HP]
Fp Paddle Factor [-]
h2 Outer Wall Heat Transfer Coefficient [W/M2 -K]
hdir Particle-to-Particle Heat Transfer Coefficient [WI/M2 K]
ho Overall Heat Transfer Coefficient [W/m2 - K]]
hrad Radiative Heat Transfer Coefficient [WI/m2 K]]
Hw hwp hws kb kg kw L I LD LH Lo MB MB rh 7 Hzo2in miH2 0 rnt inH2Oout mH2 Ovap MP N p P Q Qin $iatent $loss $sensible R r r1
Latent Heat of Vaporization, Water Wall-to-Particle Heat Transfer Coefficient Wall-to-Surface Heat Transfer Coefficient Bulk Effective Thermal Conductivity Gas Conductivity
Wall Thermal Conductivity Screw Conveyor Length
Mean Free Path of Gas Molecule Length of Dryer
Length of Heater
Maximum Overall Length Gas Molar Mass
Mass Throughput
Mass Flow Rate per Screw Total Mass Flow Rate Incoming Moisture Content Outgoing Moisture Content Water Vaporization Rate Material Power
Number of Screws Screw Pitch Pressure
Total Heat Transfer Energy Input
Latent Heat Requirement Energy Loss
Sensible Heat Requirement Surface Area-to-Volume Ratio
Rate of Volatile Constituent Production Inner Cylinder Radius
[kJ/kg - K] [W/m2 K] [W/m2 K] [W/m K] [W/m K] [W/m K] [-] [in] [in] [in] [in] [kg/mol ] [Ib/hr] [kg/s] [kg/s] [kg/s] [kg/s] [kg/s] [HP] [-] [in] [Pa] [W] [W] [W] [W ] [WI] [m-1] [kg/s] [m]
r2 RB RG RGs RRAD RWG Rws S t T Ta1 Ta2 Tb Tb Tb 2 TG tres TSP TSP Tw Urn v Vb Vrev V W wt.% a ATLM ATO
Outer Cylinder Radius
Bulk Conduction Thermal Resistance Universal Gas Constant
Gas-to-Solid Thermal Resistance Wall-to-Solid Radiative Resistance Wall-to-Gas Thermal Resistance Wall-to-Solid Thermal Resistance Conveyor Speed
Time
Temperature
Incoming Hot Fluid Temperature Final Hot Fluid Temperature Bulk Biomass Temperature Incoming Biomass Temperature Final Biomass Temperature Gas Temperature
Residence Time Surface Temperature Total Shaft Power Wall Temperature
Mean Linear Velocity of Material Volumetric Rate of Gas Production Volumetric Flow Rate
Material Volume per Revolution Volume per Unit Length
Molecular Weight Percentage of Mass Surface Roughness
Log Mean Temperature Difference Initial Temperature Difference
[in] [K/W] U/K - mol] [K/W] [KIW] [K/W] [K/W] [rpm] [s] [K] [K] [K] [K] [K] [K] [K] [s] [K] [HP] [K] [m/s] [ms/s] [ms/s] [ms] [m2] [gImol]
[%]
[K] [K]p Density [kg /M 3]
Pb Bulk Density [kgI/M3]
CHAPTER 1: INTRODUCTION
1.1 India's Energy Landscape
In the last decade, India's population has grown by over 30% to reach 1.2 billion inhabitants, making the nation the second most populous in the world (Kalyani
& Pandey, 2014). By the year 2028, India's population is predicted to reach 1.47
billion, overtaking that of China (United Nations Department of Economic and Social Affairs, 2014). In addition to the rapid population growth, the nation is undergoing extensive urbanization and economic development. In developing areas such as this, it is widely accepted that access to energy is the single most important factor for facilitating the improvement of economic and social conditions (Reddy, Kaushik, & Panwar, 2013).
This accelerated development, coupled with the growing population, means that there is a rapidly increasing demand for access to modern forms of energy. This demand has placed strain on the country's natural resources and existing infrastructure and has led to major problems with the reliability of existing energy systems. India derives over two thirds of its energy from traditional fossil fuel sources such as coal, natural gas, and oil, with only 12% of the country's energy being derived from renewable sources (Kumar, Kumar, Baredar, & Shukla, 2015; Reddy et al., 2013). The annual growth rate of energy demand is expected to increase to match the economic growth rate of 8% over the period of 2014-2025 (Ravindranath & Balachandra, 2009). In areas where access to the national electricity grid exists, there has been an expanding gap between peak electricity demand and the available supply.
In 2010, this discrepancy was estimated to be as high as 14% (Buragohain, Mahanta,
& Moholkar, 2010; Ravindranath & Balachandra, 2009). Generating this additional power from coal is an economically attractive option for India due to the vast supply
of thermal coal throughout the country and the existing national grid infrastructure
with which to distribute the power (Ghose, 2012). However, the distribution of India's
population is also an important factor to consider when developing strategies for the
continued electrification of Indian households.
1.2 Decentralized Power Generation
One of the largest challenges facing the continued development of India is
supplying electricity to households that are not connected to, and may not be feasibly
connected to, the national grid. Despite the rapid urbanization that has taken place,
approximately 70% of the population still resides in rural areas, making India home
to the largest rural population in the world (Blenkinsopp, Coles, & Kirwan, 2013). As
of 2009, nearly 50% of these rural Indian households did not have access to electricity
and still relied on biomass to meet the majority of their energy needs (Pachauri &
Jiang,
2008). The economic and technical challenges associated with extending thenational grid to many rural villages have created demand for alternative solutions to
rural electrification. One method for providing power to remote villages is to generate
electricity in decentralized plants which are close to the load centers and then to
distribute the power using local mini-grids. Such village-scale power plants typically
utilize local resources such as hydro, wind power, solar power, or biomass to produce
1.3 Biomass as an Energy Source
In rural areas, biomass is the most uniformly distributed and one of the most
abundant energy sources, which is why biomass in the form of firewood, crop
residues, and livestock dung currently accounts for 80% of the energy consumed by
the rural population (Kshirsagar, Arora, & Chandra, 2012). Although these sources
have traditionally offered an inexpensive and readily available supply of energy, low
energy efficiency, health concerns, environmental impacts, and energy scarcity
driven by forest degradation indicate that alternative methods of harvesting energy
from these feedstocks need to be employed.
The term'biomass' refers to organic material derived from living or once living
organisms, such as trees or animal manure. Biomass can be categorized as woody
biomass, which is derived from forests, and non-woody biomass, which consists of
agricultural residue and waste from humans, animals and industrial processes. The
advantages of considering biomass for decentralized power generation in India over
other resources are that it is widely available, carbon neutral, and renewable. When
compared to other renewable sources such as wind and solar, the utilization of
biomass to produce electricity can result in a lower levelized cost of energy in many
cases (Buragohain et al., 2010). Biomass feedstocks can be converted to useful energy
through a combination of thermal, chemical, and biological processes. The
composition and moisture content of each of these feedstocks dictates the types of
energy conversion processes that can be used to convert them. A common method for
biomass or co-firing with another fuel such as coal. The heat from combustion is used
to make steam, which can then drive a turbine to generate electricity. This method is
economically attractive due to the limited requirement for preparation and treatment
of the biomass. In comparison to direct incineration, the energy conversion efficiency
can be improved significantly by thermo-chemical conversion processes such as
gasification or pyrolysis. In this case, the feedstock is partially combusted in a limited
or no-oxygen environment, producing a combination of biochar, flammable gas, and
bio-oil. These end products can then be used to produce liquid fuels, solid fuels, or
feedstocks for electricity generation.
1.4 Crop Residue Management
Nearly 60% of the land in India is used for agricultural practices, generating
significant amounts of waste biomass with each harvest (Hiloidhari, Das, & Baruah,
2014a). For example, the growth of the four most abundant crops in India, rice, wheat,
sugarcane, and cotton, produces nearly 500 MT of crop residues each year (Hiloidhari
et al., 2014a; Kshirsagar et al., 2012). Despite numerous potential uses for this waste,
crop residues are commonly burned in situ due to the cost, time, and difficulty of
collecting, transporting, and processing this biomass. Transporting the biomass to a
centralized facility demands additional time and cost from the farmer, often making
this an economically infeasible option. The implications of in-situ incineration include
greenhouse gas emissions, environmental degradation, health hazards resulting from
availability and well-distributed nature of crop residues makes them an attractive
option as a feedstock for bioenergy production.
1.5 A Symbiotic Solution
In order to address the environmental and health concerns resulting from crop
residue burning, a solution must be developed to make collection and conversion of
the crop residues an economically attractive option to farmers. Additionally, it will be
beneficial to provide alternatives for traditional uses of biomass for cooking, heating,
and lighting. By reducing the cost and improving the efficiency of processes that allow
biomass to be used as a renewable feedstock for generating electricity and producing
solid and liquid fuels, a symbiotic system may be realized that both reduces
environmental degradation resulting from India's current energy infrastructure and
supplies modern forms of energy to a demographic that is in need of the social and
economic development that energy access provides.
This thesis describes the formulation of a system which offers one such potential
solution. In the following chapters, the development of a system for on-site upgrading
and densification of agricultural waste is described, and the plans for fabrication of a
machine are proposed. Context-driven limitations are considered and their impact on
CHAPTER 2: LITERATURE REVIEW
2.1 Introduction
Energy is an essential input to improve the commercial, industrial, agricultural, residential and transportation sectors in India (Hiloidhari, Das, & Baruah, 2014b; Tripathi, Sahu, & Ganesan, 2016). Despite extensive development of the energy infrastructure, India's reserves of coal and oil are not adequate to supply the growing demand for energy, resulting in an imbalance between supply and demand
throughout the country (Hiloidhari et al., 2014b). As such, traditional biomass still
accounts for 80% of residential energy use in India (Pachauri & Jiang, 2008). Additionally, burning of agricultural residues is still common practice throughout India, resulting in poor air quality, emissions, and nutrient and resource loss (Jain et al., 2014). In order to address the energy and environmental issues that India is encountering, there is strong interest in the continued expansion of renewable energy generation capacity. Due to the prevalence of the agricultural industry, India is well suited for bioenergy generation. In particular, the portions of biomass that are not harvested for economic value, known as crop residues, present a substantial opportunity for renewable energy generation. Hiloidhari et al. estimated that the annual bioenergy potential from surplus crop residues in India is equivalent to 17% of the nation's total primary energy consumption (Hiloidhari et al., 2014b).
The energy contained in biomass can be converted into solid fuels for cooking, liquid fuels for transportation, heat, electricity, and certain chemicals. There are two primary methods for conversion of biomass to higher-value end products:
biochemical processes and thermochemical processes. Biochemical processes are not
within the scope of this research and will not be discussed. Thermochemical
processes use heat and sometimes pressure to break down organic matter into its
constituents. The products of these processes are a solid residue fraction, a gas
fraction, and a liquid (bio-oil) fraction. The proportion of each depends on the process
used, the raw biomass being processed, and the process conditions. The most
common thermochemical processes are combustion, liquefaction, pyrolysis, and
gasification.
Combustion
Combustion is the most commonly used, well understood, and familiar
thermochemical conversion process (Jenkins, Baxter, & Miles, 1998). At temperatures
in excess of 1500'C, biomass is fully oxidized in the presence of stoichiometric or
surplus air to produce heat, water, carbon dioxide, and other particulates (Jenkins et
al., 1998). The heat produced during combustion can be used for steam production
and electricity generation.
Liquefaction
Liquefaction is a low-temperature, high-pressure thermochemical conversion
process that is well suited to converting biomass resources with high moisture
content into bio-oil (Brown, 2009). The process is carried out at temperatures in the
range of 200'C -400'C and at pressures of 5 -20 MPa (Huang & Yuan, 2015). During liquefaction, biomass is depolymerized into monomers. The monomers then
& Yuan, 2015). The resulting fractions of bio-oil, gas, and solid residue depend on the biomass type and the liquefaction conditions.
Pyrolysis
Pyrolysis is a thermochemical process in which organic matter decomposes in the
absence or scarcity of oxygen (Basu, 2010). Pyrolysis of biomass typically occurs in
the temperature range from 300'C -600*C and at atmospheric pressure (Basu, 2010). Depending on the process conditions, pyrolysis can be broadly divided into two
classes: slow pyrolysis and fast pyrolysis. Slow pyrolysis is characterized by a heating
time that is much greater than the pyrolysis reaction time itself, resulting in residence
times of up to 30 minutes and relatively low final temperatures of up to 500*C (Basu,
2010; Tripathi et al., 2016). These process conditions favor the formation of biochar
over liquid and gaseous products, which can be used as a solid fuel. Pyrolysis is
considered fast if the characteristic pyrolysis reaction time is appreciably greater
than the biomass heating time. Typical conditions for fast pyrolysis are final
temperatures from 600-1000*C and short residence times of 1-10 seconds (Basu,
2010; Tripathi et al., 2016). Fast pyrolysis produces predominantly bio-oil, which can
be hydrocracked in order to create products such as gasoline and diesel.
Gasification
Gasification is a thermochemical process requiring a gasifying medium such as
oxygen, steam, or air that is primarily used to produce a combustible fuel called
syngas, which is composed primarily of carbon monoxide, hydrogen, and carbon dioxide (Ahmad, Zawawi, Kasim, Inayat, & Khasri, 2016; Basu, 2010; Couhert,
Salvador, & Commandr6, 2009). Gasification is performed at temperatures from
500*C - 1400'C and at atmospheric or elevated pressures (Ahmad et al., 2016). The process of gasification generally occurs in four steps: drying, thermal decomposition,
char gasification, and combustion (Basu, 2010). During the char gasification process,
chemical reactions occur between the products of the pyrolysis process and the
gasifying medium to form the desired product, syngas. Syngas can be used for
producing heat, generating electricity, or further refinement into liquid fuels or
chemicals.
2.2 Feedstock Upgrading
All of these processes promise to contribute to a renewable energy transition through the use of biomass as a carbon neutral fuel source. However, there are inherent issues
with the use of raw biomass as a fuel for these processes which need to be addressed
in order to make energy generation from biomass competitive with conventional
fossil fuel use. Transportation of raw biomass accounts for a significant portion of the
cost of biomass conversion processes due to its low energy density and high bulk
volume (M.-F. Li et al., 2015). The use of raw biomass also reduces the overall
efficiency of thermochemical conversion processes due to high moisture content,
over-oxidation of the fuel resulting from high oxygen content, and the relatively high
oxygen to carbon ratio (M.-F. Li et al., 2015). Storage of the biofuel can also present a
challenge due to the hydrophilic nature of raw biomass making it susceptible to
additional challenges for the design, operation, and maintenance of processing
systems (van der Stelt, Gerhauser, Kiel, & Ptasinski, 2011).
There has been much recent interest in improving the properties of biomass prior to
gasification and pyrolysis through densification, drying, and mild thermochemical
treatments. One approach is a process known as torrefaction, which is a mild
pyrolysis process that is shown to produce an energy-dense fuel with improved
transport, storage, and feedstock characteristics (Bergman, 2005; M.-F. Li et al.,
2015).
2.3 Torrefaction
2.3.1 Overview
Torrefaction is a mild pyrolysis process that is carried out in the absence of oxygen.
Torrefaction processes take place in the range of 200*C -300'C with typical residence times of 10 - 45 minutes, depending on the biomass type and the desired characteristics of the output product. The output of the torrefaction process is a
product with increased energy density, decreased oxygen to carbon ratio, improved
grindability, and improved handling and storage properties (Chen, Peng, & Bi, 2015;
Wechsler, Shulenberger, Wall, & Braig, 2010). Torrefied biomass is typically only
60-70% of its original weight, but retains greater than 90% of its energy content (Basu, 2010; van der Stelt et al., 2011). This weight loss results from both drying and partial
devolatilization of the biomass (Basu, 2010). As a fuel for combustion or gasification,
torrefied fuel is more desirable than the raw biomass due to increased combustion
been shown to increase the uniformity of physical and chemical properties of mixed
feedstocks after torrefaction (M.-F. Li et al., 2015). Figure 1 demonstrates the physical
changes which occur with increasing torrefaction severity.
ab
'e'
Figure 1 -Pine shavings at increasing torrefaction severity, from raw wood (a) to biochar (e). Biomass is composed primarily of three constituents: hemicellulose, cellulose, and
lignin. Shafized (1985) showed that during thermal decomposition of raw biomass,
each constituent decomposes at different rates and temperatures. The hemicellulose
component is the most thermally reactive, decomposing at temperatures ranging
from 225'C to 300'C. The cellulose decomposes above temperatures of 300'C, and
the lignin decomposes at a more gradual rate in the 2500C to 5000C temperature range.
2.3.2 Models of Product Evolution Kinetics
Many models have been developed to describe the energy and mass balance and
formulation of products during the thermochemical decomposition of these
components (M.
J.
Prins, 2005; Ranzi et al., 2008). Di Blasi and Lanzetta proposed afirst-order Arrhenius model that describes the solid-phase decomposition as a
k k V2
A k B k2 C
Figure 2 -The two stages of thermochemical biomass decomposition.
The first step is attributed primarily to decomposition of the hemicellulose
component of the raw biomass (A), which releases lower energy volatiles (V1) and
forms a solid intermediate (B). The volatiles released in the first stage of the reaction
are primarily composed of acetic acid, water, and carbon dioxide (Bates & Ghoniem,
2012). During the second step of the reaction, higher energy volatiles (V2) are
released from the solid intermediate, leaving a third solid, the biochar (C). The
secondary volatiles (V2) are composed of lactic acid, methanol, acetic acid, water,
hydroxyacetone, and formic acid (Bates & Ghoniem, 2012). Bates and Ghoniem
(2012) noted that limited de-oxygenation occurs in the second stage of the reaction,
indicating that there is limited improvement of the oxygen to carbon ratio of the solid
for residence times beyond the time required to complete the first stage of the
reaction. Figure 3 shows the predicted composition of the volatile and solid products
with increasing torrefaction severity, demonstrating the slowing rate of
de-oxygenation and increased volatile carbon content as the second stage of the reaction
(a) C (b) 100% 90% 80% 70% 60% 50% 40% 30% 20% 10% 0% 50% 0 5 10 15 20 25 30 35 Time (minutes) ,l Carbon Monoxide Carbon Dioxide Hydroxyacetone Furfural Lactic Acid Methanol Formic Acid Acetic Acid Water 5 10 15 20 Time (minutes) 25 30 35 40
Figure 3 -Modeled solid yield composition (a) and volatile yield and composition (b) (% weight of initial) versus time (min). Reproduced from Bates & Ghoniem, 2012.
Ash w Oxygen a Hydrogen s Carbon E i 0 40 45% -40% 35% 30% 25% 20% -15% -10% -5% 0% 0 0 0 0 U U 0
-2.3.3 Experimental Investigations of Process Conditions
Many investigations have been performed to develop and validate the mass loss and
kinetics models for various types of biomass under a wide range of process
conditions. Medic et al. studied the effect of temperature and residence time on the
solid, liquid, and gas yields of torrefied corn stover (Medic, Darr, Shah, Potter, &
Zimmerman, 2012). By varying the temperature from 200'C to 300'C and the
residence time from 10 to 30 minutes, they found that solid yields decreased and
gaseous and condensable product yields increased as the process temperature and
residence time increased. Loss of solid mass increased substantially above process
temperatures of 250'C. Above 300'C, there was a dramatic increase in the yield of
condensable products and decrease in the solid yield, potentially signaling
decomposition beyond the torrefaction regime. They also proposed that temperature
has a markedly stronger impact on the energy density of torrefied biomass in
comparison to residence time and initial moisture content, as shown in Figure 4.
22 C.;
200 2 30C
Temperature (C
Figure 4 - Effect of process parameters and raw biomass moisture content on energy density of
Lee et al. defined a severity factor (SF) to describe both the process temperature and residence time used for torrefaction of mixed softwood chips (Lee, Kim, Lee, & Lee, 2012). In this study, temperature ranged from 220'C to 280'C and residence time from 20 to 80 minutes. Similar to the findings of Medic, it was found that the energy density of the torrefied biomass increased with increasing severity of the torrefaction process. Contrary to what Medic concluded regarding torrefaction of corn stover, Lee
found that the residence time had a stronger impact on the energy density of torrefied softwood than the temperature, as shown in Figure 5. Lee proposes that low-severity torrefaction processes are ideal for producing high energy density fuels from mixed softwood feedstocks.
Temperature(coded keve4s) 1..
-Reaclon bme(coded levels
Figure 5 - Response surface and contour plot of temperature vs. reaction time on the energy value during torrefaction. Reproduced from Lee et al., 2012
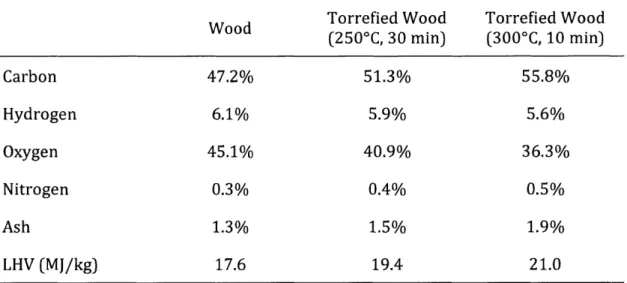
Prins et al. studied the properties of deciduous wood, coniferous wood, and straw under varying torrefaction parameters (M.J. Prins, Ptasinski, & Janssen, 2006; Mark J.
at various combinations of temperatures ranging from 2200C to 3000C and residence times of 10 to 60 minutes. Straw was torrefied at 250'C for 30 minutes. Prins
achieved an increase in energy density of up to 20% for deciduous samples (Table 1)
and 7% for coniferous samples. The difference was attributed to lower reactivity of
softwood, resulting in the formation of fewer volatiles such as acetic acid and
methanol.
Table 1 -Composition of wood and torrefied wood. Modified from M.J. Prins et al., 2006
Wood Torrefied Wood Torrefied Wood
(2500C, 30 min) (300'C, 10 min) Carbon 47.2% 51.3% 55.8% Hydrogen 6.1% 5.9% 5.6% Oxygen 45.1% 40.9% 36.3% Nitrogen 0.3% 0.4% 0.5% Ash 1.3% 1.5% 1.9% LHV (MJ/kg) 17.6 19.4 21.0
Arias et aL torrefied eucalyptus at 240'C, 2600C and 280*C for residence times of up to 3 hours in order to evaluate the effects of temperature and residence time on
grindability and combustibility of the torrefied biomass (Arias et al, 2008).
Consistent with previous studies, Arias found that the energy density increased with
increasing temperature and residence time. At conditions of 280*C and 3 hours, the
heating value increased by 34% compared to the raw eucalyptus. However, this
severe torrefaction process resulted in a total energy loss of over 30%, highlighting
the trade-off between increasing energy density and decreasing total energy yield of
minimum torrefaction condition to result in decomposition of the hemicellulose is a
temperature of 2400C and a residence time of 30 minutes. At these conditions, there
was a marked increase in the grindability of the torrefied biomass when compared to
raw biomass.
2.3.4 End Product Utilization
Torrefied Pellets
Despite the increase in energy density of torrefied biomass on a mass basis (MJ/kg),
there is limited external volume reduction achieved (Basu, Rao, Acharya, & Dhungana,
2013). In order to realize further cost savings for transport, torrefaction can be paired with a pelletization process in order to mechanically densify the torrefied material.
Peng et al. reported a small increase in energy consumption for producing pellets
from torrefied wood in comparison to raw samples, but a marked increase in the
hydrophobicity, and therefore storage life, of the torrefied pellets (Peng, Bi,
Sokhansanj, & Lim, 2013). Studies have found that the volumetric energy density of
torrefied pellets is in the range of 15 to 18 GJ/m3, in comparison to non-densified biomass that has a volumetric energy density of 4 to 5 GJ/m3 and conventional wood
pellets that have a volumetric energy density of 8 to 11 GJ/m3 (Bergman, 2005; Nunes,
Matias, & Catal5o, 2014). Additionally, studies have demonstrated that combining
torrefaction with pelletization results in a material with a heating value, bulk density,
and grindability more similar to coal than pelletization or torrefaction independently,
making it a more attractive candidate for replacing or co-firing with coal (Bergman,
Gasification Fuel
The literature shows that gasification efficiencies improve as the oxygen to carbon
ratio of the input fuel decreases (Mark
J.
Prins, Ptasinski, & Janssen, 2007). As such,torrefaction has been identified as a promising pretreatment for biomass prior to
gasification, as torrefaction has been shown to make the oxygen to carbon and
hydrogen to carbon ratios of biomass approach those of coal (Ahmad et al., 2016;
Chen, Chen, Hung, Shen, & Hsu, 2013; MarkJ. Prins, Ptasinski, & Janssen, 2006a). Chen
et al. found that the cold gas efficiency (the ratio of the energy contained in the
gasification syngas to the energy contained in the feedstock) was improved by nearly
90% when torrefied bamboo was compared to raw bamboo (Chen, Chen, Hung, et al., 2013). Multiple studies have shown that in addition to improving the thermodynamic efficiency of the gasification process, using torrefied fuel has other positive impacts
such as reducing tar formation in downstream equipment cause by the release of
condensable liquids (Chen, Chen, Hung, et al., 2013; Chen, Chen, & Hung, 2013;
Couhert et al., 2009; Mark
J.
Prins et al., 2006a).Co-Firing with Coal
There has been significant interest in using torrefied fuel in combination with coal for
firing in pulverized coal-fired power plants. Pulverized coal boilers use a mixture of
finely ground coal and air to provide combustion heat in order to drive a steam
turbine (Nunes et al., 2014). For this process, it is a requirement for the fuel that is
comparable thermal properties (Chen et al., 2015). Table 2 demonstrates the
properties of torrefied fuel that make it an attractive candidate for co-firing with coal.
Table 2 - Fuel properties of woodchips, wood pellets, torrefied biomass, pellets, and bituminous coal. Adapted from Nunes et al., 2014.
torrefied biomass
Wood Wood Torrefied Torrefied Bituminous
Chips Pellets Biomass Biomass Coal
Pellets Moisture 30-60 7-10 3 1-5 5-10 (% wt) Mass 250-400 600-650 230 750-850 800-1000 Density (kg/m3) LHV (MJ/kg) 6-13 16.2 19.9 19-22 >25 Energy 2.5-3.2 10.8 4.7 15.1-18 20.2-25.2 Density (GJ/ m3)
Hygroscopic Hygro- Hygro- Hydro- Hydro-
Hydro-Nature scopic scopic phobic phobic phobic
Biological Yes Yes No No No
Degradation
Li et al. simulated a co-firing system using torrefied biomass as a substitute fuel (J. Li,
Brzdekiewicz, Yang, & Blasiak, 2012). Their study found that not only could the
pulverized coal boiler be fired using 100% torrefied biomass as a fuel without a loss
of boiler efficiency, but there was a also a significant reduction in emissions as a result
of switching to greater proportions of biomass fuel. In addition to the concern of
thermal performance when co-firing renewables with coal, other concerns include
the ability to use existing infrastructure at coal-fired facilities. The use of raw biomass
and storage systems. If a fuel with similar physical properties is used, however, the
use of existing coal infrastructure could allow the fraction of renewable fuels in the
co-firing mix to be increased without increasing the cost (Nunes et al., 2014).
Activated Carbon
Activated carbons can be used for a wide range of purposes including CO2
sequestration, water filtration, air purification, and chemical purification. Many
studies have investigated the production of activated carbons from solid biomass
residues and have found that activated carbons derived from torrefied pyrolysis char
have suitable pore structure to be used as adsorbents and the pore structures are
tunable based on both the activation method and the torrefaction process conditions
(Anderson et al., 2013; Tehrani, Aznar, & Kiros, 2015; Zhang, Hu, Zhang, & Xiong,
2016).
Ironmaking
In the production of hot metal, fossil-based materials such as metallurgical coke,
heavy oil, pulverized coal, and natural gas are used in blast furnaces to provide energy
to the steelmaking process and act as reducing agents (Suopajarvi, Pongracz, &
Fabritius, 2013). Charcoals produced from multiple potential biomass feedstocks
have been investigated for use in the production of solid reducing agents (Babich,
Senk, & Fernandez, 2010; Gupta, 2003). Subject to certain processing conditions,
charcoals derived from pyrolysis or torrefaction of woody biomass and straw have
been shown to be suitable replacements for pulverized coal in the blast furnace
2.3.5 Reactor Types
As a result of the comparable requirements and limitations of the two processes,
torrefaction reactor designs have largely been derived from existing pyrolysis
reactors.
Rotating Drum
In this design, biomass is heated inside a cylindrical rotating chamber that is either
heated externally, as shown in Figure 6, or with an internally flowing heat carrier gas.
For externally heated rotating drums, the main mode of heat transfer is wall-particle
conduction between the hot wall of the reactor chamber and the biomass particles.
For internally heated rotating drums, the heat transfer is dominated by direct
gas-to-particle convection. The main advantage of this design is good mixing of biomass
particles resulting in a homogenous output. There is a trade-off between having the
ability to collect and combust the un-adulterated volatile gases in an externally
heated system and the improved heat transfer from direct convection in an internally
heated system (Koppejan, 2012). The main drawback of this reactor architecture is
h hermocoupLe
Figure 6 - Schematic of rotating drum arrangements. (a) Shows the arrangement of rotating
drum inside the reactor and (b) shows the cross section of the drum. From: Dhungana, Basu, &
Dutta, 2012
Microwave
Microwave irradiation can be used to internally heat biomass by absorbing microwave energy and converting it to heat. The advantage of this technology is that it is not dependent on heat transfer between the particles and gas, a wall or other particles. Instead, the heating is internal to each particle (A Dhungana et al., 2012). The disadvantage is the need for electrical energy to produce the microwaves and therefore, the difficulty or inability to utilize the energy contained in the volatile gas
to provide energy to the torrefaction process.
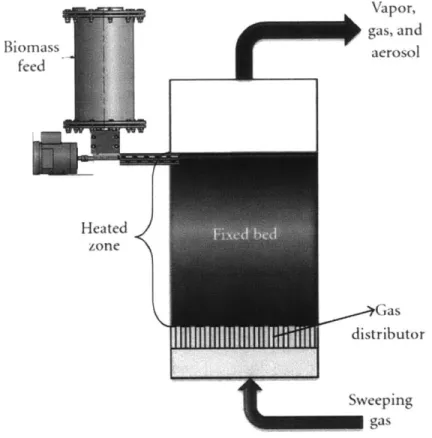
Fixed Bed
This reactor type contains no moving parts. Biomass enters the top of a reactor chamber and a heat-carrying gaseous medium is counter-flowed through the chamber, as shown in Figure 7. Torrefied biomass exits the bottom of the reactor and volatile gases are removed from the top. The main advantage of this design is its
mechanical simplicity. The drawbacks of this system are possible heterogeneity of the
output resulting from no mixing within the chamber, the large pressure drop across
the packed bed of material which requires a high driving pressure for counter-flow of
the heat-carrying gaseous medium, and challenges maintaining a consistent and
predictable flow of biomass through the system.
Va por,
Fluidized Bedi I I Clt ed
Figure 7 -Fixed bed reactor concept for biomass pyrolysis. Reproduced from: Verma et al., 2012
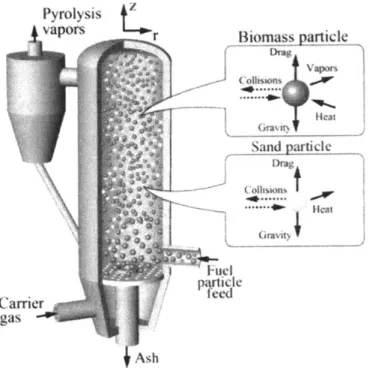
Fluidized Bed
Fluidized bed reactors use heat carrier solids such as sand or metal shot and flowing inert gas to mix and transfer heat to biomass particles in the reactor, as shown in Figure 8. In fluidized bed reactors, there is conductive heat transfer from the heat
carrier solid to the biomass particles and direct convective heat transfer from the
fluidizing gas. The reactors offer rapid processing times and consistent, homogeneous
fuel output. The main drawbacks of this reactor type are the need to separate the heat
carrier solids from the torrefied biomass after treatment and dilution of the volatile
gases. This reactor architecture is commonly used in processes which require rapid heating times such as fast pyrolysis.
,pors r Bo aspr
I~partide
I eed ( aricr
0;JS -4P"
Figure 8 - Circulating fluidized bed reactor schematic. Reproduced from: Trendewicz, Braun,
Dutta, & Ziegler, 2014
Screw Reactor
Screw reactors such as the one shown in Figure 9 utilize an auger for transport of the biomass through the reactor chamber. These types of reactors are heated indirectly through contact of the biomass particles with the hot reactor wall or the heated auger.
The main advantages are its simplicity and low-cost. The drawbacks of this type of reactor are its limited scalability due to heat transfer limitations and issues with torrefaction homogeneity due to limited mixing.
A-4
~1~~.
TA4
Figure 9 -Auger-type screw reactor. From: Koppejan, 2012 Multiple Hearth Furnace (Herreshoff Oven)
In a multiple hearth furnace, biomass is heated gradually as it is transported from
plate to plate within the reactor, as shown in Figure 10. This process of mechanical
transport causing material to cascade through the system results in homogeneously
torrefied material. This architecture can also provide good control over the heating
rate of the material by controlling the burners or temperature of the injected heat
carrier gas at each level (Moscicki, Niedzwiecki, Owczarek, & Wnukowski, 2014). The
disadvantages of this system are its large size-to-throughput ratio and the dilution of
volatile gases with the heat carrier gas used.
-Figure 10 -Multiple hearth furnace reactor (Herreshoff Oven). Reproduced from: Koppejan,
CHAPTER 3: FIXED BED PROTOTYPE
A fixed-bed torrefaction reactor was developed for investigations of volatile
combustion, biomass material handling, and torrefaction process conditions. The development and construction of this system and its components are described in the
following chapter.
3.1 Proposed Gravity-Driven Fixed Bed Concept
A gravity-fed fixed-bed reactor was initially proposed by Kung (2014). In this design
(Figure 11), biomass is fed into the
conveyor acts as both a
metering valve, to control the
feed rate of material into the
reactor zone, and to reduce the
flow of air through the opening.
Above the screw conveyor,
biomass is heated and dried to
reduce the moisture content of
biomass prior to entering the
reactor zone. As biomass
travels downwards through the
system, it is heated by both
Fi
radial and axial conduction and Fi fr
radiation, by natural
reactor using a short screw conveyor.
E xhau t omass A' feed Warm flue ga DryerStea m Reactor I %_ V1 -tls Pore, fo S oi tor ge Sct d I rampOrt This screw IAir
gure 11 -The proposed architecture of the gravity-fed
xed bed torrefaction reactor concept. Reproduced om: Kung, 2014
convection resulting from the heated side walls and bottom, and by forced convection
resulting from devolatilization of the material.
As shown in Figure 11, the conical bottom of the reactor zone is a perforated wall.
These pores are small enough to prevent biomass from passing through them, but
large enough to allow the volatile gases to escape with limited flow resistance. Since
the vertical screw conveyor between the dryer and the reactor is packed with
biomass in a plug-flow condition, it is hypothesized that this will create a large
resistance to volatile gas flow. This will result in the majority of the volatile gas
following the path of least resistance through the bottom of the fixed bed and into the
combustion chamber. The remaining solids pass through the reactor into the
collection area and are carried away by a second conveyor system.
Once the volatile gases pass into the combustion chamber, they mix with air and are
obustedU3 . T 11 t fIlue g as- heats Lthe btt and sides of the reactor I- er Lo provide heat for the torrefaction reaction. Before the flue gas is exhausted, it is passed
over the dryer section to provide direct convective heat exchange with the material
in the dryer portion. The separate dryer portion improves combustion efficiency as it
allows for steam to escape with the flue gas rather than allowing it to mix with the
volatiles in the fixed-bed zone.
With this architecture, the material residence time and the fill-level of the reactor can
be controlled by adjusting the speed of each screw conveyor. By controlling these
parameters, the system can be made to operate autothermally, meaning that the
the material without the need for an external heat input. It can also prevent
flame-out by ensuring a sufficiently high volatile gas flow rate to maintain a high
temperature within the combustion chamber.
The system was designed to meet four key design criteria (Kung, 2014):
1. The system should operate as close to the autothermal condition as possible in order to maximize the energy efficiency of the overall system
2. The radius and height of the fixed bed reactor should not exceed 5 meters
3. The heat transfer should be sufficient to adequately torrefy the biomass
4. The combustor temperature should be maintained sufficiently high so as to
prevent flame-out should the properties of the feedstock vary
As described in the work by Kung (2014b), thermochemical and heat transfer models
were developed using process and feedstock parameters such as torrefaction
temperature, residence time, and biomass particle size as input variables. These
models were used to predict heat transfer mechanisms and rates within the reactor
3.2 Moving Bed Concept
In order to address concerns with material transport and volatile gas flow in the
original proposed design, a moving packed-bed design was conceptualized. The main
concerns with the existing fixed-bed design were:
1. Biomass, char, and tar formation would result in blockages of the perforated surface, hindering permeation of volatile gases through the fixed-bed wall
2. The perforated surface of the fixed bed would not provide a smooth ramp for
the charred biomass to slide down into the char storage bin
3. Any bridging or blockage formation between the reactor and char collection area could not be broken-up without shutting down and dismantling the
reactor
4. The volatile gases produced in the upper regions of the fixed bed may still be
driven by pressure through the upper screw conveyor and out through the
exhaust, rather than through the perforations and into the combustion
chamber
5. Lack of mixing and low bulk conductivity will result in a large radial temperature gradient within the fixed bed, resulting in inhomogeneous
torrefaction of the material
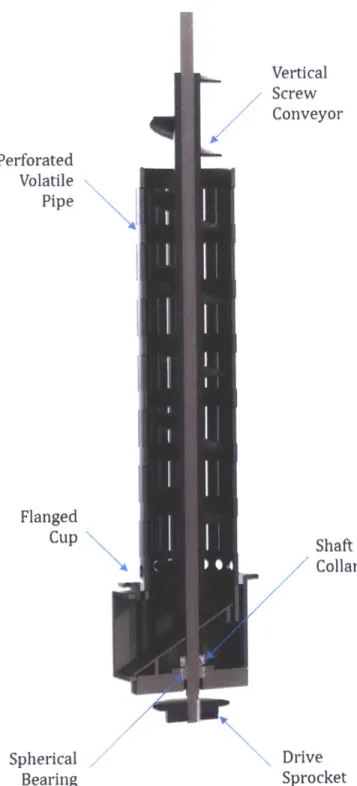
The concept for the moving-bed design is shown in Figure 12. In this system, heating
difference in the moving-bed design is that the material is heated up to the point of
devolatilization in the fixed-bed portion of the reactor, then the material is conveyed
through a long, perforated pipe, where it continues to be heated and devolatilizes. The
perforations on the vertical wall of the screw conveyor pipe are less likely to be
blocked by biomass and tar formation, do not impede the flow of biomass through the
system, and provide a low resistance escape path for the volatile gases. As in the
previous design, upward travel of the volatile gas is impeded by the upper screw
conveyor. In the moving-bed design, upward flow of the volatiles is now also impeded
Top Screw C"Onveyor Fixed Bed Zone Lower Scr ew 4 Conveyor Char Removal Conveyor
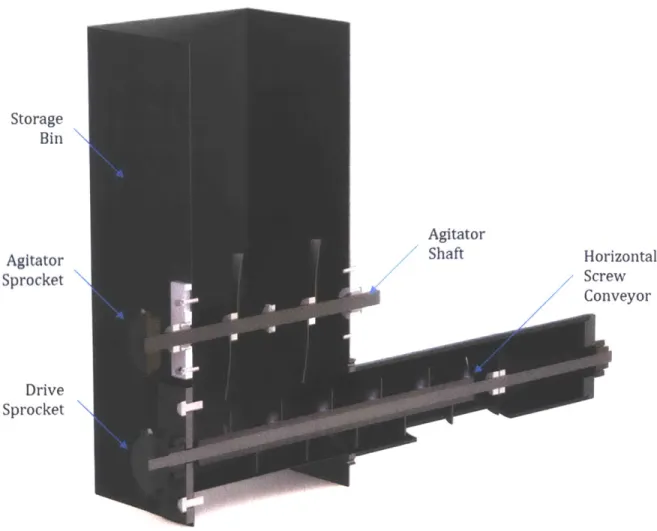
3.3 Moving Bed Prototype Design
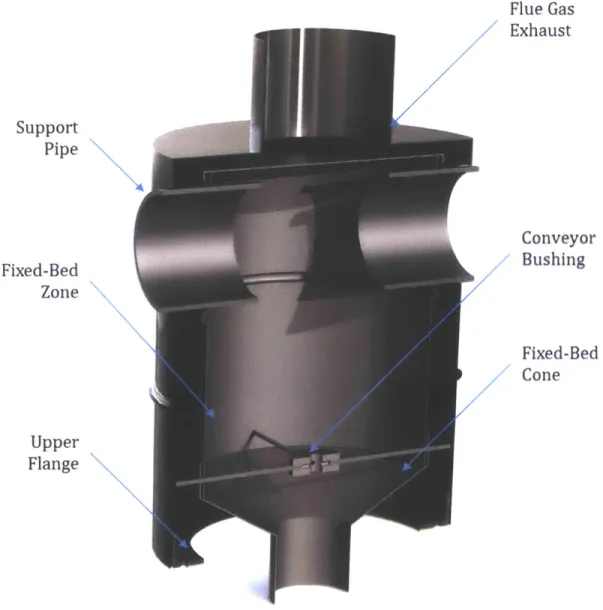
As shown in Figure 13, the moving-bed reactor concept was divided into five
sub-assemblies: Storage & Feed, Fixed Bed Zone, Combustor, Lower Conveyor, and
Product Storage. -------------- --
-2
41, 1. Stor 2. Fixe 3. Com 4. Low 5. Proc"'400
age & Feed d Bed Zone bustor er Conveyor
uct Storage
Figure 13 -Sub-assemblies of the moving-bed prototype reactor.
I r r _j It it