HAL Id: hal-00682887
https://hal.archives-ouvertes.fr/hal-00682887
Submitted on 23 Oct 2013
HAL is a multi-disciplinary open access
archive for the deposit and dissemination of
sci-entific research documents, whether they are
pub-lished or not. The documents may come from
teaching and research institutions in France or
abroad, or from public or private research centers.
L’archive ouverte pluridisciplinaire HAL, est
destinée au dépôt et à la diffusion de documents
scientifiques de niveau recherche, publiés ou non,
émanant des établissements d’enseignement et de
recherche français ou étrangers, des laboratoires
publics ou privés.
Exposure to Phthalates and Phenols during Pregnancy
and Offspring Size at Birth.
Claire Philippat, Marion Mortamais, Cécile Chevrier, Claire Petit, Antonia M.
Calafat, Xiaoyun Ye, Manori J. Silva, Christian Brambilla, Isabelle Pin,
Marie-Aline Charles, et al.
To cite this version:
Claire Philippat, Marion Mortamais, Cécile Chevrier, Claire Petit, Antonia M. Calafat, et al..
Ex-posure to Phthalates and Phenols during Pregnancy and Offspring Size at Birth.. Environmental
Health Perspectives, National Institute of Environmental Health Sciences, 2012, 120 (3), pp.464-70.
�10.1289/ehp.1103634�. �hal-00682887�
Diesters of phthalic acid (phthalates) and phe nols are found in many consumer products. Low molecular weight (MW) phthalates (MW < 250 g/mol) are used in personal care prod ucts (perfumes, cosmetics) or as coating for pharmaceutical products. High MW phtha lates (MW > 250 g/mol) tend to be used in polyvinylchloride loor and wall covering, food packaging, and medical devices (Calafat et al. 2006; Hauser and Calafat 2005). Phenols are used in food packaging [bisphenol A, (BPA)], polycarbonates (BPA), cosmetics (parabens), soap [triclosan (TCS)], and sunscreen [benzo phenone3 (BP3)] (Calafat et al. 2008). Precursors of dichlorophenols (DCPs) are used as intermediates in the production of several herbicides or insecticides (Agency for Toxic Substances and Disease Registry 2006).
Widespread exposure to phthalates and phenols has been documented for preg nant women in several industrialized coun tries (Adibi et al. 2008; Braun et al. 2011; Cantonwine et al. 2010; Wolf et al. 2008; Ye et al. 2008, 2009). Some of these com pounds can cross the placenta in humans (Balakrishnan et al. 2010; Mose et al. 2007),
and phthalates have been detected in cord blood (Latini et al. 2003), amniotic fluid (Huang et al. 2009; Silva et al. 2004), and meconium (Zhang et al. 2009).
Little is known about the consequences of prenatal exposures to phthalates and phenols on fetal growth. An American cohort study of 404 mother–infant pairs reported an inverse associa tion for 2,5DCP maternal urinary concentra tions and a positive association for BP3 urinary concentrations with birth weight in male but not in female newborns (Wolf et al. 2008).
Our aim was to study the relationships between prenatal exposures to phthalates and phenols and weight, length, and head circum ference at birth among male newborns.
Population and Methods
Study population. We conducted a case–
control study of male malformations of the genitalia nested in the EDEN (Etude des Déterminants pré et post natals du développe ment et de la santé de l’Enfant) and PELAGIE mother–child cohorts. These cohorts are described elsewhere (Drouillet et al. 2009; Garlantezec et al. 2009). Briely, the EDEN
cohort consists of 2,002 pregnant women recruited before the end of the 28th gestational week from April 2003 through March 2006 in the obstetrical departments of the University Hospitals of Nancy and Poitiers, France. he PELAGIE cohort consists of 3,421 pregnant women enrolled before 19 weeks of gesta tion from April 2002 through February 2006 in three districts of Brittany: Ille et Vilaine, Finistère, and Côtes d’Armor, France. The present study includes all of the male new borns with undescended testis or hypospadias (identified at birth by pediatricians; n = 48 in EDEN and 24 in PELAGIE). In addi tion, three male newborns without congenital malformation of the genitalia (controls) were matched to each case by recruitment center, date of recruitment (± 6 months), day of week (weekend yes/no), and gestational week when the maternal urine sample was collected, for a total of 288 mother–newborn pairs (72 cases and 216 controls). Participants provided
Address correspondence to C. Philippat, Institut Albert Bonniot – Centre de Recherche INSERM UJF U823, UJF Site Santé, BP 170 – La Tronche – Grenoble 38042 Cedex 9 France. Telephone: 33 4 76 54 94 66. Fax: 33 4 76 54 94 14. Email: Claire. Philippat@e.ujfgrenoble.fr
Supplemental Material is available online (http:// dx.doi.org/10.1289/ehp.1103634).
We are indebted to the midwife research assistants for data collection, to P. Lavoine and J. Sahuquillo for checking, coding, and data entry, and to A. Forhan for data management.
his work was supported by the French Agency for Food, Environmental and Occupational Health and Safety (ANSES). he EDEN cohort is funded by la Fondation pour la Recherche Médicale, INSERM, l’Institut de Recherche en Santé Publique, Nestlé, French Ministry of Health, l’Agence Nationale de la Recherche (ANR), l’Université ParisSud, l’Institut de veille sanitaire (InVS), ANSES, and Mutuelle Générale de l’Education Nationale. he PELAGIE cohort is funded by ANR, InVS, INSERM, and the Regional Council of Brittany.
The funding sources had no role in the study design, collection, or interpretation of data, in the writing of the report, or in the decision to submit the paper for publication. he indings and conclusions in this report are those of the authors and do not nec essarily represent the views of the Centers for Disease Control and Prevention.
he authors declare they have no actual or potential competing inancial interests.
Received 4 March 2011; accepted 7 September 2011.
Exposure to Phthalates and Phenols during Pregnancy and Offspring Size
at Birth
Claire Philippat,1,2 Marion Mortamais,1,3 Cécile Chevrier,4 Claire Petit,4 Antonia M. Calafat,5 Xiaoyun Ye,5
Manori J. Silva,5 Christian Brambilla,2,6 Isabelle Pin,1,7 Marie-Aline Charles,8 Sylvaine Cordier,4 and Rémy Slama1,2
1Institut National de la Santé et de la Recherche Médicale (INSERM), Institut Albert Bonniot (U823), Team of Environmental
Epidemiology Applied to Reproduction and Respiratory Health, Grenoble, France; 2Grenoble University, Institut Albert Bonniot,
Grenoble, France; 3INSERM, U1061, Montpellier, France; 4INSERM, U625, University of Rennes I, Institut fédératif de recherche 140
(IFR140); Rennes, France; 5Centers for Disease Control and Prevention, Atlanta, Georgia, USA; 6INSERM and Grenoble University,
Institut Albert Bonniot (U823), Molecular Basis of Lung Cancer Progression, Grenoble, France; 7Service de Pédiatrie, Centre Hospitalier
Universitaire de Grenoble, France; 8INSERM, U1018, Centre de recherche en Épidémiologie et Santé des Populations (CESP), Team
Epidemiology of Diabetes, Obesity and Renal Disease: Lifelong Approach, Villejuif, France
BACKGROUND: Data concerning the effects of prenatal exposures to phthalates and phenols on fetal growth are limited in humans. Previous findings suggest possible effects of some phenols on male birth weight.
OBJECTIVE: Our aim was to assess the relationships between prenatal exposures to phthalates and phenols and fetal growth among male newborns.
METHODS: We conducted a case–control study on male malformations of the genitalia nested in two French mother–child cohorts with recruitment between 2002 and 2006. We measured, in maternal urinary samples collected between 6 and 30 gestational weeks, the concentrations (micro-grams per liter) of 9 phenol (n = 191 pregnant women) and 11 phthalate metabolites (n = 287). Weight, length, and head circumference at birth were collected from maternity records. Statistical analyses were corrected for the oversampling of malformation cases.
RESULTS: Adjusted birth weight decreased by 77 g [95% confidence interval (CI): –129, –25] and by 49 g (95% CI: –86, –13) in association with a 1-unit increase in ln-transformed 2,4-dichlorophenol (DCP) and 2,5-DCP urinary concentrations, respectively. Benzophenone-3 (BP3) ln-transformed concentrations were positively associated with weight (26 g; 95% CI: –2, 54) and head circumfer-ence at birth (0.1 cm; 95% CI: 0.0, 0.2). Head circumfercircumfer-ence increased by 0.3 cm (95% CI: 0.0, 0.7) in association with a 1-unit increase in ln-transformed BPA concentration. For phthalate metabolites there was no evidence of monotonic associations with birth weight.
CONCLUSIONS: Consistent with findings of a previous study, we observed evidence of an inverse
association of 2,5-DCP and a positive association of BP3 with male birth weight.
KEYWORDS: birth outcomes, fetal growth, phenols, phthalates, pregnancy exposure, urinary
bio-markers. Environ Health Perspect 120:464–470 (2012). http://dx.doi.org/10.1289/ehp.1103634 [Online 7 September 2011]
Phenols, phthalates, and birth weight
informed consent for data and biological sam ple collection for themselves and their off spring. hese cohorts received the approvals of the appropriate ethical committees. The involvement of the Centers for Disease Control and Prevention (CDC) laboratory was limited and determined not to constitute engagement in human subjects research.
Outcomes. We extracted from hospital
maternity records weight, length, and head circumference assessed at birth.
Exposure assessment. Urine was col
lected between 6 and 19 gestational weeks in the PELAGIE cohort and between 24 and 30 gestational weeks in the EDEN cohort. Assessment of biomarker and creatinine con centrations in maternal urine was done by the National Center for Environmental Health laboratory at the CDC in Atlanta, Georgia, USA (Silva et al. 2007; Ye et al. 2005). We measured the urinary concentrations of 11 phthalate metabolites in samples from all mothers (n = 287; 72 cases and 215 controls because the vial of one control broke dur ing transport to the CDC laboratory). Nine phenols were measured in urine samples col lected from mothers in the EDEN cohort only (n = 191; 48 cases and 143 controls) (phe nols could not be measured in the PELAGIE cohort because a preservative added to the samples interferes with the assay used).
Molar concentrations of four metabo lites of di(2ethylhexyl) phthalate (DEHP) [mono(2ethylhexyl) phthalate (MEHP); mono(2ethyl5hydroxyhexyl) phthalate (MEHHP); mono(2ethyl5oxohexyl) phtha late (MEOHP); and mono(2ethyl5carboxy pentyl) phthalate (MECPP)] were summed as total DEHP. Concentrations of phthalate metabolites of MW > 250 g/mol and of MW < 250 g/mol were summed as total of high MW phthalates (∑HMW) and of low MW phthalates (∑LMW), respectively. Total para ben concentration (∑PB) was calculated by summing methyl paraben (MP), ethyl paraben (EP), propyl paraben (PP), and butyl paraben (BP) molar concentrations. Monoethyl phtha late (MEP) and monobenzyl phthalate (MBzP) concentrations have been corrected [multiplied by 0.66 (MEP) and 0.72 (MBzP)] because the analytical standards used were of inadequate purity (Calafat AM, personal communication).
Statistical analyses. We replaced concen
trations below the limit of detection (LOD) by LOD/√–2. We corrected the overrepresen tation of congenital abnormalities, induced by the case–control design, using a reweight ing approach. We used centerspeciic weights corresponding to the inverse of the inclusion probability of controls, so as to give cases and controls the same relative weight as in the original cohorts (Richardson et al. 2007). Sensitivity analyses restricted to controls were also conducted.
To limit the impact of betweensubject variations in urine sampling conditions, we standardized biomarker concentrations using a twostep standardization method based on regression residuals. First, we estimated asso ciations between lntransformed biomarker concentrations and sampling conditions [hour of sampling (for EDEN only), gestational age at collection, duration of storage at room tem perature before freezing, and season and day of sampling] using separate linear regression mod els for each biomarker adjusted for maternal age, body mass index (BMI) before pregnancy, parity, year of sampling, education, current occupation, active smoking, and center. Next, we used these data to estimate biomarker con centrations that would have been observed if all samples had been collected under the same conditions (e.g., 0730 hours for hour of sam pling). Unless otherwise speciied, all concen trations are the standardized values; we also report associations with biomarker concentra tions not standardized for sampling conditions. Associations between each standardized maternal urinary biomarker concentration and birth weight, birth length, or head circumfer ence were estimated using separate weighted linear regressions. Biomarker concentrations (micrograms per liter) were lntransformed or coded in tertiles. We performed tests of hetero geneity in outcome value across expo sure tertiles; pvalues of trend tests were esti mated using categorical variables whose values corresponded to the tertilespecific median biomarker levels. Situations in which biomark ers exhibited heterogeneity in outcome across tertiles (low pvalue, heterogeneity test) but with little support for a trend (high pvalue, trend test) were considered as suggestive of a nonmonotonic association. [A monotonic trend does not reverse direction but may have lat segment (Rothman et al. 2008).] We also estimated adjusted relationships between stan dardized biomarker concentrations and birth weight using restricted cubic splines (Harrell 2001). Adjustment factors were all variables possibly related to birth outcomes (based on a priori knowledge), including maternal prepregnancy weight (broken stick model with a knot at 60 kg) (Slama and Werwatz 2005), maternal height (continuous), maternal smok ing (never, 1–5, ≥ 6 cigarettes per day), par ity (0, 1, ≥ 2), education level (high school or less, up to 2 years after high school, ≥ 3 years after high school), gestational duration (linear and quadratic terms), and recruitment center. In addition, we adjusted for urinary creatinine concentration (continuous, non transformed) as a marker of urine dilution. Gestational duration was estimated using the date of last menstrual period (LMP) (Slama et al. 2008) or gestational duration assessed by the obstetrician if it difered from the LMP based estimate by > 2 weeks. Adjustment for
the obstetricianestimated gestational age instead of the LMPbased gestational age did not modify results (not shown). Models for head circumference at birth were also adjusted for the mode of delivery (because passage through the birth canal may influence head circumference at birth).
We performed sensitivity analyses excluding women with pregnancyinduced hypertension (n = 17) or gestational diabetes (n = 15). All analyses were performed using STATA/SE, ver sion 11 (StataCorp, College Station, TX, USA).
To draw our conclusion, we gave more weight to results in agreement with our a priori hypotheses, namely, an efect of BP3 and 2,5 DCP on male birth weight (Wolf et al. 2008). Other associations (highlighted on the basis of their pvalues, without relying on threshold
pvalue to deine statistical signiicance) were
considered as hypothesisgenerating.
Results
Study population. The 287 women were
29 years old, on average; 17% smoked dur ing the irst trimester of pregnancy (Table 1). Average gestational age at delivery was 39.8 weeks, average birth weight was 3,393 g (5th–95th percentiles, 2,640–4,130 g) and seven newborns (2%) weighed < 2,500 g. Average birth length was 50 cm (5th–95th percentiles, 47–54 cm), and average head circumference at birth was 35 cm (5th–95th percentiles, 32–37 cm) (Table 1).
We detected 8 of the 11 phthalate metab olites and 5 of the 9 phenols in at least 95% of the samples (Table 2).
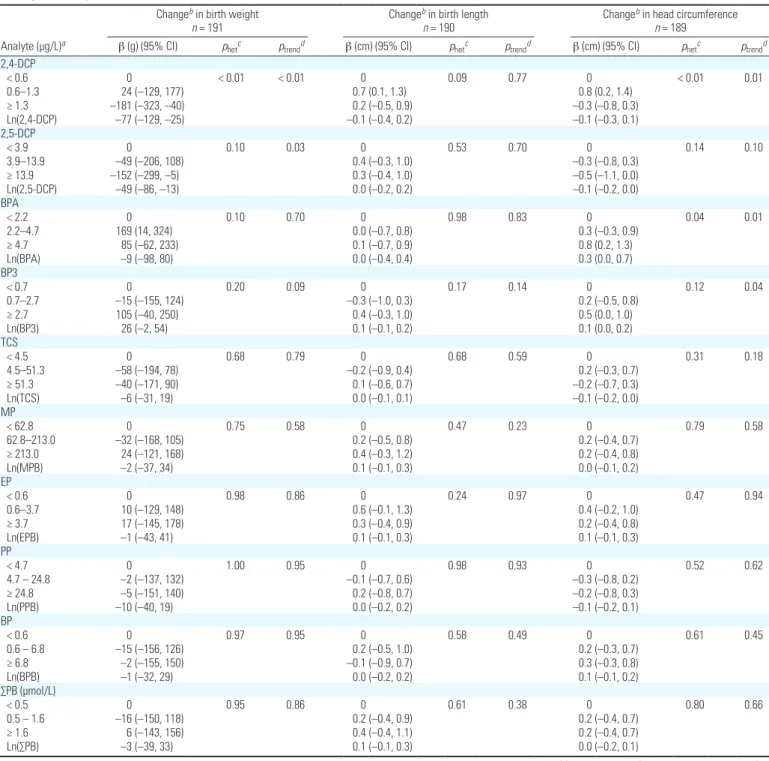
Phenols and birth outcomes. Birth weight
decreased by 49 g [95% conidence interval (CI): –86, –13] in association with a 1unit increase in lntransformed 2,5DCP concen tration. After categorizing exposures in tertiles, boys in the highest exposure tertile were 152 g lighter, on average, compared with boys in the lowest tertile (95% CI: –299, –5) (Table 3). We observed a similar association between 2,4DCP and birth weight [Table 3; see also Supplemental Material, Figure 1 (http:// dx.doi.org/10.1289/ehp.1103634)], consistent with the high correlation between 2,4DCP and 2,5DCP (r = 0.95). 2,5DCP lntrans formed concentration was also inversely asso ciated with head circumference at birth (–0.1 cm, 95% CI: –0.2, 0.0).
Each 1unit increase in lntransformed BP3 concentration was associated with an increase of 26 g in birth weight (95% CI: –2, 54) and of 0.1 cm in head circumference at birth (95% CI: 0.0, 0.2) (Table 3).
For BPA, estimates suggested an inverse Ushape association: birth weight increased by 169 g (95% CI: 14, 324) in the second BPA concentration tertile and by 85 g (95% CI: –62, 233) in the third concentration ter tile, compared with the first [Table 3; see
also Supplemental Material, Figure 2 (http:// dx.doi.org/10.1289/ehp.1103634) for associa tions based on a restricted cubic spline model]. BPA concentrations were positively associated with head circumference, which increased by 0.8 cm in the highest BPA concentration ter tile compared with the lowest tertile (95% CI: 0.2, 1.3) (Table 3).
For all other phenols, there was no evi dence of associations with ofspring measures at birth [all p for heterogeneity were > 0.24 (Table 3), and curves obtained using restricted cubic splines did not clearly support an asso ciation. See Supplemental Material, Figure 2 (http://dx.doi.org/10.1289/ehp.1103634)].
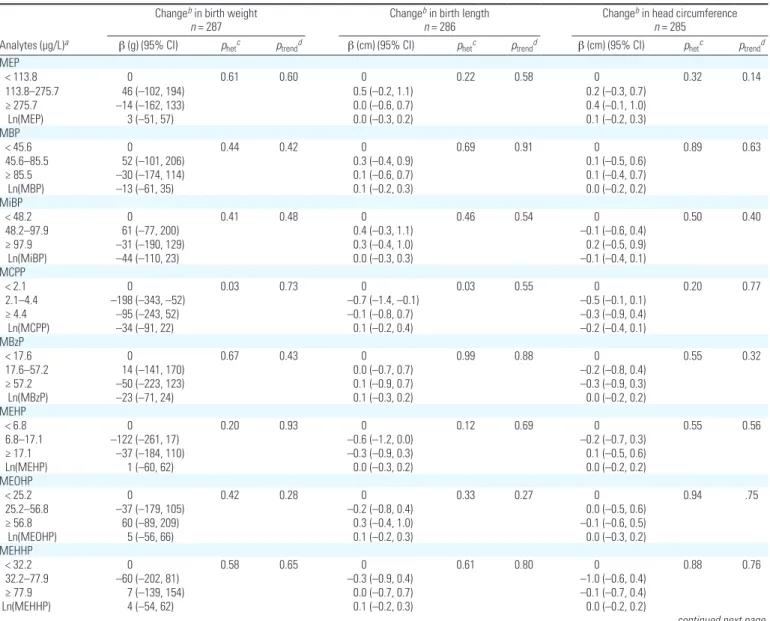
Phthalates and birth outcomes. For phtha
late metabolite concentrations and birth weight, all p for trend were > 0.14 (Table 4). There was some evidence of heterogene ity in mean birth weight across concentra tion tertiles for some phthalate metabolites: the lowest pvalues for heterogeneity were observed for mono(3carboxypropyl) phtha late (MCPP) and MECPP; given the high values of p for trend, results were suggestive of nonmonotonic associations (Table 4). For MECPP, but less so for MCPP, this non monotonic association was also supported by the restricted cubic spline analysis to some extent [see Supplemental Material, Figure 3 (http://dx.doi.org/10.1289/ehp.1103634)].
Regarding other birth outcomes, the low est pvalues for heterogeneity were observed with MCPP, monocarboxyisooctyl phthalate (MCOP), monocarboxyisononyl phthalate (MCNP), MEHP, and ∑HMW phthalates for birth length, and with ∑LMW phthalates for head circumference at birth (Table 4).
Sensitivity analyses. For phenols, asso
ciations with birth outcomes remained similar after exclusion of 48 cases of male mal formations of the genitalia [See Supplemental Material, Table 1 (http://dx.doi.org/10.1289/ ehp.1103634)]. Using biomarker concentra tions not standardized for sampling conditions instead of concentrations standardized for sam pling conditions did not markedly change asso ciations between birth weight and, variously, 2,4DCP, 2,5DCP, BP3, or BPA. Similarly, associations between head circumference at birth and either BP3 or BPA remained similar (see Supplemental Material, Table 1).
In analyses restricted to controls only or using concentrations not standardized for sampling conditions, findings concerning phthalates were consistent with those obtained in the main analysis, except for MECPP: he birth weight change observed in the second MECPP concentration tertile was –141 g (95% CI: –277, –5) in the whole study popu lation, –79 g (95% CI: –220, 61) after exclu sion of cases, and –51 g (95% CI: –187, 84) using nonstandardized biomarker concentra tions [see Supplemental Material, Table 2].
Table 2. Urinary phenol (n = 191) and phthalate (n = 287) biomarker concentrations after correction for case–control sampling (EDEN and PELAGIE cohorts, 2002–2006).
Standardized concentrations,a
percentiles (µg/L)
Measured concentrations, percentiles (µg/L)
Analyte LOD (µg/L) % > LOD 5th 50th 95th 5th 50th 95th
Phenols 2,4-DCP 0.2 95.9 0.2 0.8 8.6 0.2 0.9 10.2 2,5-DCP 0.2 99.5 1.4 6.4 316.0 1.8 10.2 442.0 BPA 0.4 98.5 0.8 3.1 10.1 0.6 2.7 9.8 BP3 0.4 80.5 0.2 1.3 74.5 0.3 1.7 143.0 TCS 2.3 84.1 1.0 17.5 464.6 1.6 24.1 634.0 MP 1.0 100.0 9.0 104.3 2689.7 9.1 97.8 3520 EP 1.0 67.7 0.2 1.5 38.2 0.7 4.1 62.3 PP 0.2 96.9 0.3 10.4 267.7 0.5 12.5 402.0 BP 0.2 79.5 0.1 2.2 63.6 0.1 1.7 53.8 Phthalates MEP 0.5 100.0 28.1 105.3 727.0 24.9 110.22 983.4 MBP 0.6 100.0 10.2 58.1 487.5 7.6 48.1 398.0 MiBP 0.3 100.0 15.6 64.7 365.3 10.9 45.9 219.0 MBzP 0.2 100.0 2.7 21.7 209.2 2.0 17.7 116.6 MCPP 0.2 98.3 0.6 3.2 13.8 0.4 2.2 10.0 MEHP 1.2 91.8 1.8 10.5 62.3 0.8 7.1 40.7 MEHHP 0.7 100 8.0 48.3 246.2 4.6 32.3 147.0 MEOHP 0.7 99.7 6.3 36.0 169.6 3.6 25.0 112.0 MECPP 0.6 100.0 18.9 67.2 303.0 11.6 43.8 183.0 MCOP 0.7 92.1 0.9 3.9 25.8 0.5 2.7 17.2 MCNP 0.6 91.8 0.9 3.1 22.8 0.6 1.7 11.7
Abbreviations: BP, butyl paraben; BPA, bisphenol A; BP3, benzophenone-3; EP, ethyl paraben; MBP, mono-n-butyl phthalate; MBzP, monobenzyl phthalate; MCNP, monocarboxy-isononyl phthalate; MCOP, monocarboxy-isooctyl phtha-late; MCPP, mono(3-carboxypropyl) phthaphtha-late; MECPP, 5-carboxypentyl) phthaphtha-late; MEHHP, mono(2-ethyl-5-hydroxyhexyl) phthalate; MEHP, mono(2-ethylhexyl) phthalate; MEOHP, mono(2-ethyl-5-oxohexyl) phthalate; MEP, monoethyl phthalate; MiBP, mono-isobutyl phthalate; MP, methyl paraben; PP, propyl paraben; TCS, Triclosan; 2,4-DCP, 2,4-dichlorophenol; 2,5-DCP, 2,5-dichlorophenol.
aConcentrations were standardized for conditions of sampling such as hour of sampling (EDEN only), time elapsed
between sample collections and freezing, season and day of sampling, and gestational age at collection.
Table 1. Characteristics of French pregnant women and of their offspring (n = 287; EDEN and PELAGIE cohorts, 2002–2006).
Percentiles
Characteristic n (%) or meana 5th 50th 95th
Maternal age (years) (mean) 29.3 22 29 38
Duration of gestationb (mean) 39.7 37 40 42
Birth weight (g) (mean) 3,393 2,640 3,390 4,130
Birth length (cm) (mean) 50.1 47 50 54
Head circumference at birth (cm) (mean) 34.7 32 35 37
Gestational age at samplingb (weeks) (mean) 21.7 9 26 28
Creatinine concentration (g/L) (mean) 1.2 0.4 1.1 2.2
Parity 0 115 (40) 1 previous child 114 (40) ≥ 2 previous children 58 (20) Maternal education ≤ High school 133 (47)
High school + 2 years 62 (22)
≥ High school + 3 years 86 (31)
Missing value 6 Active smoking 0 238 (83) 1–5 cigarettes/day 30 (11) ≥ 6 cigarettes/day 17 (6) Missing value 2 Prepregnancy BMI (kg/m2) < 18.5 29 (10) 18.5–25.0 181 (64) > 25.0 73 (26) Missing value 4
Hour of urinary sampling
Before 0800 hours 108 (65)
0800–1000 hours 40 (24)
After 1000 hours 18 (11)
Missing value 121
Phenols, phthalates, and birth weight
hese sensitivity analyses are diicult to inter pret; restriction to controls decreased popu lation size, and standardization sometimes induced strong variations in the distribution of biomarker concentrations and hence in the cutof values of tertiles.
Excluding women with pregnancyinduced hypertension or gestational diabetes did not modify our main results (data not shown).
Discussion
Within our study population of male newborns, maternal urinary concentrations of 2,4DCP and 2,5DCP were associated with a birth weight decrease, whereas urinary concentrations of BP3 were positively associated with weight and head circumference at birth. BPA urinary concentrations were positively associated with head circumference. There was no evidence
of monotonic associations between phthalate metabolite concentrations and birth weight.
Phenols and birth outcomes. In our study
population, birth weight decreased by 152 g in the highest 2,5DCP concentration tertile com pared with the lowest tertile (95% CI: –299, –5). he only other human study addressing this issue reported a decrease by 210 g in the third 2,5DCP concentration tertile compared
Table 3. Adjusted associations between maternal urinary concentrations of phenol biomarkers standardized for sampling conditionsa and birth outcomes (EDEN
cohort, 2003–2006).
Analyte (µg/L)a
Changeb in birth weight
n = 191
Changeb in birth length
n = 190
Changeb in head circumference
n = 189
β (g) (95% CI) phetc ptrendd β (cm) (95% CI) phetc ptrendd β (cm) (95% CI) phetc ptrendd
2,4-DCP < 0.6 0 < 0.01 < 0.01 0 0.09 0.77 0 < 0.01 0.01 0.6–1.3 24 (–129, 177) 0.7 (0.1, 1.3) 0.8 (0.2, 1.4) ≥ 1.3 –181 (–323, –40) 0.2 (–0.5, 0.9) –0.3 (–0.8, 0.3) Ln(2,4-DCP) –77 (–129, –25) –0.1 (–0.4, 0.2) –0.1 (–0.3, 0.1) 2,5-DCP < 3.9 0 0.10 0.03 0 0.53 0.70 0 0.14 0.10 3.9–13.9 –49 (–206, 108) 0.4 (–0.3, 1.0) –0.3 (–0.8, 0.3) ≥ 13.9 –152 (–299, –5) 0.3 (–0.4, 1.0) –0.5 (–1.1, 0.0) Ln(2,5-DCP) –49 (–86, –13) 0.0 (–0.2, 0.2) –0.1 (–0.2, 0.0) BPA < 2.2 0 0.10 0.70 0 0.98 0.83 0 0.04 0.01 2.2–4.7 169 (14, 324) 0.0 (–0.7, 0.8) 0.3 (–0.3, 0.9) ≥ 4.7 85 (–62, 233) 0.1 (–0.7, 0.9) 0.8 (0.2, 1.3) Ln(BPA) –9 (–98, 80) 0.0 (–0.4, 0.4) 0.3 (0.0, 0.7) BP3 < 0.7 0 0.20 0.09 0 0.17 0.14 0 0.12 0.04 0.7–2.7 –15 (–155, 124) –0.3 (–1.0, 0.3) 0.2 (–0.5, 0.8) ≥ 2.7 105 (–40, 250) 0.4 (–0.3, 1.0) 0.5 (0.0, 1.0) Ln(BP3) 26 (–2, 54) 0.1 (–0.1, 0.2) 0.1 (0.0, 0.2) TCS < 4.5 0 0.68 0.79 0 0.68 0.59 0 0.31 0.18 4.5–51.3 –58 (–194, 78) –0.2 (–0.9, 0.4) 0.2 (–0.3, 0.7) ≥ 51.3 –40 (–171, 90) 0.1 (–0.6, 0.7) –0.2 (–0.7, 0.3) Ln(TCS) –6 (–31, 19) 0.0 (–0.1, 0.1) –0.1 (–0.2, 0.0) MP < 62.8 0 0.75 0.58 0 0.47 0.23 0 0.79 0.58 62.8–213.0 –32 (–168, 105) 0.2 (–0.5, 0.8) 0.2 (–0.4, 0.7) ≥ 213.0 24 (–121, 168) 0.4 (–0.3, 1.2) 0.2 (–0.4, 0.8) Ln(MPB) –2 (–37, 34) 0.1 (–0.1, 0.3) 0.0 (–0.1, 0.2) EP < 0.6 0 0.98 0.86 0 0.24 0.97 0 0.47 0.94 0.6–3.7 10 (–129, 148) 0.6 (–0.1, 1.3) 0.4 (–0.2, 1.0) ≥ 3.7 17 (–145, 178) 0.3 (–0.4, 0.9) 0.2 (–0.4, 0.8) Ln(EPB) –1 (–43, 41) 0.1 (–0.1, 0.3) 0.1 (–0.1, 0.3) PP < 4.7 0 1.00 0.95 0 0.98 0.93 0 0.52 0.62 4.7 – 24.8 –2 (–137, 132) –0.1 (–0.7, 0.6) –0.3 (–0.8, 0.2) ≥ 24.8 –5 (–151, 140) 0.2 (–0.8, 0.7) –0.2 (–0.8, 0.3) Ln(PPB) –10 (–40, 19) 0.0 (–0.2, 0.2) –0.1 (–0.2, 0.1) BP < 0.6 0 0.97 0.95 0 0.58 0.49 0 0.61 0.45 0.6 – 6.8 –15 (–156, 126) 0.2 (–0.5, 1.0) 0.2 (–0.3, 0.7) ≥ 6.8 –2 (–155, 150) –0.1 (–0.9, 0.7) 0.3 (–0.3, 0.8) Ln(BPB) –1 (–32, 29) 0.0 (–0.2, 0.2) 0.1 (–0.1, 0.2) ∑PB (µmol/L) < 0.5 0 0.95 0.86 0 0.61 0.38 0 0.80 0.66 0.5 – 1.6 –16 (–150, 118) 0.2 (–0.4, 0.9) 0.2 (–0.4, 0.7) ≥ 1.6 6 (–143, 156) 0.4 (–0.4, 1.1) 0.2 (–0.4, 0.7) Ln(∑PB) –3 (–39, 33) 0.1 (–0.1, 0.3) 0.0 (–0.2, 0.1)
Abbreviations: BP, butyl paraben; BPA, bisphenol A; BP3, benzophenone-3; MP, methyl paraben; EP, ethyl paraben; PP, propyl paraben; TCS, Triclosan; 2,4-DCP, 2,4-dichlorophenol; 2,5-DCP, 2,5-dichlorophenol; ∑PB, molecular sum of parabens. Regression models were corrected for the overrepresentation of cases of malformations of the genitalia by a weighting approach.
aConcentrations were standardized for conditions of sampling such as hour of sampling, time elapsed between sample collections and freezing, season and day of sampling, and
gesta-tional age at collection. bAdjusted for gestational duration, maternal prepregnancy weight and height, maternal smoking, maternal education level, parity, recruitment center, and
with the first (95% CI: –348, –71) (Wolff et al. 2008). Concentrations of 2,5DCP (and hence tertiles) were much higher in the study by Wolf et al. (median, 53 µg/L) than in ours (median standardized concentration, 6.4 µg/L). Wolf et al. also reported that boys were 0.3 cm shorter at birth per increase by 1 in ln(2,5DCP) (95% CI: –0.6, –0.4). Our results did not clearly support such an associa tion (0.0 cm per increase by 1 in ln(2,5DCP); 95% CI: –0.2, 0.2), but birth length is not very accurately assessed, implying potentially strong measurement error. 2,5DCP is a metabolite of 1,4dichlorobenzene, which is used as chem ical intermediate in the production of dyes and organic chemicals and found in mothballs and toiletdeodorizer blocks (Agency for Toxic Substances and Disease Registry 2006; Yoshida et al. 2002). Dichlorophenols may also be released from water treatments (Abrahamsson and Xie 1983).
2,4DCP was also associated with a birth weight decrease. It is a metabolite of 1,3di cholorobenzene, a minor contaminant of 1,4 dichlorobenzene (Agency for Toxic Substances and Disease Registry 2006; Yoshida et al. 2002), which may explain the high correla tion reported between concentrations of both DCPs. 2,4DCP is also an environmental trans formation intermediate of the antiseptic agent triclosan and of herbicides such as 2,4dichloro phenoxyacetic acid and 2(2,4dichloro phenoxy) propionic acid (Yang et al. 2010; Zona et al. 2002). Our results concerning 2,4DCP are difficult to compare with those of Wolf et al. (2008), who studied male and female newborns altogether for this compound.
Taken together, these studies suggest an efect of dichlorophenols, or one of their pre cursors, on birth weight.
BP3 urinary concentrations were positively associated with weight and head circumference
at birth. Boys were 105 g heavier (95% CI: –40, 250) in the highest BP3 concentration ter tile compared with the lowest. Similarly, Wolf et al. (2008) noted a birth weight increase in male infants in the highest BP3 concentration tertile compared with the lowest (betas not reported); they did not report efect estimates for BP3 and head circumference in males. Exposure to BP3 likely results from use of consumer products as sunscreens or cosmetics (Calafat et al. 2008).
BPA urinary concentrations were posi tively associated with head circumference at birth. After categorizing exposures in ter tiles, we observed an inverse Ushape asso ciation between BPA concentrations and birth weight. Such nonmonotonic dose–response curves between perinatal exposures to BPA and weight in early life have been reported in rodents (Rubin et al. 2001; Rubin and Soto 2009). However, urinary BPA concentrations
Table 4. Adjusted associations between maternal urinary concentrations of phthalate biomarkers standardized for sampling conditionsa and birth outcomes
(EDEN and PELAGIE cohorts, 2002–2006).
Changeb in birth weight
n = 287
Changeb in birth length
n = 286
Changeb in head circumference
n = 285 Analytes (µg/L)a β (g) (95% CI) p
hetc ptrendd β (cm) (95% CI) phetc ptrendd β (cm) (95% CI) phetc ptrendd
MEP < 113.8 0 0.61 0.60 0 0.22 0.58 0 0.32 0.14 113.8–275.7 46 (–102, 194) 0.5 (–0.2, 1.1) 0.2 (–0.3, 0.7) ≥ 275.7 –14 (–162, 133) 0.0 (–0.6, 0.7) 0.4 (–0.1, 1.0) Ln(MEP) 3 (–51, 57) 0.0 (–0.3, 0.2) 0.1 (–0.2, 0.3) MBP < 45.6 0 0.44 0.42 0 0.69 0.91 0 0.89 0.63 45.6–85.5 52 (–101, 206) 0.3 (–0.4, 0.9) 0.1 (–0.5, 0.6) ≥ 85.5 –30 (–174, 114) 0.1 (–0.6, 0.7) 0.1 (–0.4, 0.7) Ln(MBP) –13 (–61, 35) 0.1 (–0.2, 0.3) 0.0 (–0.2, 0.2) MiBP < 48.2 0 0.41 0.48 0 0.46 0.54 0 0.50 0.40 48.2–97.9 61 (–77, 200) 0.4 (–0.3, 1.1) –0.1 (–0.6, 0.4) ≥ 97.9 –31 (–190, 129) 0.3 (–0.4, 1.0) 0.2 (–0.5, 0.9) Ln(MiBP) –44 (–110, 23) 0.0 (–0.3, 0.3) –0.1 (–0.4, 0.1) MCPP < 2.1 0 0.03 0.73 0 0.03 0.55 0 0.20 0.77 2.1–4.4 –198 (–343, –52) –0.7 (–1.4, –0.1) –0.5 (–0.1, 0.1) ≥ 4.4 –95 (–243, 52) –0.1 (–0.8, 0.7) –0.3 (–0.9, 0.4) Ln(MCPP) –34 (–91, 22) 0.1 (–0.2, 0.4) –0.2 (–0.4, 0.1) MBzP < 17.6 0 0.67 0.43 0 0.99 0.88 0 0.55 0.32 17.6–57.2 14 (–141, 170) 0.0 (–0.7, 0.7) –0.2 (–0.8, 0.4) ≥ 57.2 –50 (–223, 123) 0.1 (–0.9, 0.7) –0.3 (–0.9, 0.3) Ln(MBzP) –23 (–71, 24) 0.1 (–0.3, 0.2) 0.0 (–0.2, 0.2) MEHP < 6.8 0 0.20 0.93 0 0.12 0.69 0 0.55 0.56 6.8–17.1 –122 (–261, 17) –0.6 (–1.2, 0.0) –0.2 (–0.7, 0.3) ≥ 17.1 –37 (–184, 110) –0.3 (–0.9, 0.3) 0.1 (–0.5, 0.6) Ln(MEHP) 1 (–60, 62) 0.0 (–0.3, 0.2) 0.0 (–0.2, 0.2) MEOHP < 25.2 0 0.42 0.28 0 0.33 0.27 0 0.94 .75 25.2–56.8 –37 (–179, 105) –0.2 (–0.8, 0.4) 0.0 (–0.5, 0.6) ≥ 56.8 60 (–89, 209) 0.3 (–0.4, 1.0) –0.1 (–0.6, 0.5) Ln(MEOHP) 5 (–56, 66) 0.1 (–0.2, 0.3) 0.0 (–0.3, 0.2) MEHHP < 32.2 0 0.58 0.65 0 0.61 0.80 0 0.88 0.76 32.2–77.9 –60 (–202, 81) –0.3 (–0.9, 0.4) –1.0 (–0.6, 0.4) ≥ 77.9 7 (–139, 154) 0.0 (–0.7, 0.7) –0.1 (–0.7, 0.4) Ln(MEHHP) 4 (–54, 62) 0.1 (–0.2, 0.3) 0.0 (–0.2, 0.2)
Phenols, phthalates, and birth weight
were relatively low in our study population, enhancing the analytical uncertainties and hence the potential for exposure misclassiica tion, which may limit our ability to distinguish monotonic from nonmonotonic associations.
Phthalates and birth outcomes. here was
no strong evidence of monotonic association between phthalate metabolite concentrations and birth outcomes, except for the possible positive association between MCNP and birth length. Our analyses suggested nonmonotonic associations with birth weight and birth length for some phthalate metabolites. To our knowl edge, such associations between phthalate metabolites and birth weight have not been reported previously in rodents or in humans and therefore should be considered cautiously.
Study population. To correct the overrepre
sentation of cases induced by our case–control design, we weighted the observations in regres sion models (Richardson et al. 2007). We also performed nonweighted analyses, restricted to controls, and our main results regarding birth weight remained similar to those based on the whole weighted study population.
Exposure assessment. Sampling con
ditions, such as hour of urine sampling or storage duration before freezing, may inlu ence the concentrations of several biomarkers (Mahalingaiah et al. 2008; Samandar et al. 2009). We used a twostep standardization method based on regression residuals to reduce undesirable variability in biomarker urinary concentrations due to sampling con ditions. To our knowledge, it is the irst time that such an approach has been applied to study associations between phthalate or phe nol prenatal exposures and birth outcomes. We repeated our analyses using concentra tions not standardized for sampling condi tions, and associations between DCPs or BP3 and birth weight or between BP3 and BPA and head circumference were similar.
Limitations. The assayed phenols and
phthalates and their metabolites have relatively short halflives in humans (typically ≤ 1 day), but accurate information is not available on halflives in pregnant women, in whom metabolism may differ compared with non pregnant women. We assessed exposures from
the urinary concentrations at a single point during pregnancy; increasing the number of urine samples collected would have provided a more accurate estimate of the average expo sure during the whole gestation. Adibi et al. (2008) reported that for phthalates, the prob ability of correctly classifying a woman into a lowexposure group based on a single urine sample, if she truly had low exposure based on multiple measurements, was between 0.43 for monoethyl phthalate (MEP) and 0.95 for monoisobutyl phthalate (MiBP). Concerning phenols, BPA concentrations also vary dur ing pregnancy (Braun et al. 2011). herefore, clearly there is exposure misclassification, whose amplitude difers according to the bio logically relevant exposure window (if any) and the compound considered.
We adjusted for many potential con founders, but residual confounding cannot be discarded. For example, speciic metabolic disorders associated with both fetal growth and xenobiotic metabolism would constitute potential confounders. In our study, excluding women with pregnancyinduced hypertension
Table 4. continued
Changeb in birth weight
n = 287
Changeb in birth length
n = 286
Changeb in head circumference
n = 285 Analytes (µg/L)a β (g) (95% CI) p
hetc ptrendd β (cm) (95% CI) phetc ptrendd β (cm) (95% CI) phetc ptrendd
MECPP < 45.8 0 0.08 0.59 0 0.40 0.43 0 0.90 0.65 45.8–105.4 –141 (–277, –5) –0.3 (–1.0, 0.4) 0.0 (–0.5, 0.6) ≥ 105.4 –20 (–162, 121) 0.2 (–0.6, 0.9) 0.1 (–0.4, 0.6) Ln(MECPP) 5 (–64, 73) 0.1 (–0.2, 0.4) 0.0 (–0.2, 0.3) MCOP < 2.4 0 0.87 0.87 0 0.11 0.19 0 0.77 0.79 2.4–5.9 –40 (–192, 110) –0.2 (–0.9, 0.4) –0.1 (–0.7, 0.4) ≥ 5.9 –27 (–200, 147) 0.4 (–0.5, 1.2) 0.0 (–0.6, 0.6) Ln(MCOP) –8 (–72, 55) 0.1 (–0.2, 0.4) 0.0 (–0.2, 0.3) MCNP < 2.3 0 0.85 0.99 0 0.11 0.08 0 0.89 0.72 2.3–4.6 –40 (–186, 107) 0.5 (–0.1, 1.2) –0.1 (–0.7, 0.4) ≥ 4.6 –15 (–189, 158) 0.9 (0.0, 1.7) –0.1 (–0.8, 0.5) Ln(MCNP) –3 (–67, 61) 0.3 (–0.1, 0.6) –0.1 (–0.3, 0.1) DEHP (µmol/L) < 0.4 0 0.43 0.29 0 0.18 0.39 0 0.80 0.68 0.4–0.9 –54 (–197, 88) –0.4 (–1.0, 0.2) 0.1 (–0.3, 0.6) ≥ 0.9 36 (–112, 186) 0.1 (–0.6, 0.9) 0.2 (–0.4, 0.7) Ln(DEHP) 5 (–60, 70) 0.1 (–0.2, 0.4) 0.0 (–0.2, 0.2) ∑LMW (µmol/L) < 1.2 0 0.32 0.14 0 0.29 0.53 0 0.12 0.52 1.2–2.7 –3 (–141, 135) 0.4 (–0.2, 1.1) 0.5 (0.0, 0.9) ≥ 2.7 –100 (–248, 47) 0.0 (–0.7, 0.7) 0.4 (–0.3, 1.0) Ln(∑LMW) –38 (–109, 34) –0.1 (–0.4, 0.2) –0.1 (–0.4, 0.2) ∑HMW (µmol/L) < 0.5 0 0.17 0.37 0 0.06 0.26 0 0.82 0.54 0.5–1.3 –99 (–243, 44) –0.5 (–1.2, 0.1) 0.0 (–0.5, 0.5) ≥ 1.3 19 (–161, 198) 0.2 (–0.6, 1.0) 0.2 (–0.5, 0.8) Ln(∑HMW) –2 (–70, 65) 0.1 (–0.2, 0.4) 0.0 (–0.2, 0.2)
Abbreviations: MBP, mono-n-butyl phthalate; MBzP, monobenzyl phthalate; MCNP, monocarboxyisononyl phthalate; MCOP, monocarboxy-isooctyl phthalate; MCPP, mono(3-carboxy-propyl) phthalate; MECPP, carboxypentyl) phthalate; MEHP, mono(2-ethylhexyl) phthalate; MEHHP, hydroxyhexyl) phthalate; MEOHP, mono(2-ethyl-5-oxohexyl) phthalate; MEP, monoethyl phthalate; MiBP, mono-isobutyl phthalate. DEHP, molecular sum of 4 metabolites of di(2-ethylhexyl) phthalate (MEHP, MEHHP, MEOHP, MECPP); ∑LMW, molecular sum of low-MW phthalates (MEP, MBP, and MiBP); ∑HMW, molecular sum of high-MW phthalates (MBzP, MCPP, MEHP, MECPP, MEHHP, MEOHP, MCOP, and MCNP). Regression models were corrected for the overrepresentation of cases of malformations of the genitalia by a weighting approach.
a
Concentrations were standardized for conditions of sampling such as hour of sampling (EDEN only), time elapsed between sample collections and freezing, season and day of
sam-pling, and gestational age at collection. b
Adjusted for gestational duration, maternal prepregnancy weight and height, maternal smoking, maternal education level, parity, recruitment
center, and urine dilution (creatinine level). Models for head circumference at birth were also adjusted for mode of delivery (cesarean section yes/no). c
p-Values of heterogeneity test.
d
or gestational diabetes did not alter associations with BPA and BP3 (not shown). Multiple comparisons are generally an issue in studies relying on several biomarkers. Although we did not formally correct for multiple compari sons, our choice to focus our conclusions on previously reported associations limits the risk of chance being a likely explanation for our main indings.
Conclusions
In our study, there was no strong evidence of monotonic association between phthalate metabolite concentrations and birth out comes. Urinary concentrations of 2,4DCP and 2,5DCP were negatively associated with birth weight, whereas BP3 concentrations were associated with a birth weight increase. Results concerning 2,5DCP and BP3 are in agreement with another publication concern ing male newborns from New York (Wolff et al. 2008).
CORRECTION
In Table 2, monoethyl phthalate (MEP) and monobenzyl phthalate (MBzP) con centrations have been corrected [multi plied by 0.66 (MEP) and 0.72 (MBzP)] because the analytical standards used were of inadequate purity.
REFERENCES
Abrahamsson K, Xie TM. 1983. Direct determination of trace amounts of chlorophenols in fresh-water, wastewater and sea-water. J Chromat 279:199–208.
Adibi JJ, Whyatt RM, Williams PL, Calafat AM, Camann D, Herrick R, et al. 2008. Characterization of phthalate expo-sure among pregnant women assessed by repeat air and urine samples. Environ Health Perspect 116:467–473. Agency for Toxic Substances and Disease Registry. 2006.
Toxicological Profile for Dichlorobenzenes. Available: www. atsdr.cdc.gov/toxprofiles/tp10.pdf [accessed 29 January 2011].
Balakrishnan B, Henare K, Thorstensen EB, Ponnampalam AP, Mitchell MD. 2010. Transfer of bisphenol A across the human placenta. Am J Obstet Gynecol 202(4):393.e1–393.e7. Braun JM, Kalkbrenner AE, Calafat AM, Bernert JT, Ye X,
Silva MJ, et al. 2011. Variability and predictors of urinary bisphenol A concentrations during pregnancy. Environ Health Perspect 119:131–137.
Calafat AM, Silva MJ, Reidy JA, Gray LE, Samandar E, Preau JL, et al. 2006. Mono-(3-carboxypropyl) phthalate, a metabolite of di-n-octyl phthalate. J Toxicol Environ Health A 69(3):215–227.
Calafat AM, Wong LY, Ye XY, Reidy JA, Needham LL. 2008. Concentrations of the sunscreen agent benzophenone-3 in residents of the United States: National Health and Nutrition Examination Survey 2003–2004. Environ Health Perspect 116:893–897.
Cantonwine D, Meeker JD, Hu H, Sanchez BN, Lamadrid-Figueroa H, Mercado-Garcia A, et al. 2010. Bisphenol A exposure in Mexico City and risk of prematurity: a pilot nested case control study. Environ Health 9:62; doi:10.1186/1476-069X-9-62 [Online 18 October 2010]. Drouillet P, Forhan A, De Lauzon-Guillain B, Thiebaugeorges O,
Goua V, Magnin G, et al. 2009. Maternal fatty acid intake and fetal growth: evidence for an association in over-weight women. The ‘EDEN mother-child’ cohort (study of pre- and early postnatal determinants of the child’s devel-opment and health). Br J Nutr 101(4):583–591.
Garlantezec R, Monfort C, Rouget F, Cordier S. 2009. Maternal occupational exposure to solvents and congenital mal-formations: a prospective study in the general population. Occup Environ Med 66(7):456–463.
Harrell FE. 2001. Regression Modeling Strategies: With Applications to Linear Models, Logistic Regression, and Survival Analysis. New York:Springer.
Hauser R, Calafat AM. 2005. Phthalates and human health. Occup Environ Med 62(11):806–818.
Huang PC, Kuo PL, Chou YY, Lin SJ, Lee CC. 2009. Association between prenatal exposure to phthalates and the health of newborns. Environ Int 35(1):14–20.
Latini G, De Felice C, Presta G, Del Vecchio A, Paris I, Ruggieri F, et al. 2003. In utero exposure to di-(2-ethyl-hexyl)phthalate and duration of human pregnancy. Environ Health Perspect 111:1783–1785.
Mahalingaiah S, Meeker JD, Pearson KR, Calafat AM, Ye X, Petrozza J, et al. 2008. Temporal variability and predictors of urinary bisphenol A concentrations in men and women. Environ Health Perspect 116:173–178.
Mose T, Mortensen GK, Hedegaard M, Knudsen LE. 2007. Phthalate monoesters in perfusate from a dual placenta perfusion system, the placenta tissue and umbilical cord blood. Reprod Toxicol 23(1):83–91.
Richardson DB, Rzehak P, Klenk J, Weiland SK. 2007. Analyses of case-control data for additional outcomes. Epidemiology 18(4):441–445.
Rothman KJ, Greenland S, Lash TL. 2008. Modern Epidemiology. 3rd ed. Philadelphia, PA:Lippincott.
Rubin BS, Murray MK, Damassa DA, King JC, Soto AM. 2001.
Perinatal exposure to low doses of bisphenol A affects body weight, patterns of estrous cyclicity, and plasma LH levels. Environ Health Perspect 109:675–680.
Rubin BS, Soto AM. 2009. Bisphenol A: perinatal exposure and body weight. Mol Cell Endocrinol 304(1–2):55–62. Samandar E, Silva MJ, Reidy JA, Needham LL, Calafat AM.
2009. Temporal stability of eight phthalate metabolites and their glucuronide conjugates in human urine. Environ Res 109(5):641–646.
Silva M, Reidy J, Herbert A, Preau J, Needham L, Calafat A. 2004. Detection of phthalates metabolites in human amni-otic fluid. Bull Environ Contam Toxicol 72:1226–1231. Silva MJ, Samandar E, Preau JL, Reidy JA, Needham LL,
Calafat AM. 2007. Quantification of 22 phthalate metabo-lites in human urine. J Chromat B-Analyt Technol Biomed Life Sci 860(1):106–112.
Slama R, Khoshnood B, Kaminski M. 2008. How to control for gestational age in studies involving environmental effects on fetal growth [Letter]. Environ Health Perspect 116:A284. Slama R, Werwatz A. 2005. Controlling for continuous con-founding factors: non- and semiparametric approaches. Rev Epidemiol Sante Publique 53:2S65–2S80.
Wolff MS, Engel SM, Berkowitz GS, Ye X, Silva MJ, Zhu C, et al. 2008. Prenatal phenol and phthalate exposures and birth outcomes. Environ Health Perspect 116:1092–1097. Yang J, Cao LM, Guo R, Jia JP. 2010. Permeable reactive
bar-rier of surface hydrophobic granular activated carbon coupled with elemental iron for the removal of 2,4-dichlo-rophenol in water. J Hazard Mater 184(1–3):782–787. Ye XB, Pierik FH, Angerer J, Meltzer HM, Jaddoe VW,
Tiemeier H, et al. 2009. Levels of metabolites of organo-phosphate pesticides, phthalates, and bisphenol A in pooled urine specimens from pregnant women partici-pating in the Norwegian Mother and Child Cohort Study (MoBa). Int J Hyg Environ Health 212(5):481–491. Ye XB, Pierik FH, Hauser R, Duty S, Angerer J, Park MM, et al.
2008. Urinary metabolite concentrations of organophos-phorous pesticides, bisphenol A, and phthalates among pregnant women in Rotterdam, the Netherlands: The Generation R study. Environ Res 108(2):260–267. Ye XY, Zsuzsanna K, Needham LL, Calafat AM. 2005.
Quantification of urinary conjugates of bisphenol A, 2,5-di-chlorophenol, and 2-hydroxy-4-methoxybenzophenone in humans by online solid phase extraction-high perfor-mance liquid chromatography-tandem mass spectrometry. Anal Bioanal Chem 383(4):638–644.
Yoshida T, Andoh K, Fukuhara M. 2002. Urinary 2,5-dichloro-phenol as biological index for p-dichlorobenzene exposure in the general population. Arch Environ Contam Toxicol 43(4):481–485.
Zhang YH, Lin L, Cao Y, Chen BH, Zheng LX, Ge RS. 2009. Phthalate levels and low birth weight: a nested case-con-trol study of Chinese newborns. J Pediatr 155(4):500–504. Zona R, Solar S, Gehringer P. 2002. Degradation of
2,4-dichlo-rophenoxyacetic acid by ionizing radiation: influence of oxygen concentration. Water Res 36(5):1369–1374.