HAL Id: inserm-00299175
https://www.hal.inserm.fr/inserm-00299175
Submitted on 15 Oct 2008HAL is a multi-disciplinary open access archive for the deposit and dissemination of sci-entific research documents, whether they are pub-lished or not. The documents may come from teaching and research institutions in France or abroad, or from public or private research centers.
L’archive ouverte pluridisciplinaire HAL, est destinée au dépôt et à la diffusion de documents scientifiques de niveau recherche, publiés ou non, émanant des établissements d’enseignement et de recherche français ou étrangers, des laboratoires publics ou privés.
France: policies and risk factors.
Isabelle Bourdel-Marchasson, Charlotte Rolland, Marthe-Aline Jutand,
Christian Egea, Béatrice Baratchart, Pascale Barberger-Gateau
To cite this version:
Isabelle Bourdel-Marchasson, Charlotte Rolland, Marthe-Aline Jutand, Christian Egea, Béatrice Baratchart, et al.. Undernutrition in geriatric institutions in South-West France: policies and risk factors.. Nutrition, Elsevier, 2009, 25 (2), pp.155-64. �10.1016/j.nut.2008.07.016�. �inserm-00299175�
1
Undernutrition in geriatric institutions in South-West
France: policies and risk factors.
Isabelle Bourdel-Marchasson, MD, PhD1, Charlotte Rolland2, Marthe-Aline Jutand3, Christian Egea2, Béatrice Baratchart, MD2, Pascale Barberger-Gateau, MD, PhD3
1CHU of Bordeaux, Department of Gerontology; UMR 5536 CNRS/University V Segalen
Bordeaux 2, Bordeaux, France
2 Direction Régionale des Affaires Sanitaire et Sociales (DRASS), 103 B r Belleville 33000
Bordeaux, France
3ISPED, Bordeaux School of Public Health, Department of Epidemiology, University V
Segalen Bordeaux 2
Running head: Undernutrition risk in geriatric institutions
Abstract
Objective: This study aimed to describe the nutritional status of geriatric home residents
according to their place of dwelling and to identify institutional factors associated with higher rates of undernutrition.
Method: All institutions (514) in the Aquitaine region were interviewed for staff ratio,
nutrition procedures, staff training and other procedures in the area of nutrition. A stratified random sample of 601 residents in a sub-sample of 42 institutions underwent Mini Nutritional Assessment (MNA).
Results: The estimated prevalence of undernutrition was 19.1 (95% CI: 14.0-24.2) with a higher rate in long-term care (48.0 % (95% CI: 15.9-80.2) than in nursing homes (14.5 % (95% CI: 10.6-18.4), p< .0001). In univariate analyses the risk of undernutrition was higher in long-term care (P < .0001), in settings with better weighing equipment (P < .0001), higher
staff ratio (P = .0001), higher rate of subjects needing help for eating (P < .0001) and was lower in settings with a higher rate of training in nutrition screening (P = .0001) and management (P < .0001). In nursing homes, each item of the MNA-Short Form was independently predictive of undernutrition. In multivariate analyses in nursing homes only, better weighing equipment (ORadj 2.34, 95% CI 1.39-4.12, P = .0017) and higher staff ratio
(ORadj 1.03, 95% CI 1.00-1.05, P = .0230) were associated with higher rates of undernutrition. Conclusions: Undernutrition in institutions was linked to the resident health problems with little evidence in favor of the influence of institutional policies
Key Words: MNA; staff training; functional dependency; nutritional supplementation
Introduction
Undernutrition is a major concern in geriatric institutions. Outcomes of undernutrition are reported to be severe, including poor quality of life, functional decline, pressure ulcers, higher risk of hospitalization and higher mortality (1-3). Thus, it is of great interest to promote any means likely to lower the rate of undernutrition in geriatric institutions. Indeed, studies using either anthropometric criteria or the Mini Nutritional Assessment (MNA) (4) have estimated prevalence of undernutrition at 20-40% (4-12). This prevalence varies according to the kind of institutions and could be as high as 70% in long-term care according to MNA assessments (4) but as low as 2% or 6% in some settings (13, 14). Some of these studies, however, did not claim to be representative of the institutionalized population. In fact, one of them included all the geriatric institutions around Helsinki and reported that according to the MNA score, 29% of residents were undernourished and 60 % were at risk for
malnutrition (12).
Nevertheless, undernourished patients could be at higher risk of institutionalization than those with adequate nutritional status, mainly due to comorbidity, cognitive and
functional impairment and, in some cases, social isolation. We have shown that low oral intake is an independent risk factor for institutionalization in hospitalized elderly people (15). An epidemiological study in an adult community population also showed that 10-year weight loss or weight gain were both associated with an increased rate of institutionalization (16). Thus, rates of undernutrition are expected to be higher in geriatric institutions than in the community and this further emphasizes the need for investigations in this area.
Indeed, it has been shown that within geriatric institutions, risk factors for low BMI or weight loss were age over 85y, low dietary intake, functional dependency and bed-ridden state, depression and chewing problems (7). In Finnish institutions, dementia, low dietary intake, functional dependency and swallowing disorders were also associated with
undernutrition (12). Within nursing homes, low BMI was associated with poorer quality of life (9) and thus should be considered a target for quality improvement.
Progress in this area can come either from better prevention, diagnosis or treatment of undernutrition and its causal factors. Nutrition policies in these establishments have to address the needs of these residents. Among them, staff recognition of nutritional problems (17-19), meal delivery organization (19-23) and access to dental care (13, 14, 24) have been identified as main targets for improvement.
We aimed to estimate the rate of undernutrition in a representative sample of elderly residents in institutions in Aquitaine (South-West France) and to identify the institutional factors associated with undernutrition in these institutions.
Methods
Geriatric institutions
In 2005, the DRASS Aquitaine (Direction Régionale des Affaires Sanitaires et Sociales i.e. Regional Direction of Health and Social Services of Aquitaine) sent a postal questionnaire to
the 514 nursing homes or long-term care homes in the administrative region of Aquitaine. In France, long-term care homes receive elderly people with functional impairment and severe disease requiring continuous medical care, in contrast to nursing homes which do not provide continuous nurses’ presence. The number of available beds was 30,617 giving a rate of 42 beds for 1000 subjects older than 60 yr. Long-term care homes accommodated 2,845 residents and nursing homes 22,772.
The private or public status, the category (nursing home or long-term care home), the number of staff and the number of available beds in each institution were obtained by file matching with the FINESS (Fichier National des Etablissements Sanitaires et Sociaux, i.e. National File of Social and Health Care Settings). The questionnaire included items describing nutritional policies such as meal schedules, the involvement of a dietician for meal composition, and educational programs for nurses and their assistants concerning recognition and management of undernutrition, dietary recommendations, swallowing disorders and HACCP (Hazard Analysis Critical Control Points). Meal schedules were used to calculate the length of the night fasting period. The number of residents needing help for feeding was recorded. The ratio of staff to total residents was also calculated for each home and was termed the staff ratio. The questionnaire also investigated existing written procedures for undernutrition screening including screening at admission, regular weight measurement, dietary intake and hydration monitoring. The question concerning available weighing-scales proposed 3 levels of weighing equipment: no equipment or only bathroom scales, chair-scales or medical quality scale, and equipment able to weigh everybody including bed-ridden people. Capacity to offer dental examinations and physical activity was also assessed.
Residents
A stratified random sample of 42 institutions was drawn out of the 514 institutions taking into account their public or private status, the administrative and geographic area, the
category (nursing-home or long-term care) and the number of available beds. In each stratum one institution was randomly selected whenever several were present.
These institutions were visited by a dietician who recorded more in depth the procedures used in the area of nutrition. These included undernutrition screening procedures at admission and follow-up and catering procedures: type (freeze-dried, canned, home-made) of mixed meal preparation and adaptation of meal schedules to residents’ requests. The proportion of residents needing assistance during meals, those fed with mixed meals or with tube-feeding were also recorded. Capacity to adapt to particular problems was also
investigated, such as swallowing rehabilitation and type of adapted hydration in case of swallowing disorders and new nutritional assessment in case of incident illness.
A random sample of 15 residents present in the institution at the time of the interview was selected in these 42 institutions. If fewer than 15 residents were present, they were all included, leading to a sample of 601 residents. An MNA form was filled in for each of these residents. Subjects were all weighed with the same platform scale. The MNA is an 18-item questionnaire including anthropometric, general, dietary and subjective assessments; the maximum score is 30 indicating the best nutritional status (4). A screening sub-scale of the MNA (MNA-Short Form, MNA-SF) includes 6 items (appetite, recent weight loss, mobility, recent disease or psychological stress, dementia or depression, BMI) with the maximum score of 14. The threshold for malnutrition screening with the MNA-SF is set at 11 or below (4). Only subjects with this score went on to assessment with the full MNA questionnaire, on which a score below 17 indicates undernutrition. The threshold value of BMI for
undernutrition definition varies currently from 20 to 22 kg/m2(11, 19, 25-28). In accordance with BMI categories used in the MNA (4), we used the BMI threshold of 21 to define undernutrition (19).
Analysis
Statistical analysis was performed using the SAS system (8.2, SAS institute Inc., Cary NC, USA). Values are expressed as means with standard deviations (SD) or as percentages. Chi-square tests and t-tests were used to compare qualitative or quantitative variables with a threshold p < 0.05. We compared the characteristics of the 42 institutions in the random sample to those of the 514 institutions in the area in order to ensure their representativeness. The proportion of residents screened as at risk of malnutrition according to the MNA-SF and the proportion of subjects undernourished using the MNA were weighted according to Horvitz-Thompson equations to provide estimations of the prevalence in the whole
population, taking into account the sampling frame with a 95% confidence interval (CI) (29). Estimations of these proportions according to category (nursing home or long-term care home, private or public, rural or urban) were also calculated. The association between resident characteristics based on the MNA-SF and risk of undernutrition (MNA<17) was estimated by univariate and then multivariate stepwise backward logistic regression (MNA < 17) in nursing homes only, given the higher number of residents in them. Several logistic regression models were performed to investigate the association between nursing home characteristics including nutrition procedures and the risk of having a proportion of undernourished (MNA < 17) residents above the median of the group. Random effects were used in these models to correct the cluster selection from the randomization method.
Results
Characteristics and nutritional procedures in the whole sample
There were 514 geriatric institutions including 469 nursing homes and 45 long-term care homes with a mean staff ratio (staff number / number of beds) of 0.3 (SD 0.4) in nursing homes and 0.6 (SD 0.8) in long-term care homes. Among these institutions, 461 completed
the questionnaire giving a non-response rate of 10.3 %. The non-respondents were more likely to be long-term care homes than nursing homes (24% versus 9%, p= .001), to have no official approval to receive social funds (19.9% versus 6.5%, p= .006) and to have a smaller mean size than the respondents (p= .04). There were 288 (62.5%) private and 173 (37.5%) public settings.
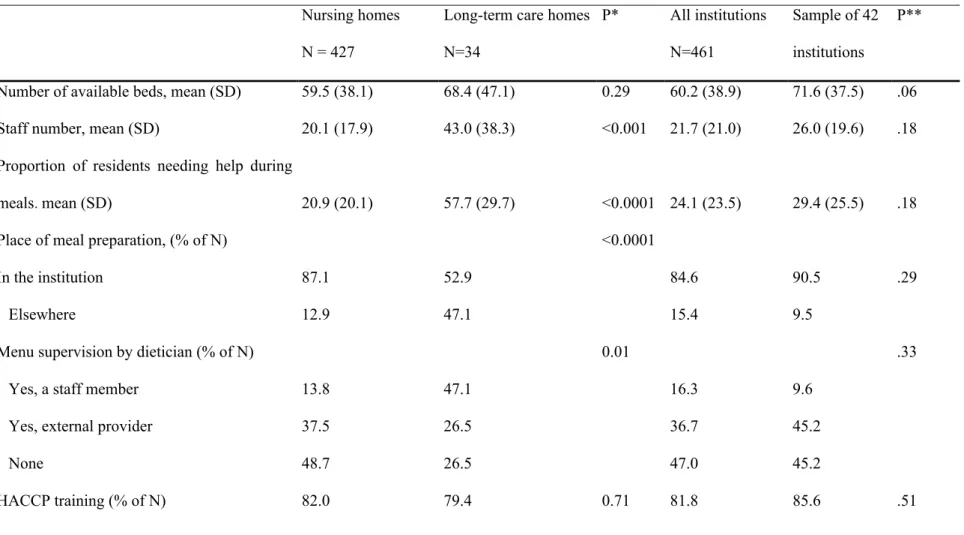
In the 461 respondents, the mean proportion of residents needing help for eating was higher in long-term care homes than in nursing homes (P< .0001) (Table 1). A dietician was involved in menu composition in 244 settings (52.9 %), with a greater proportion in public institutions (64.0 %) than in private institutions (46.2%, P= .002). However, training for dietary issues, malnutrition screening and management, and for swallowing disorders was performed in only one third to half of the settings, with higher rates in long-term care homes. There was also a higher proportion of nursing homes than long-term care homes with no training at all (Table 1). Weighing equipment was poor in 44.3 % of nursing homes and in 5.9 % of long-term care homes (Table 1).
Only 11.5% of the institutions declared they had no nutrition procedure. The screening of nutrition problems was planned in 38.8% of the 461 institutions at admission and in 49.9% during the stay. Nutrition procedures included weight monitoring in up to 78.1 % of settings despite the inadequate weighing equipment. There was no significant difference between nursing homes and long-term care institutions except for training in swallowing disorders, which was twice as frequent in long-term care homes.
The mean night fasting period was 11.77 hours and could be as high as 13.75 hours in some nursing homes. Access to dental care was available in 60.5% of institutions with a higher rate in long-term care homes (P= .007). Physical activity was offered in 75.3 % of institutions. The mean proportion of residents eating regular-texture food was 0.32 (SD 0.20) and the mean rate of tube-feeding was 0.05 (SD 0.01).
Characteristics of the sample of 42 institutions
The sample consisted in 36 nursing homes and 6 long-term care homes. There were no significant differences between the random sample of 42 and the whole pool of institutions of this region, except for the proportion of institutions declaring they had no procedure, which was lower in the sample of 42 institutions (Table 1). In this sample, details of procedures were reported: nutrition screening at admission was planned in 23.1 % and consisted in seeking weight loss in 57.1 % of them, BMI determination in 11.9 % and MNA assessment in 14.3 %. These screening procedures also included screening for swallowing disorders in 52.4 %, the need for help during meals in 53.4 %, diagnosis of dementia in 52.4 %, and depression in 54.8 %. Procedures included an oral examination in 35.7 % of settings and a dental check-up in 26.2 %. To the question “If a resident suffers from swallowing disorders, do you propose specific rehabilitation?”, 21.4 % said “yes” and 23.8 % said that the event never arose. However, 97.3 % of 42 institutions said that they adapted hydration techniques in case of swallowing disorders, 73.8 % using only the highest level of liquid thickening.
Hypodermoclysis hydration was also proposed in 97.3 % of settings. In 88.3% of them, re-assessment of nutritional status was planned in case of incident illness.
Use of oral nutritional supplements was declared in 41 settings; the proportion of residents taking them every day was 0.14 (SD 0.14) and the proportion of those with occasional intake was 0.08 (SD 0.16). The proportion of settings reporting the use of high-protein supplements with lactose, lactose-free high-high-protein supplements, regular supplements with lactose and lactose-free high-calorie supplements were respectively 59.5%, 54.8 %, 42.9 % and 31.0 %. The rate of non-response varied from 7.1 to 14.3%. The use of pharmaco-nutriments was declared in 26.2 % of settings.
Residents’ characteristics and risk of undernutrition in the 42 institutions
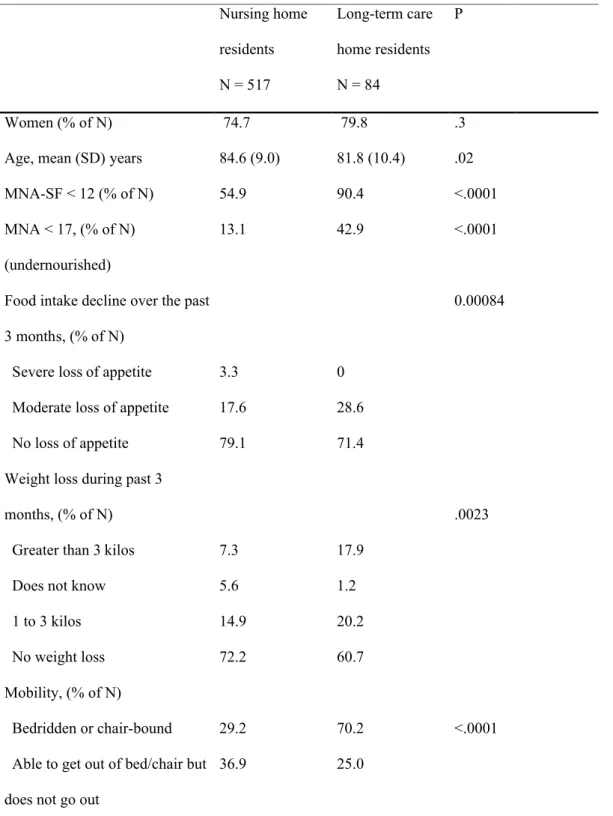
The sample included 601 subjects, 148 men and 453 women with a mean age of 84.2 years (SD 9.3) (Table 2). Subjects 80 years and older accounted for 75.4 % of the population. The oldest subjects were mainly in nursing homes (Table 2).
The number of subjects at risk for malnutrition according to the MNA-SF was 360 (59.9%). Using the full-length MNA in these 360 subjects, 104 residents were undernourished (MNA < 17), giving a rate of 17.3 % of undernutrition among the 601 residents. Taking the sampling frame into account, the resulting estimated prevalence of undernutrition in the geriatric institutions in Aquitaine was 19.1 % (95% CI: 14.0-24.2). The estimated prevalence of undernutrition in Aquitaine was higher in long-term care homes than in nursing homes (respectively 48.0 % versus 14.5 %, p< .0001).
Comparison of the distribution of responses to the 6 items of the MNA-SF between nursing homes and long-term care showed that subjects in the former were less often restricted for mobility, had less often lost weight during the previous three months, had had acute stress or disease less frequently, and fewer of them had severe depression or dementia (Table 2). However, there was no overall significant difference in BMI distribution according to type of setting. When using a BMI threshold of less than 21 for defining undernutrition status, the proportion of undernourished subjects was 23.8 % in nursing homes and 31.0 % in long-term care. Taking the sampling frame into account, the estimated prevalence of
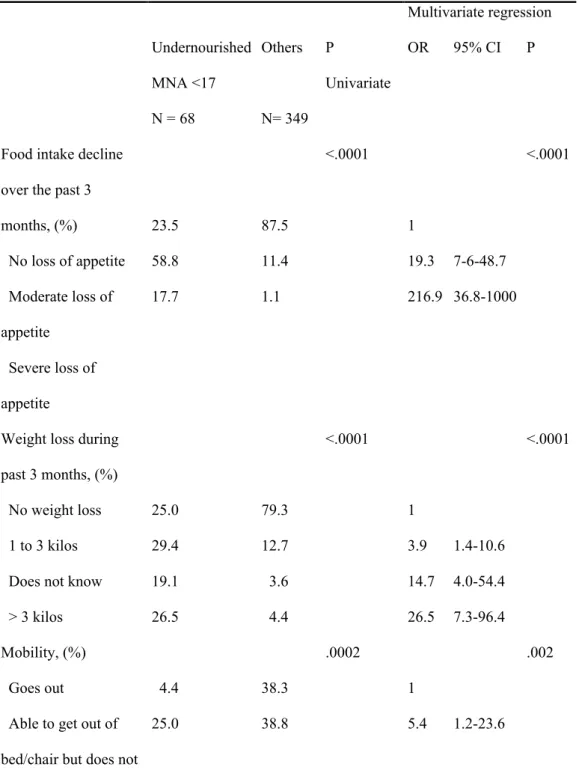
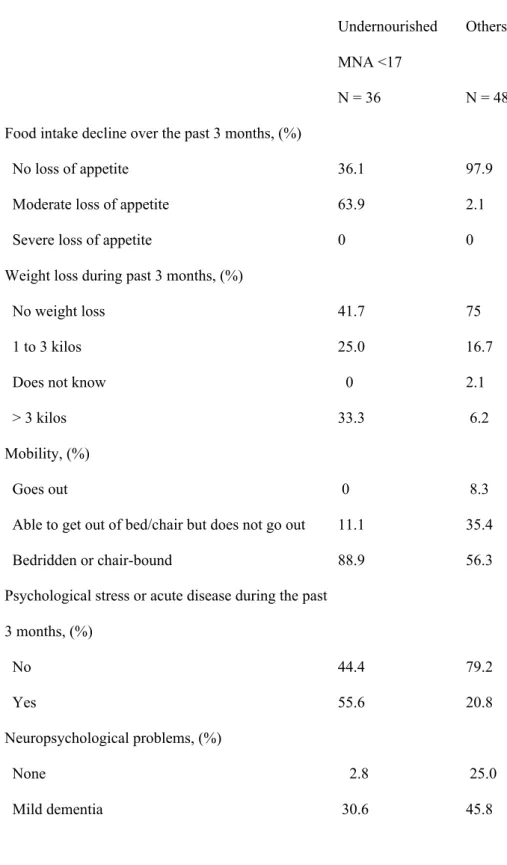
malnutrition in Aquitaine using the criterion BMI < 21 was 24.7 % (95 % CI 20.9-28.4). The association between residents’ characteristics and risk of undernutrition is presented in table 3 and Table 4. In nursing homes (Table 3), each item of the MNA-SF was strongly predictive of undernutrition both in univariate and multivariate analyses. In the long-term care homes (Table 4, among MNA-SF items only recent food intake decline, recent disease or psychological stress and lower BMI were risk factors for undernutrition but the
limited number of subjects in this setting did not allow valid multivariate analysis to be performed.
Institutional characteristics, procedures and risk of undernutrition
In univariate analyses conducted in the whole sample of 42 institutions, the risk of undernutrition (MNA < 17) was higher in subjects living in long-term care (OR 4.95, 95% CI 3.00-8.18, P < .0001), in settings with better weighing equipment (OR 2.70, 95% CI 1.70-4.30, P < .0001), with a higher staff ratio (OR 1.02, 95% CI 1.01-1.03, P = .0001), with a higher rate of subjects needing help for eating (OR 1.02, 95% CI 1.01-1.03, P < .0001), and was lower in settings with higher percentages of training in nutrition screening (OR 0.43, 95% CI 0.28-0.07, P = .0001) and management (OR 0.40, 95% CI 0.26-0.61, P < .0001).
In univariate analyses in nursing homes, the risk of undernutrition was higher in subjects living in settings with better weighing equipment (OR 2.53, 95% CI 1.47-4.35, P = .0008), with a higher staff ratio (OR 1.03, 95% CI 1.00-1.05, P = .0102), with a higher rate of subjects needing help for eating (OR 18.27, 95% CI 7.9-42.2, P<.001). This risk was lower in settings with a higher rate of training for undernutrition screening (OR 0.54, 95% CI 0.32-0.91, P = .020), for malnutrition management (OR 0.53, 95% CI 0.31-0.92, P = .0247), and for management of swallowing disorders (OR 0.33, 95% CI 0.34-0.95, P = .0325). In multivariate analyses, we found an association only between a higher risk of undernutrition and better weighing equipment (OR 2.34, 95% CI 1.39-4.12, P = .0017) and a higher staff ratio (OR 1.03, 95% CI 1.00-1.05, P = .0230).
In long-term care homes, the risk of undernutrition in univariate analysis increased in settings with a higher staff ratio (OR 1.01, 95% CI 1.00-1.05, P = .0136), and with longer fasting at night (OR 1.00, 95% CI 1.00-1.00, P = .0125).
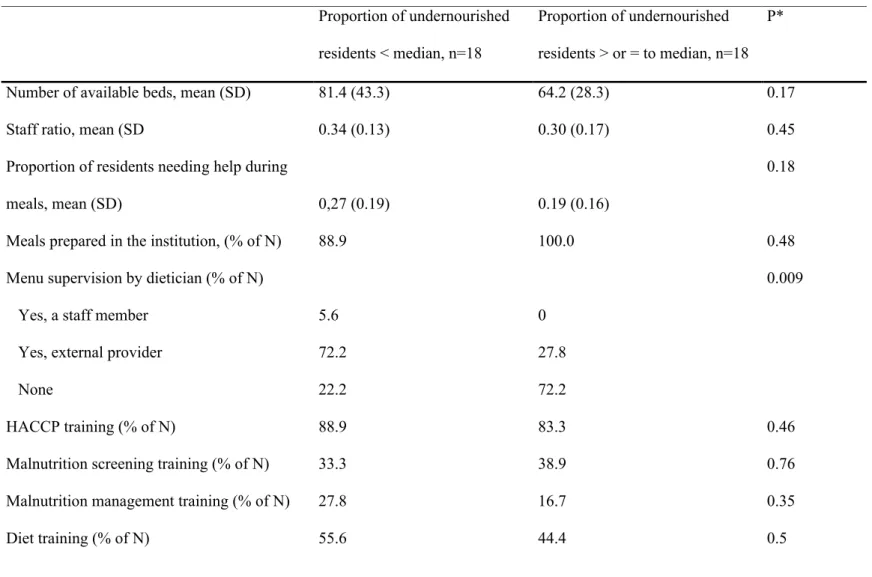
In nursing homes we compared the characteristics of the 18 institutions in which the proportion of undernourished residents was less than the median (22.25 %) with those of the
18 others (Table 5). Recourse to a dietician for menu supervision was less frequent in settings with a higher proportion of undernourished subjects (P = .009). All other characteristics were similar in both categories.
Discussion
This study demonstrates large differences in prevalence of undernutrition according to types of institution. The prevalence was 3 times higher in long-term care homes compared to nursing homes. In both kinds of settings the main risk factors for undernutrition were linked to subjects themselves. However, in nursing homes, univariate analysis has shown that lower rates of undernutrition were associated with higher rates of nutritional care and prevention.
The results of the MNA-SF showed very large differences in distribution of mobility dependency, mental problems and acute morbidity according to facilities. In the area of nutrition, the proportion of residents needing help for eating was also very different between the types of settings. Dependency for eating puts the resident in the category of severe dependency (30). These differences in functional dependency were expected due to the different assignments given to these settings and to the recruitment choice for residents. The estimated prevalence of malnutrition in Aquitaine using the MNA (19.1%) is in the lowest part of the prevalence range found in other studies (4-12). Using the BMI threshold of 21 (19), the estimated prevalence was slightly higher but remained in the lowest values. In Danish nursing homes (5), prevalence of BMI lower than 20 was as high as 33% compared to 24.7 % in this study with a BMI lower than 21. In the long-term care homes, more subjects were undernourished, but the proportion of subjects with a BMI < 21 was still lower (31%) than in the Danish study (5).
In a large sample of nursing home residents in the USA (6832 subjects), weight loss occurred in 9.9% of subjects and 25% of residents had a BMI < 19.4 (7). With the MNA-SF,
we found that weight loss occurred in almost 30 % of the residents and that the proportion of them with a BMI < 21 was 23.8%. Furthermore, the proportion of weight losers was very different according to the type of settings, in contrast to BMI distribution which was similar with only a trend for a higher proportion of very low BMI (< 19) in long-term care homes. On the other hand, in settings without adequate weighing equipment, the response to the question of weight loss was likely “do not know”, thus under- or over-estimating the score on this MNA-SF item to an unpredictable extent. If we had defined undernutrition on the basis of weight loss, the proportion would have been much higher; on the contrary, if we had used the BMI, it would have been lower, suggesting that a multidimensional measure of undernutrition is necessary. Low value responses to each item of the MNA-SF strongly predicted
undernutrition in our sample of residents. Indeed, in the large sample of Blaum et al. (7), items predicting weight loss or low BMI were those included in the MNA and most of them in the MNA-SF. Furthermore, it was previously shown that the energy intake of
malnourished subjects according to the MNA was below their needs, in contrast to subjects with MNA over 24 (31). This was confirmed elsewhere using other undernutrition criteria (12, 32).
Associations between undernutrition and impaired function or high need of care, dementia, swallowing difficulties, constipation and agitation were also evidenced (12, 31). Demented patients seem to shift their best energy intake to breakfast, particularly if they have behavioral disturbances (33), thereby confirming the impact of agitation on malnutrition risk (12).
Admission to French long-term care homes is primarily granted to the most
functionally dependent patients and those who need more medical care due to severe chronic disease apart from dementia, such as heart failure, cancer, and chronic obstructive respiratory disease. These conditions seem to increase particularly the risk of undernutrition in these
settings as shown here. In the nursing homes, the rates of dependency, recent acute diseases or psychological stress were much lower, and all items of the MNA-SF remained independently associated with the risk of undernutrition. It seems at the first glance that a higher rate of procedures, organization and equipment was associated with a higher rate of undernutrition. This could simply reflect the particular selection of the patients with higher level of health problems in the best qualified settings. Only in nursing homes would it seem that inadequate recourse to the services of a dietician and lower rate of procedures were linked to a higher rate of undernutrition.
Despite the fact that nutritional procedures existed, the rate of malnutrition was still high. Organizational factors causing malnutrition were described in the review by Cowan et al. (20). Here we explored only procedures concerning screening, prevention or treatment of malnutrition, and means in terms of staff ratio and recourse to a dietician. There was no precise information about the content and quality of the procedures and our data were only declarative. Nor did we investigate performances and rates of use of these procedures. Here, declared procedure of weight monitoring was certainly not correctly applied when
considering the poor quality of weighing equipment. It has also been shown that in the case of dependency for eating, the main consequence of a lack of time was reduced food intake by residents (17). Another point to comment was the fact that weighing equipment was of better quality when the prevalence of undernutrition was higher. This could reflect the better awareness of the problem in these settings as discussed upper in the text, however with no apparent effect on undernutrition rate. It is noticeable that weight monitoring like food intake assessment are efficient tools for undernutrition prevention and thus should be performed even in homes with lower rate of undernutrition and included as a basic standard of care.
On the other hand, lack of procedures was likely associated with poor nutrition management. Hydration procedures were present in a large majority of institutions, probably
owing to government requirements after the 2003 heatwave which led to high mortality rate in French nursing homes. The reported large use of hypodermoclysis was clearly resulting from recommended preventive procedures against dehydration in functionally dependent patients. Thus, strong collective will seems able to lead to a high rate of procedure implementation. Staff knowledge about undernutrition in elderly was also identified as important for the prevention of undernutrition and the care of undernourished subjects. Years as a nurse or as a nurse’s assistant did not seem to positively influence knowledge about nutrition, which was best improved by specific training (18). Training and procedures in nutrition area were associated with an increased rate of undernutrition suggesting that most of the institutions were aware of the problem. However, there is much scope for improvement since only 56% of long-term care homes were conducting training in of nutrition (HACCP excluded).
Among organizational factors described by Cowan et al (20), staff communication and enforcement of regulations are both necessary to enforce these procedures. In nursing homes it has been clearly shown that weight loss and the observation of large amounts of food remaining on plates were related to decreased energy and protein intake (25, 34). Informal observation of residents during meals can help staff specifically to prevent malnutrition. For this purpose, it is possible to establish the typical profile of would-be undernourished residents by noting degree of assistance in feeding, swallowing disorders, inappropriate food texture, and subjects’ agitation (35).
Finally, our indicators on diet quality were insufficient, in particular those concerning taste of food and adaptation to chewing or swallowing problems, which would have
necessitated face-to-face interviews. Evans et al. have developed a food questionnaire (36, 37) which could be used in this institutionalized population. To what extent institutional
adaptation to the expectations of residents can be implemented and what the resulting efficiency could be on residents’ nutritional status deserves further investigation. An
anthropological study has shown that providing home-like meals in nursing homes could enhance residents’ and staff satisfaction (38). One randomized study has shown a positive effect of these family-style meals on energy intake and MNA scores in nursing homes (38).
Treatment of undernutrition and its efficiency have been less documented. It seems possible to improve the energy intake of undernourished nursing home residents by using enriched food (6). However, one audit of oral liquid supplements in nursing homes showed that they could be frequently used without prior investigation of the causal factors of subjects’ undernutrition (39). In our study we also found discrepancies between the declared
procedures for the screening of swallowing disorders and what was proposed when the problem actually occurred. While 50% of the institutions used screening, only half of that percentage claimed that rehabilitation was required, the others considering that there was no problem. On the other hand, almost all the institutions had suitable hydration procedures.
Clinical guidelines for nutritional management are of great help in implementing the training and organization of communication of staff members and physicians in order to improve undernutrition screening, and for undertaking suitable measures for particular intake problems, such as dependency, chewing and swallowing problems, and behavioral
disturbances (19).
In conclusion, the main factors of undernutrition in the institutions surveyed were linked to the residents’ health problems, with little evidence suggesting the detrimental influence of institutional policies. No studies to date have shown that better management of nutritional problems can decrease the rate of undernutrition in residents. However a large scope for improvement in nutritional care was evidenced. Other endpoints such as quality of life associated with better nutritional care need therefore to be explored.
Formatted: Heading 2, Line spacing: Double
References
1. Chin APMJ, Dekker JM, Feskens EJ, Schouten EG, Kromhout D. How to select a frail elderly population? A comparison of three working definitions. J Clin Epidemiol 1999;52:1015-21.
2. Morley JE, Silver AJ. Nutritional issues in nursing home care. Ann Intern Med 1995;123:850-9.
3. Potter J, Klipstein K, Reilly JJ, Roberts M. The nutritional status and clinical course of acute admissions to a geriatric unit. Age Ageing 1995;24:131-6.
4. Guigoz Y, Lauque S, Vellas BJ. Identifying the elderly at risk for malnutrition. The Mini Nutritional Assessment. Clin Geriatr Med 2002;18:737-57.
5. Beck AM, Ovesen L. Body mass index, weight loss and energy intake of old Danish nursing home residents and home-care clients. Scand J Caring Sci 2002;16:86-90. 6. Beck AM, Ovesen L, Schroll M. Home-made oral supplement as nutritional support of
old nursing home residents, who are undernourished or at risk of undernutrition based on the MNA. A pilot trial. Mini Nutritional Assessment. Aging Clin Exp Res
2002;14:212-5.
7. Blaum CS, Fries BE, Fiatarone MA. Factors associated with low body mass index and weight loss in nursing home residents. J Gerontol A Biol Sci Med Sci 1995;50:M162-8.
8. Compan B, di Castri A, Plaze JM, Arnaud-Battandier F. Epidemiological study of malnutrition in elderly patients in acute, sub-acute and long-term care using the MNA. J Nutr Health Aging 1999;3:146-51.
9. Crogan NL, Pasvogel A. The influence of protein-calorie malnutrition on quality of life in nursing homes. J Gerontol A Biol Sci Med Sci 2003;58:159-64.
10. Margetts BM, Thompson RL, Elia M, Jackson AA. Prevalence of risk of
undernutrition is associated with poor health status in older people in the UK. Eur J Clin Nutr 2003;57:69-74.
11. Ruiz-Lopez MD, Artacho R, Oliva P, et al. Nutritional risk in institutionalized older women determined by the Mini Nutritional Assessment test: what are the main factors? Nutrition 2003;19:767-71.
12. Suominen M, Muurinen S, Routasalo P, et al. Malnutrition and associated factors among aged residents in all nursing homes in Helsinki. Eur J Clin Nutr 2005;59:578-83.
13. Griep MI, Mets TF, Collys K, Ponjaert-Kristoffersen I, Massart DL. Risk of malnutrition in retirement homes elderly persons measured by the "mini-nutritional assessment". J Gerontol A Biol Sci Med Sci 2000;55:M57-63.
14. Lamy M, Mojon P, Kalykakis G, Legrand R, Butz-Jorgensen E. Oral status and nutrition in the institutionalized elderly. J Dent 1999;27:443-8.
15. Bourdel-Marchasson I, Vincent S, Germain C, et al. Delirium symptoms and low dietary intake in older inpatients are independent predictors of institutionalization: a 1-year prospective population-based study. J Gerontol A Biol Sci Med Sci 2004;59:350-4.
16. Zizza C, Herring A, Domino M, Haines P, Stevens J, Popkin BM. The effect of weight change on nursing care facility admission in the NHANES I Epidemiologic Follow-up Survey. J Clin Epidemiol 2003;56:906-13.
17. Crogan NL, Shultz JA, Adams CE, Massey LK. Barriers to nutrition care for nursing home residents. J Gerontol Nurs 2001;27:25-31.
18. Crogan NL, Shultz JA, Massey LK. Nutrition knowledge of nurses in long-term care facilities. J Contin Educ Nurs 2001;32:171-6.
19. Thomas DR, Ashmen W, Morley JE, Evans WJ. Nutritional management in long-term care: development of a clinical guideline. Council for Nutritional Strategies in Long-Term Care. J Gerontol A Biol Sci Med Sci 2000;55:M725-34.
20. Cowan DT, Roberts JD, Fitzpatrick JM, While AE, Baldwin J. Nutritional status of older people in long term care settings: current status and future directions. Int J Nurs Stud 2004;41:225-37.
21. Kayser-Jones J. Malnutrition, dehydration, and starvation in the midst of plenty: the political impact of qualitative inquiry. Qual Health Res 2002;12:1391-405.
22. Suominem M, Laine T, Routasalo P, Pitkala KH, Rasanen L. Nutrient content of served food, nutrient intake and nutritional status of residents with dementia in a Finnish nursing home. J Nutr Health Aging 2004;8:234-8.
23. Taylor KA, Barr SI. Provision of small, frequent meals does not improve energy intake of elderly residents with dysphagia who live in an extended-care facility. J Am Diet Assoc 2006;106:1115-8.
24. Poulsen I, Rahm Hallberg I, Schroll M. Nutritional status and associated factors on geriatric admission. J Nutr Health Aging 2006;10:84-90.
25. Beck AM, Ovesen L, Schroll M. Validation of the Resident Assessment Instrument triggers in the detection of under-nutrition. Age Ageing 2001;30:161-5.
26. Burden ST, Bodey S, Bradburn YJ, et al. Validation of a nutrition screening tool: testing the reliability and validity. J Hum Nutr Diet 2001;14:269-75.
27. Crogan NL, Corbett CF, Short RA. The minimum data set: predicting malnutrition in newly admitted nursing home residents. Clin Nurs Res 2002;11:341-53.
28. Gil Gregorio P, Ramirez Diaz SP, Ribera Casado JM. Dementia and Nutrition. Intervention study in institutionalized patients with Alzheimer disease. J Nutr Health Aging 2003;7:304-8.
29. Ardilly P. chapitre V. Plans de sondage complexes : éléments pour estimer les précisions. Les techniques de sondage. Paris: Editions TECHNIP, 1994:346.
30. Barberger-Gateau P, Rainville C, Letenneur L, Dartigues JF. A hierarchical model of domains of disablement in the elderly: a longitudinal approach. Disabil Rehabil 2000;22:308-17.
31. Odlund Olin A, Koochek A, Ljungqvist O, Cederholm T. Nutritional status, well-being and functional ability in frail elderly service flat residents. Eur J Clin Nutr 2005;59:263-70.
32. Young KW, Binns MA, Greenwood CE. Meal delivery practices do not meet needs of Alzheimer patients with increased cognitive and behavioral difficulties in a long-term care facility. J Gerontol A Biol Sci Med Sci 2001;56:M656-61.
33. Young KW, Greenwood CE. Shift in diurnal feeding patterns in nursing home residents with Alzheimer's disease. J Gerontol A Biol Sci Med Sci 2001;56:M700-6. 34. Beck AM, Ovesen L. Skipping of meals has a significant impact on dietary intake and
nutritional status of old (65+ y) nursing home residents. J Nutr Health Aging 2004;8:390-4.
35. Keller HH, Gibbs-Ward A, Randall-Simpson J, Bocock MA, Dimou E. Meal rounds: an essential aspect of quality nutrition services in long-term care. J Am Med Dir Assoc 2006;7:40-5.
36. Crogan NL, Evans BC. The shortened food expectations--Long-term care questionnaire: Assessing nursing home residents' satisfaction with food and food service. J Gerontol Nurs 2006;32:50-9.
37. Evans BC, Crogan NL. Using the FoodEx-LTC to assess institutional food service practices through nursing home residents' perspectives on nutrition care. J Gerontol A Biol Sci Med Sci 2005;60:125-8.
38. Kofod J, Birkemose A. Meals in nursing homes. Scand J Caring Sci 2004;18:128-34. 39. Kayser-Jones J, Schell ES, Porter C, et al. A prospective study of the use of liquid oral
Table 1: Characteristics of geriatric institutions in South-West France (N = 461) Nursing homes
N = 427
Long-term care homes N=34 P* All institutions N=461 Sample of 42 institutions P**
Number of available beds, mean (SD) 59.5 (38.1) 68.4 (47.1) 0.29 60.2 (38.9) 71.6 (37.5) .06
Staff number, mean (SD) 20.1 (17.9) 43.0 (38.3) <0.001 21.7 (21.0) 26.0 (19.6) .18
Proportion of residents needing help during
meals.mean (SD) 20.9 (20.1) 57.7 (29.7) <0.0001 24.1 (23.5) 29.4 (25.5) .18
Place of meal preparation, (% of N) In the institution Elsewhere 87.1 12.9 52.9 47.1 <0.0001 84.6 15.4 90.5 9.5 .29
Menu supervision by dietician (% of N) Yes, a staff member
Yes, external provider None 13.8 37.5 48.7 47.1 26.5 26.5 0.01 16.3 36.7 47.0 9.6 45.2 45.2 .33 HACCP training (% of N) 82.0 79.4 0.71 81.8 85.6 .51
Malnutrition screening training ( % of N) Malnutrition management training (% of N) Diet training (% of N)
Swallowing disorders training (% of N) No training (% of N) 29.7 21.8 35.1 26.2 12.9 50.0 44.1 47.1 55.9 5.9 0.01 0.003 0.20 0.02 0.23 31.2 23.4 36.0 27.5 12.4 42.9 28.6 50.0 33.3 7.1 .10 .43 .06 .40 <.0001 Weighing equipment (% of N)
None or bathroom scales Chair-scales or medical scales
Special equipment for bed-ridden subjects 44.3 28.3 27.4 5.9 29.4 64.7 <0.0001 41.4 28.4 30.2 28.6 33.3 38.1 .09 .48 .26 Malnutrition screening procedure
At admission (% of N) During the stay (% of N)
Hydration follow-up procedure (% of N) Weight follow-up procedure (% of N) Dietary intake follow-up procedure (% of N) No procedure (% of N) 38.2 49.4 81.3 77.8 77.8 11.2 47.1 55.9 79.4 82.4 85.3 14.7 0.31 0.47 0.79 0.53 0.30 0.53 38.8 49.9 81.1 78.1 78.3 11.5 38.1 47.6 78.6 80.9 80.9 11.9 .93 .77 .67 .65 .68 .93
Night fasting period Mean in hours (SD) Range in hours 11.78 (0.62) 10.25 – 13.75 11.42 (0.62) 10.25 – 13.00 0.002 11.77 (0.62) 10.25 – 13.75 11.58 (0.50) 10.30 – 13.65 .07 Availability of (% of N) Dental care Physical activities 58.8 75.9 82.3 67.7 0.007 0.28 60.5 75.3 66.6 88.1 .41 .89 P: *comparison nursing homes versus long-term care homes; ** comparison 461 institutions versus sample of 42 institutions
Table 2: Characteristics of the 601 residents of geriatric institutions in South-West France according to their place of dwelling.
Nursing home residents N = 517 Long-term care home residents N = 84 P Women (% of N) 74.7 79.8 .3 Age, mean (SD) years 84.6 (9.0) 81.8 (10.4) .02 MNA-SF < 12 (% of N) 54.9 90.4 <.0001 MNA < 17, (% of N)
(undernourished)
13.1 42.9 <.0001
Food intake decline over the past 3 months, (% of N)
Severe loss of appetite Moderate loss of appetite No loss of appetite 3.3 17.6 79.1 0 28.6 71.4 0.00084
Weight loss during past 3 months, (% of N)
Greater than 3 kilos Does not know 1 to 3 kilos No weight loss 7.3 5.6 14.9 72.2 17.9 1.2 20.2 60.7 .0023 Mobility, (% of N) Bedridden or chair-bound Able to get out of bed/chair but does not go out
29.2 36.9
70.2 25.0
Goes out 33.9 4.8 Psychological stress or acute
disease during the past 3 months, (% of N) Yes No 16.6 83.4 35.7 64.3 <.0001 Neuropsychological problems, (% of N)
Severe dementia or depression Mild dementia None 19.7 39.7 40.6 45.2 39.3 15.5 <.0001 BMI kg/m2(% of N) < 19 19 to < 21 21 to < 23 23 and > 9.9 13.9 11.6 64.6 17.9 13.1 11.9 57.1 .1810
Table 3: Responses to the MNA-SF questions associated with risk of undernutrition (MNA < 17).Multivariate analysis in Nursing Homes (number of residents: 517).
Multivariate regression Undernourished MNA <17 N = 68 Others N= 349 P Univariate OR 95% CI P
Food intake decline over the past 3 months, (%) No loss of appetite Moderate loss of appetite Severe loss of appetite 23.5 58.8 17.7 87.5 11.4 1.1 <.0001 1 19.3 216.9 7-6-48.7 36.8-1000 <.0001
Weight loss during past 3 months, (%)
No weight loss 1 to 3 kilos Does not know > 3 kilos 25.0 29.4 19.1 26.5 79.3 12.7 3.6 4.4 <.0001 1 3.9 14.7 26.5 1.4-10.6 4.0-54.4 7.3-96.4 <.0001 Mobility, (%) Goes out
Able to get out of bed/chair but does not go out 4.4 25.0 38.3 38.8 .0002 1 5.4 1.2-23.6 .002
Bedridden or chair-bound
70.6 22.9 32.2 7.5-138.0
Psychological stress or acute disease during the past 3 months, (%)
No Yes 50 50 88.4 11.6 <.0001 1 5.8 2.4-13.9 <.0001 Neuropsychological problems, (%) None Mild dementia Severe dementia or depression 4.4 35.3 60.3 46.1 40.3 13.6 .0004 1 4.5 50.1 0.6-32.5 6.1-413.3 .0195 BMI kg/m2 (%) 23 and > 21 to < 23 19 to < 21 < 19 20.6 11.8 32.3 35.3 71.3 11.6 11.1 6 .0072 1 4.4 14.0 45.9 0.8-23.9 3.3-59.0 8.8-238.4 .0005
Table 4: Responses to the MNA-SF questions associated with risk of undernutrition in long term care home (Number of residents: 84).
Undernourished MNA <17 N = 36
Others
N = 48 Food intake decline over the past 3 months, (%)
No loss of appetite Moderate loss of appetite
Severe loss of appetite
36.1 63.9 0 97.9 2.1 0 Weight loss during past 3 months, (%)
No weight loss 1 to 3 kilos Does not know > 3 kilos 41.7 25.0 0 33.3 75 16.7 2.1 6.2 Mobility, (%) Goes out
Able to get out of bed/chair but does not go out Bedridden or chair-bound 0 11.1 88.9 8.3 35.4 56.3 Psychological stress or acute disease during the past
3 months, (%) No Yes 44.4 55.6 79.2 20.8 Neuropsychological problems, (%) None Mild dementia 2.8 30.6 25.0 45.8
Severe dementia or depression 66.7 29.2 BMI kg/m2 (%) 23 and > 21 to < 23 19 to < 21 < 19 30.6 8.3 22.2 38.9 77.1 14.6 6.3 2.1 MNA: Mini Nutritional Assessment, MNA-SF: MNA short form
Table 5: Characteristics of nursing homes in relation with proportion of undernourished residents (N=36) Proportion of undernourished residents < median, n=18 Proportion of undernourished residents > or = to median, n=18 P*
Number of available beds, mean (SD) 81.4 (43.3) 64.2 (28.3) 0.17
Staff ratio, mean (SD 0.34 (0.13) 0.30 (0.17) 0.45
Proportion of residents needing help during
meals, mean (SD) 0,27 (0.19) 0.19 (0.16)
0.18
Meals prepared in the institution, (% of N) 88.9 100.0 0.48
Menu supervision by dietician (% of N) Yes, a staff member
Yes, external provider None 5.6 72.2 22.2 0 27.8 72.2 0.009 HACCP training (% of N)
Malnutrition screening training (% of N) Malnutrition management training (% of N) Diet training (% of N) 88.9 33.3 27.8 55.6 83.3 38.9 16.7 44.4 0.46 0.76 0.35 0.5
Swallowing disorders training (% of N) 44.4 16.7 0.07 Weighing equipment (% of N)
None or bathroom scales Chair-scales or medical scales
Special equipment for bed-ridden people
33.3 38.9 27.8 33.3 33.3 33.3 0.92
Malnutrition screening procedure (% of N) At admission
During the stay
Hydration follow-up procedure (% of N) Weight follow-up procedure (% of N) Dietary intake follow-up procedure (% of N)
38.9 44.4 77.8 83.3 77.8 33.3 50.0 88.9 83.3 94.4 1.00 0.74 0.66 1.00 0.15 Night fasting period
Mean in hour (SD) 11.51 (0.63) 11.73 (0.63) 0.30 Availability of (% of N) Dental care Physical activities 77.8 72.2 55.6 88.2 0.16 0.16