HAL Id: hal-01134435
https://hal.archives-ouvertes.fr/hal-01134435
Submitted on 29 Nov 2018
HAL is a multi-disciplinary open access
archive for the deposit and dissemination of
sci-entific research documents, whether they are
pub-lished or not. The documents may come from
teaching and research institutions in France or
abroad, or from public or private research centers.
L’archive ouverte pluridisciplinaire HAL, est
destinée au dépôt et à la diffusion de documents
scientifiques de niveau recherche, publiés ou non,
émanant des établissements d’enseignement et de
recherche français ou étrangers, des laboratoires
publics ou privés.
Distributed under a Creative Commons Attribution| 4.0 International License
Dynamic clonal analysis based on chronic in vivo
imaging allows multiscale quantification of growth in the
Drosophila wing disc
Idse Heemskerk, Thomas Lecuit, Loïc Le Goff
To cite this version:
Idse Heemskerk, Thomas Lecuit, Loïc Le Goff. Dynamic clonal analysis based on chronic in vivo
imag-ing allows multiscale quantification of growth in the Drosophila wimag-ing disc. Development (Cambridge,
England), Company of Biologists, 2014, 141 (11), pp.2339-48. �10.1242/dev.109264�. �hal-01134435�
Dynamic clonal analysis based on chronic in vivo imaging allows
multiscale quantification of growth in the Drosophila wing disc
Idse Heemskerk1, Thomas Lecuit2,* and Loïc LeGoff2,*ABSTRACT
In the course of morphogenesis, tissues change shape and grow. How this is orchestrated is largely unknown, partly owing to the lack of experimental methods to visualize and quantify growth. Here, we describe a novel experimental approach to investigate the growth of tissues in vivo on a time-scale of days, as employed to study the Drosophila larval imaginal wing disc, the precursor of the adult wing. We developed a protocol to image wing discs at regular intervals in living anesthetized larvae so as to follow the growth of the tissue over extended periods of time. This approach can be used to image cells at high resolution in vivo. At intermediate scale, we tracked the increase in cell number within clones as well as the changes in clone area and shape. At scales extending to the tissue level, clones can be used as landmarks for measuring strain, as a proxy for growth. We developed general computational tools to extract strain maps from clonal shapes and landmark displacements in individual tissues, and to combine multiple datasets into a mean strain. In the disc, we use these to compare properties of growth at the scale of clones (a few cells) and at larger regional scales.
KEY WORDS:Drosophila wing, Growth, Image analysis, In vivo imaging, Mathematical analysis, Morphogenesis
INTRODUCTION
Over the course of organismal development, cells change shape, move and exchange neighbors, which changes the shape of the tissue. Cells also grow and divide, leading to increase in mass in an isotropic or polarized fashion (Lecuit and Le Goff, 2007). Our understanding of developmental mechanics has improved considerably in recent years. We now understand how changes in tissue shape rely on the redistribution of adhesion molecules and the acto-myosin cortex underlying mechanical stress (Behrndt et al., 2012; Bertet et al., 2004; Blankenship et al., 2006; Nishimura et al., 2012; Rauzi et al., 2008; reviewed by Heisenberg and Bellaïche, 2013). One can also determine cell lineages from the one-cell stage to the gastrula, as performed in zebrafish and Drosophila embryos by in toto imaging (Keller et al., 2010; Krzic et al., 2012; Olivier et al., 2010; Tomer et al., 2012).
These approaches have addressed the morphogenesis of embryos during gastrulation, when cell divisions partition the egg without increase in mass (cleavage). Growth proceeds at later, post-embryonic stages, when the organism has usually become motile. This makes observation of growing tissues more challenging. Growth is also a slow process, requiring observation over extended times beyond 1 day (longitudinal analysis). Only in Arabidopsis leaf and meristem
has it been possible to map the rate and orientation of growth by outlining each cell as it grows and divides (Sappl and Heisler, 2012; Uyttewaal et al., 2012). Such an analysis was possible because plants do not move, their leaves develop externally, and no cellular rearrangements take place during divisions, making cell tracking easier. In animal tissues, most current state-of-the-art approaches use ex vivo cultures and assess growth from the external envelope of the tissue (Boot et al., 2008). It is then difficult to maintain normal behavior of the tissue on long time-scales. New methods to report shape change of growing animal tissues in vivo are needed.
Among the most successful models for the determination of tissue size and shape are the precursors of Drosophila wings, termed the imaginal wing discs. Wing discs are epithelia that grow from ∼30 to 50,000 cells in 5 days. Although genetic analysis has revealed the molecular pathways underlying their growth, how these pathways are orchestrated to yield an organ of a given size and shape remains poorly understood. Two methods have been used to assess growth in wing discs. The first is counting cell divisions after fixing and staining the tissues for a mitotic marker. This approach only yields indirect maps of growth for several reasons: it is static; it does not measure the orientation of growth; and it counts mitosis (a partition of space) not actual growth (Su and O’Farrell, 1998). Recent advances in live imaging made it possible to observe cell divisions in living, cultured imaginal discs ex vivo (Gibson et al., 2006). However, growth in these cultures alters within a few hours, owing to a lack of culturing conditions that sufficiently reproduce the in vivo state, and does not eventually yield an adult wing. Cell divisions can also be observed and quantified in vivo in the abutting notum at later pupal stages, when the larva becomes still (Bosveld et al., 2012). However, this is a stage with no mass increase. The second method to measure growth is to perform clonal analysis: the lineage of individual cells is genetically labeled, providing a proxy for growth at an intermediate scale between the cell and the tissue. Clonal analysis has been instrumental in qualitatively understanding growth of the Drosophila wing (Garcia-Bellido and Merriam, 1971). In combination with genetic mutations, it also facilitated dissection of the pathways that control size and shape. New techniques recently expanded the toolbox of clonal analysis to multicolor lineages inspired by the Brainbow strategy (Livet et al., 2007; Boulina et al., 2013; Worley et al., 2013). The established method for inferring growth from clones is to dissect the discs out of the larvae, fix and then image them. The problem with this approach is that one only sees the final shape, which is the cumulative effect of possibly different patterns of growth and cell death at different times. Clonal analysis provides the experimental groundwork for many, if not most, models of developmental regulation in Drosophila. Because these models are dynamic by nature, what is needed is the ability to observe clonal shape changes, by comparing clonal shapes at different times.
Here, we describe a novel approach to observe, segment and analyze growing clones inside living Drosophila larvae. We first
1
Kavli Institute for Theoretical Physics, University of California, Santa Barbara, CA 93106, USA.2Aix Marseille Université, CNRS, IBDML UMR7288, case 907, Marseille 13009, France.
describe a protocol for in vivo imaging of imaginal discs, which provides minimal physiological perturbation. We then briefly illustrate in vivo imaging in different contexts: imaging the cytoskeleton, observing wild-type (WT) and perturbative clones. We also describe a method to quantify growth-associated deformations in the tissue using chronic imaging. Repeated imaging of clones allows observation of their evolving morphology. At the same time, larger scale information comes from observing how clones drift away from each other. We show how the use of a continuum approach allows one to extract relevant quantitative information on changes in the size and shape of the tissue. We observe scale-dependent properties in the deformations of the tissue, raising new questions concerning growth control in the Drosophila wing.
RESULTS
In vivo imaging of Drosophila wing discs
We developed a protocol to image wing discs inside anesthetized larvae. Wing discs are located beneath the dorsal cuticle, which makes their imaging possible. We used a custom chamber that holds larvae with good optical accessibility of wing discs without compressing the larvae (Fig. 1A-D; see below for the assessment of mechanical constraints). The chamber has a simple design: it consists of a holder for the larvae (Fig. 1C) on a glass-bottom Petri dish with a magnetic spring (Fig. 1B, inset). A 3D printed lid connects the chamber to circuitry for controlled exposure to the anesthetic desflurane (Füger et al., 2007) (Fig. 1D). We developed a simple approach to provide vaporized desflurane with only plastic syringes. This approach
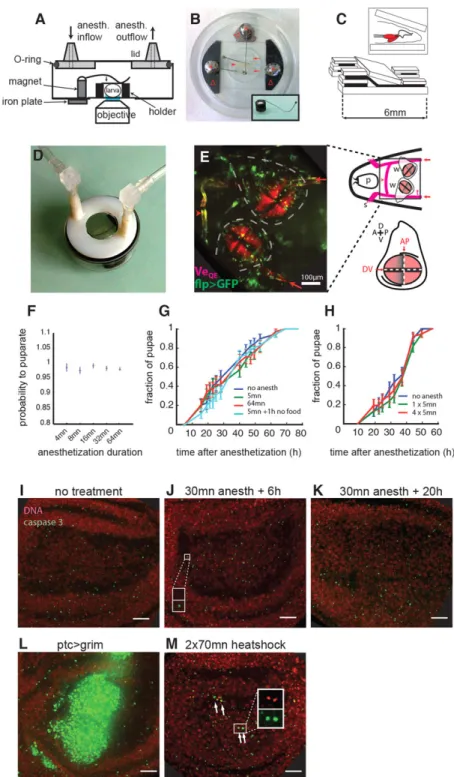
Fig. 1. Chamber design and larva positioning forin vivo imaging of wing discs. (A) Imaging chamber. (B) Imaging chamber with a larva (arrowhead), holder (arrows), magnetic springs (asterisks) and iron plates to hold the springs at the base (Δ). Inset illustrates that the magnetic springs consist of bent pins soldered on a neodymium magnet. (C) Schematic of the wedge-shaped holder. Inset illustrates how the larva is placed dorsal side against a glass-bottom Petri dish (wing discs in red). (D) The chamber connected to anesthetics circuitry. (E) In vivo imaging of the thoracic segments of a larva. The wing pouches are labeled using the vestigial quadrant reporter (VeQE-DsRed). Flip-out clones are in green. Contours of the wing discs are outlined (dashed line). Also visible are the crossbranches (arrowhead) and the lateral trunks (arrows) of the trachea. In the schematic on the right: p, pharynx; s, spiracle; w, wing disc; t, trachea. The relationship between VeQE-DsRed and compartment boundaries (see
supplementary material Fig. S3) is illustrated in the bottom part of the schematic; A/P/D/V, anterior/posterior/dorsal/ventral side. (F) Larvae survive anesthetization and pupariate equally well for a range of anesthetization times. Error bars: interquartile range of a bootstrap distribution. (G) Anesthesia does not induce developmental delay. Third instar larvae were anesthetized for 5 min or 1 h and the formation of pupae was scored over time. No difference is seen compared with the control. (H) Multiple rounds of anesthetization (four times over 6 h, compared with once) leads to no developmental delay. Different egg-laying periods and environmental temperatures explain why kinetics differ slightly from G. Error bars in G,H are s.d. from
bootstrapped distributions. (I-M) Anesthesia does not induce cell death. A projection of caspase 3 staining of a wing disc 6 h (J) or 20 h (K) after a 30 min anesthetization is similar to that of an untreated larvae (I). The small puncta constitute non-specific background that adds up in the maximum intensity projection; they do not colocalize with DNA material (see inset in J, with both channels zoomed on a punctum at a single plane). (L) Massive cell death in wing discs expressing the gene grim in a central band. (M) Small amount of cell death (arrows) after extended heat shocks (inset is a magnification at a single plane to show the colocalization of DNA and caspase 3 signal in apoptotic cells). Scale bars: 16 µm in I-M.
(see Materials and Methods and supplementary material Fig. S1) is simpler than a vaporizer (our initial approach) and as efficient at generating well-controlled anesthesia.
With this system, we obtained high-resolution images of imaginal wing discs inside larvae with different confocal imaging modalities, illustrating their relative ease of visualization: spinning disc (Fig. 1E; supplementary material Fig. S2), point scanning confocal, and two-photon microscopes (Fig. 2 and thereafter). We used two-two-photon microscopy in this study for better deep tissue imaging. The wing pouch was identified with a reporter of the vestigial quadrant enhancer (Zecca and Struhl, 2007) (VeQE-DsRed; Fig. 1E). vestigial is the selector gene that specifies wing identity. Its quadrant enhancer drives expression throughout the entire pouch, except near the compartment boundaries, which allowed us to delineate the boundaries and use them as coordinate axes for data registration (supplementary material Fig. S3; summarized in the schematic of Fig. 1E).
Control experiments showed that anesthesia does not alter the physiology. First, all larvae survive anesthesia and subsequently pupariate, irrespective of anesthesia duration (Fig. 1F). Second, anesthesia has no impact on developmental timing, which is indicative of the absence of physiological stress (Fig. 1G); this holds for multiple rounds of anesthesia distributed over several hours (Fig. 1H). Third, anesthesia induces no cell death in the wing disc (caspase 3 immunostaining; Fig. 1I-K): we scored two caspase+cells
in ten pouches 6 h after anesthetization, one caspase+ cell in
seven pouches 20 h after anesthetization, and two caspase+cells
in seven pouches without anesthetization. Absence of cell death is not a detection issue, since we could observe massive cell death in wings expressing the pro-apoptotic gene grim (Chen et al., 1996) (Fig. 1L) and mild cell death after extended heat shocks (Fig. 1M),
a perturbation known to induce cell death (Pérez-Garijo et al., 2004). Long (1 h) anesthesia lead to longer recovery as compared with short (4 min) anesthesia (supplementary material Fig. S4). Finally, direct measurement of cell doubling time confirmed that exposure to desflurane does not impact proliferation in the wing disc (see below). Absence of mechanical load on wing discs in immobilized larvae
Immobilization for imaging could generate spurious mechanical constraints inside the larvae. This could distort the wing discs and interfere with quantification of growth and shape changes. Wing discs can easily be squeezed between the body wall and other organs such as the tracheal system.
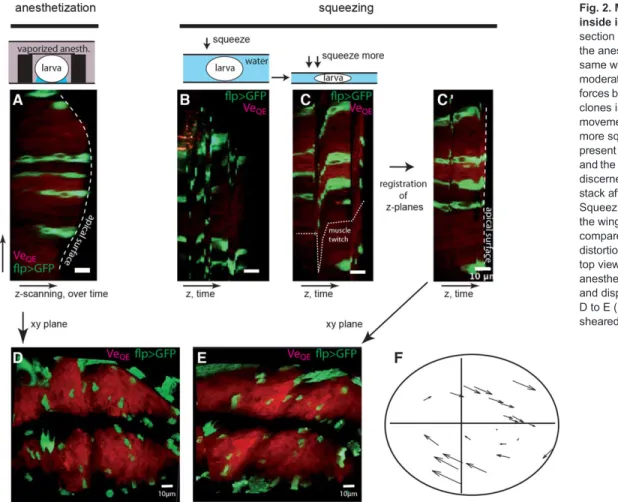
We compared two ways to immobilize larvae: by anesthetization without squeezing and by squeezing without anesthetization. We first imaged a wing disc after anesthetization. The disc showed a natural curvature and compartment boundaries intersected at a right angle (Fig. 2A,D). We then imaged the same wing disc using the capillary force between two coverslips to squeeze the larva. At moderate squeezing, imaging was impossible due to movements of the larva (Fig. 2B). Squeezing more, we could reach a point at which movements were still present (see the‘muscle twitch’ dotted line in Fig. 2C), but individual z-planes could be registered by a combination of manual and automatic post-processing (Fig. 2C0). This reconstituted stack showed important mechanical constraints of the wing disc: it was completely flat, which is not the natural shape of the wing pouch (compare the dashed lines of Fig. 2A and 2C0), and it was significantly sheared in the plane of the epithelium (Fig. 2D-F; for the full stacks see supplementary material Movie 1). Using clones as landmarks in the tissue (see below), we observed
Fig. 2. Mechanical constraints inside immobilized larvae. (A) yz section of a wing disc imaged using the anesthetization chamber. (B) The same wing disc imaged after moderate squeezing by capillary forces between coverslips. Imaging of clones is impossible due to rapid movements of the larva. (C) With more squeezing, movements are still present (see distortion of the clones and the dotted line), but clones can be discerned. (C0) Reconstitution of the stack after registration of z-planes. Squeezing of the larva has flattened the wing disc (see dashed line, and compare with A). (D-F) In-plane distortions generated by squeezing: top view of the wing disc after anesthetization (D), squeezing (E) and displacement map in going from D to E (F) show that the wing disc is sheared when the larva is squeezed.
interclone distances that changed by as much as 54% in the shearing process. We thus conclude that, in our hands, squeezing larva to immobilize them leads to mechanical stress of the wing discs, which in turn induces artifactual strains that preclude growth quantification. To assess avoidance of mechanical load using the anesthesia protocol, we imaged at high speed a wing disc in a conscious larva before anesthetization (using resonant mirror scanning of the laser, which accounts for the reduced resolution). The anterior movement of the head (associated with foraging) drags the wing disc over long distances, which would generate mechanical shearing if the wing discs were constrained in any way. As illustrated in supplementary material Fig. S5 and Movie 2, the movement of the wing disc as it was dragged was not hindered. Once the translational and rotational movement of the disc were subtracted, no deformation of the disc was observed, thus demonstrating that wing discs are not mechanically perturbed by the imaging protocol. Any changes in the shape of wing discs that we observe in our experiments can thus be attributed to morphogenetic processes and not to experimental manipulations. Cellular imagingin vivo
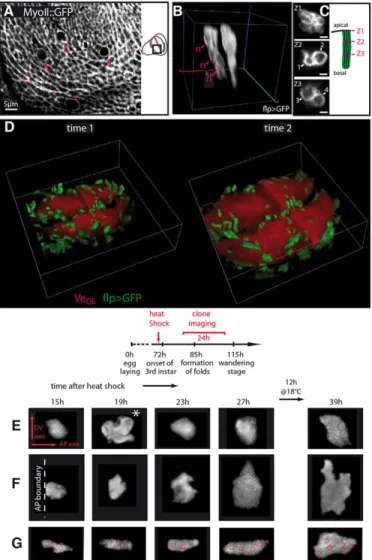
In vivo imaging provides high resolution images. To illustrate this, we imaged a GFP fusion of the Myosin II regulatory light chain (MyoII::GFP). The cell cortex was revealed in a similar manner as with ex vivo cultures: supracellular MyoII cables are observed at the presumptive margin (magenta arrowheads in Fig. 3A), as reported by Major and Irvine (2005), as well as in the periphery of the pouch (LeGoff et al., 2013). We also imaged dividing cells (supplementary material Fig. S6), where we distinguished two cortical pools of MyoII– one lateral in the rounded region where the mitotic spindle is localized and one more apical at the level of adherens junctions, consistent with previous observations (Meyer et al., 2011). It is thus possible to perform high-resolution cellular imaging in vivo. One reason for this appears to be that there is very little signal attenuation by the cuticle when using the two-photon microscope (supplementary material Fig. S7).
Imaging growing clones
Although anesthetization is innocuous and high-resolution imaging is possible in vivo, several factors still make it difficult to characterize growth by continuously tracking all cells in the tissue over extended times. First, larvae need food to grow. Starvation leads to the retention of insulin-like peptides, which alters growth and development (Colombani et al., 2012). Second, continuous imaging perturbs growth. Cells quickly stop dividing upon light exposure, even at low levels (Carlton et al., 2010). Imaging a full pouch requires capturing 50-70 planes. A 4D movie therefore presents a potentially deleterious amount of light. For these reasons, we analyzed tissue growth using chronic (i.e. discontinuous– the interval between snapshots being anywhere from 1 h to 24 h) rather than continuous imaging. Growth is then more easily characterized within clones (which can be as small as one cell). We generated ‘flip-out’ clones with both the Gal4/UAS system to express a cytosolic GFP and the LexA/LexAop system to express a membrane GFP (wing identity being marked by RFP). The two different types of clones, together with the reference provided by the compartment boundaries, made it easy to track individual clones from one snapshot to the next. We could image clones from the apical to the basalmost plane of the epithelium (Fig. 3B). LexA and Gal4 clones were discernible from the clearing of fluorescence around the nuclei in the former (left clone in Fig. 3B). Cellular resolution was still attained in these tissue-scale images (Fig. 3C; the full 3D stack of a pouch is shown in supplementary material Movie 3).
Two successive snapshots of the same disc separated by 12 h are shown in Fig. 3D (see also the 3D animation in supplementary material Movie 4). In between acquisitions, larvae were allowed to recover from the anesthesia (heartbeat and first movements within seconds, 5 min to full motility; see supplementary material Fig. S4), and put in individual vials in the presence of soft food for normal growth to proceed. Counting the increase in cell number of 20 clones in between snapshots gives an average cell doubling time (CDT) of 10.3±3 h (s.d.) when anesthesia lasted 5 min. Increasing the duration of anesthesia to 20 min did not significantly change CDT (10.8±2.6 h), neither did repeating this 20 min anesthesia twice (10.5±3.5 h). These measurements, which were made on mid-third instar wing discs [85-96 h after egg laying (AEL)], are in agreement with a recent estimate of 9 h for the 72-96 h AEL
Fig. 3. Cellular imagingin vivo. (A) MyoII::GFP in a subregion (indicated on the schematic) of a wing pouch. Arrows point to mitotic cells and arrowheads to the polarized enrichment in MyoII in the margin and periphery of the pouch. (B) 3D view of a membrane-GFP-labeled LexA clone (left) and a cytosolic-GFP-labeled Gal4 clone (right). Nuclei (n) of the LexA clone can be localized. (C) Sections of the LexA clone at different z-planes: high resolution of individual cells is attained, thus allowing the nuclei to be counted. Here, the clone comprises four cells. Scale bars: 2 µm. (D) Large-scale 3D view of two successive snapshots of the same wing disc (12 h interval). Boxes are 200 µm wide. (E-G) Tracking of three clones over 24 h. A cell division is visible for clone E at 19 h after heat shock (asterisk). The approximate position of nuclei is superimposed in G. Imaging interval is 4 h, except for the last interval, which is 12 h (overnight).
interval, based on static clonal analysis (Martín et al., 2009). This confirms that the anesthesia does not impede growth and development of the tissue.
Clones can be imaged multiple times over an extended duration, as demonstrated in Fig. 3E-G, where clones were followed over 24 h and can be seen to change shape significantly. Nuclei can be localized in the LexA clones. We superimposed the position of nuclei for the clone in Fig. 3G. It is not perfectly representative of the apical shape of the clone, as in a pseudostratified epithelium cells can be tortuous.
Clonal perturbations of growth
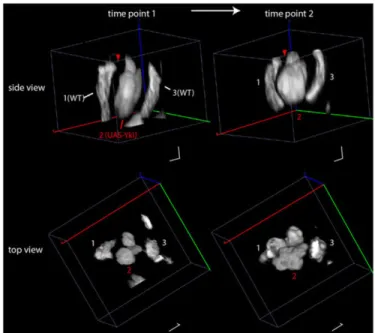
We further illustrate chronic imaging of clones with genetic perturbation of the Hippo pathway, which is involved in the growth control and polarity of the wing disc (Halder and Johnson, 2011; Huang et al., 2005; Tapon et al., 2002). Gal4/UAS clones overexpressed a downstream component of Hippo, the co-transcriptional activator Yorkie (Yki), which results in transcriptional activation of cell growth (Huang et al., 2005). These clones were co-induced with WT LexAop clones. Fig. 4 shows a representative example of a Yki clone surrounded by two WT clones at two successive time points separated by 8 h (see also the 3D animation in supplementary material Movie 5). The second snapshot reproduces what we observed previously (LeGoff et al., 2013). With the chronic imaging, the overgrowth can now be measured directly. We observed a significant overgrowth of the Yki clone surface in an 8 h interval at room temperature [124.5±15% (s.e.m.) versus 54±16%, n=23 Yki and n=13 WT clones; cumulative distribution shown in supplementary material Fig. S8; P=0.01 (Kolmogorov–Smirnov test)]. The overgrowth also generated a non-autonomous perturbation of the surrounding tissue, as indicated by the bending of the WT clones (1 and 3) in Fig. 4, and the thinning of the unlabeled interstitial tissue (red arrowhead). This perturbation is consistent with a local pressure increase generated by the overgrowing clone (LeGoff et al., 2013).
Quantifying changes in shape and size with the strain tensor The above results serve to demonstrate qualitative applications of chronic imaging. To further explore the potential of this method we then used the dynamic data to characterize growth more quantitatively. A natural definition of growth is the increase in mass, and correspondingly in volume. Increases in cell volume manifest in enlargement and geometric changes of the tissue, the sum of which we refer to as deformation or distortion. How this morphogenetic deformation is linked to the increase in cell volume depends on the elastic properties of the tissue, on the orientation of cell divisions, and on possible cellular rearrangements. In plants, no cellular rearrangements take place, and the deformation is simply the result of a polarized growth of the cells linked to an asymmetry in cell wall stiffness. In animal tissues, the situation is more complex because rearrangements occur. A first step in the understanding of how growth, mechanics and possibly cell rearrangements give rise to tissue shape is to actually quantify the deformation.
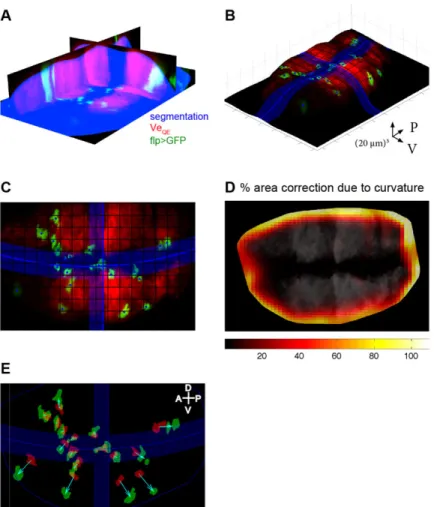
The clonal data obtained at different times provide information on the deformation of the wing pouch. Because tissue mechanics is dominated by the apical surface, where active forces and adhesion are concentrated, this was taken as a proxy for the deformation of the entire tissue. To analyze deformation we segmented the wing pouch (Fig. 5A) and extracted the signal from its apical surface (Fig. 5B,C). We then segmented the outline of clones at the apical surface. We measured deformation on the curved apical surface by computing local quantities– such as clonal area or displacement – in a plane tangential to the surface at that point instead of a projection along the
z-axis. To provide an estimate of how large these corrections are, Fig. 5D shows the systematic error in the area of clones due to projection. Errors due to projection in other quantities were also derived (see mathematical appendix section 5 in the supplementary material for 3D correction of the strain).
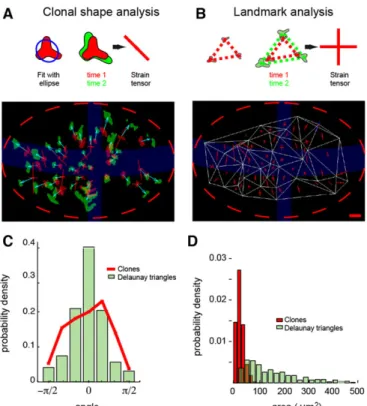
Tissue deformation was locally quantified by estimating the distortion tensor (Blanchard et al., 2009; Landau and Lifshitz, 1976), which can be thought of as a 2×2 matrix that contains all the information about size and shape changes. The most important component of the distortion is its symmetric part, termed the‘linear strain’. Quantities such as area increase, direction of growth and anisotropy can be easily extracted from the linear strain (see mathematical appendix section 2 in the supplementary material). We use the same convention to represent tensors as Blanchard et al. (2009): a crossbar oriented along the principal components of the strain with positive components in red and negative components in blue. These represent the main directions along which there is extension/convergence. Once clones are paired from one snapshot to the next (Fig. 5E), the strain tensor can be estimated from how clones change shape from initial to final configuration, with shape approximated by an ellipse (Fig. 6A, schematic, right; see mathematical appendix section 4 in the supplementary material).
However, there is more information in a clonal experiment than the growth and shape of the individual clones. Clones drift away from each other as a result of growth of the tissue surrounding them. By treating the centers of the clones as landmarks we obtained a different measurement of deformation.
Measuring strain in individual discs
To obtain strain maps for individual discs, we computed the Delaunay triangulation of the landmarks and calculated strain tensors from how triangles transformed between the initial and final configuration (Fig. 6B, schematic, right; see mathematical appendix section 3 in the supplementary material). Note that the same
Fig. 4. Chronic imaging ofHippo signaling perturbations. Gal4 flip-out clones overexpress Yki, whereas LexA flip-outs are WT. The side view and top view of two successive snapshots of a Yki clone (clone 2) adjacent to two WT clones (clones 1 and 3) are represented. The overgrowth of the Yki clone induces a non-autonomous mechanical perturbation of the tissue, which induces shape alteration of the WT clones. Note also how the interstitial tissue (arrowhead) thins as a consequence of the perturbation.
quantity is inferred from the clones and the triangles, and although this would add needless complication we could also infer the landmark strain from the transformation of its circumscribed ellipse and obtain the same outcome. The results of these growth measurements are displayed for one particular pouch in Fig. 6A,B. Both the clonal and the landmark analysis yield strongly anisotropic growth, as seen from the elongated crossbars in Fig. 6A,B. For all discs analyzed, growth is oriented dorsoventrally (see below) and shows variability in the orientation and the magnitude of anisotropy. This variability is stronger for the clones than for triangles. Fig. 6C shows the distribution of growth orientation with respect to the anteroposterior (AP) boundary for the clones and triangles (250 clones and 350 triangles, from 12 discs). The distribution for the triangles is sharper around the zero mean (s.d.=36° for triangles versus 46° for clones, P=0.008). As the triangles are bigger than the clones (Fig. 6D), this might reflect the expected reduction in s.d. when integrating the contribution of more growing cells in a patch of tissue.
Combining data from multiple discs in specified regions of interest
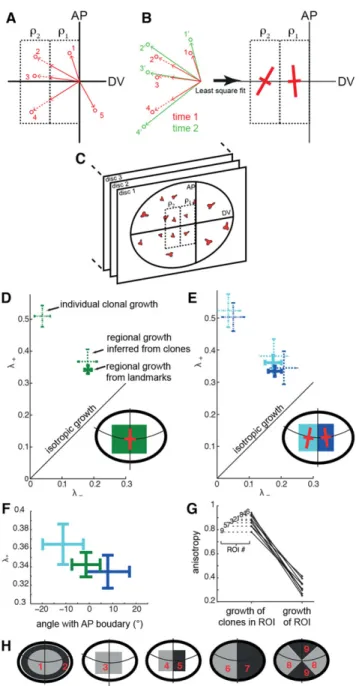
Clones are randomly distributed in space. Consequently, triangles vary widely in size (compare the distribution of area for triangles and clones in Fig. 6D). Furthermore, since each disc yields a different triangulation, multiple discs cannot easily be averaged to generate a spatial strain map with a better signal to noise ratio. To solve this problem, we developed a second approach to computing strain from landmarks, in which one can strictly define regions of interest (ROIs). For each clone, we consider the line that connects it to the intersection of the compartment boundaries (red arrows in
Fig. 7A). The intersections of a given line with the ROI boundaries define line segments that belong to specific ROIs (solid and dashed arrows, corresponding to two different ROIs in Fig. 7A). We can determine the strain in an ROI by computing the regional transformations that best map the sum of the transformed segments into the final position of clones using a least-square fit (Fig. 7B; for details see mathematical appendix section 6 in the supplementary material). Because clones need not come from the same disc, and because we define ROIs common to all the discs analyzed, this provides a natural way to average over multiple discs (Fig. 7C).
Dynamic clonal analysis therefore provides us with a strain tensor at two different scales: the clonal scale, which can be as little as a few cells; and the regional scale, where the ROI can span a large portion of the tissue. The regional strain can be computed by the landmark approach described above, but also by computing the average strain of clones within the ROI. Subsequently, we call growth at the clonal scale‘individual clonal growth’ or simply ‘clonal growth’. We call growth measured in an ROI with the landmark approach the ‘regional growth from landmarks’ and the regional average strain from clones the‘regional growth inferred from clones’. We point out that our methods to infer strain from clones are not specific to the wing disc and could be applied to dynamic clonal data in any tissue. Comparing regional growth from clones and landmarks is useful as it provides a non-trivial consistency check. Uncertainty in the landmark regional growth is smaller, which is intuitive given that it also takes into account information in between the clones. Fig. 7D shows the quantification of growth combining measurements from 12 discs with a time interval of 7 h. We analyze growth in a region of the wing pouch centered on the AP compartment boundary. The
Fig. 5. Image processing for dynamic clonal analysis. (A) Cross-sectional view of the segmented wing pouch (blue), together with the VeQEsignal (red) and flip-out clones (green). (B,C) Apical surface of the wing pouch in 3D (B) and top view (C). Clonal centers and compartment boundaries are in blue. (D) Quantification of curvature effects on the area reveals their importance in the periphery. (E) Final output of image processing: a set of corresponding outlines of initial (red) and final (green) clones connected by displacement vectors (cyan).
crossbar on the disc schematic represents the regional strain from landmarks in this ROI. It is anisotropic and oriented dorsoventrally [thus justifying the use of the dorsoventral (DV) axis as a reference in Fig. 6]. The plot shows three quantities: the eigenvalues (quantifying expansion along the main orientations) of the regional strain from landmarks; the eigenvalues of the regional strain from clones; and the average eigenvalues of individual clonal strains within the region. We first observe that both the landmark and the clonal approach give the same regional strain (but note the different error bars), passing the consistency check mentioned above. There is a marked difference between the individual clonal strains and the regional strains. In particular, individual clones grow more anisotropically (indicated by the greater difference betweenλ+andλ−). As shown in Fig. 7G,H for nine arbitrary regions, we observe that anisotropy of the regional growth is systematically less than the mean anisotropy of individual clonal growth. This means that although individual clones grow very anisotropically, they do so in different directions, leaving the mean tissue growth more isotropic. Larger regions average and smoothen local heterogeneities in anisotropy. How these heterogeneities compensate each other to produce this effect is an interesting biological question. Although anisotropy is affected by the averaging process, total growth cannot be, which is reflected in the fact that the
total fractional expansion (ΔA/A), as given by the sum of eigenvalues (λ++λ−), is the same for individual clones and regional measurements [0.52±0.02 (s.e.m.) for regional from landmark, 0.55±0.06 for individual clonal growth; note the greater uncertainty for clonal than for regional growth].
Changing the ROIs can refine the observed patterns. Subdividing the previous region into smaller regions (Fig. 7E), we observe a very similar growth, except that orientation is now at a slight angle with respect to the AP boundary in a mirror symmetric fashion (see crossbars in the schematic of Fig. 7E). Although the effect is small, the separation of orientation does fall outside the error bars (Fig. 7F). This orientation might reflect the normal state of growth at the DV boundary, which is slightly curved (as schematized in Fig. 7E), or that the AP boundary plays a role in orienting growth in its vicinity.
DISCUSSION
Using a simple protocol for in vivo imaging, we developed tools to assess morphogenesis of the Drosophila wing disc at different scales. Cells can be imaged individually at high resolution. Clones can be tracked in time and their deformations quantified. They can also be used as landmarks to quantify larger scale deformations. At the core of our analysis is the ability to make consecutive snapshots of the same wing disc, thus allowing measurement of strain rates, which reflect growth. Our quantitative analysis focuses on clonal to tissues scales, but image quality potentially allows for extension to the cellular level.
Comparing clonal and regional growth
Our measurements of regional mean growth based on clonal shapes or clonal landmarks presented in Figs 6 and 7 yield the same result (‘region’ being either the Delaunay triangles of Fig. 6 or the ROIs of Fig. 7). However, variability of clonal growth around this mean is large. This is best exemplified by the observation that growth of individual clones is very anisotropic (Fig. 7G), but that variability in their orientation leads to a more isotropic mean.
The more isotropic mean could naturally be the result of averaging out statistically independent growth fluctuations with increasing length scales (from cell to clones and from clones to regions). Cells may grow and divide in noisy but independent response to global instructions such as morphogens and polarity cues. However, the need to preserve tissue integrity and mechanical constraints make it plausible that some kind of feedback is involved. A feedback would spatially correlate both the orientation and the rate of cell divisions to yield smooth growth at the tissue scale or maintain a constant growth rate. A striking manifestation of such compensatory mechanisms is cell competition (Levayer and Moreno, 2013). Determining the scale-dependent spectrum of growth fluctuations will help discriminate different mathematical models of growth in the wing pouch.
Dynamic clonal analysis can be used in different contexts There are a number of potentially interesting future applications for dynamic clonal analysis. First, it will enable precise quantification of growth in the wing disc over long time-scales, allowing changes in the geometry of tissue to be mapped at different stages of development. As illustrated in Fig. 7D,E, one can define smaller ROIs as one accumulates statistics. One can then tile the tissue to generate a map of the strain tensor. As discussed above, this is required to test models for growth regulation.
Second, dynamic clonal analysis will help characterize growth phenotypes in mutants in genes of interest. As illustrated with Yki
Fig. 6. Strain tensors obtained from clonal shape and landmark analysis. (A) Clonal shape analysis. The shape of the clone is fitted to an ellipse, and the strain tensor is derived from the linear transformation that changes the first ellipse into the second ellipse. The map of the strain tensor (crossbars) is estimated from two successive snapshots of the same wing pouch. Clones are in red for the first and in green for the second snapshot. Blue arrows connect the corresponding clones. The strain tensor provides the principal axis of growth as well as the degree of expansion/compression along these axes. Negative strains are in blue, positive in red. (B) Landmark analysis. Clones (center of mass indicated by red/green dots) are used as landmarks to triangulate the tissue. Deformation of the triangles is similarly described by a strain tensor. Scale bar represents 10 µm and a unit strain (100% expansion). (C) Distribution of growth orientation for the clones and for the Delaunay triangles in a 60 µm region centered around the AP boundary. (D) Distribution of the area of the clones and the Delaunay triangles.
clones in this study, making two acquisitions a few hours apart on a few discs could be sufficient to provide a comparison of growth of the perturbed clones with that of WT internal controls. This could be a powerful tool in the context of RNAi screens. Moreover, genetic perturbations might help in the investigation of feedback mechanisms by longitudinally imaging growth. It is possible that a Yki clone initially overgrows, builds up pressure relative to the rest of the tissue and, in response, lowers its growth rate (Shraiman, 2005). A series of snapshots could reveal this.
So far, we have used the apical surface as a proxy for the epithelium as a whole. Future improvements may include the estimation of growth in a fully 3D analysis.
Comparison with other approaches
Ex vivo culture imaging is frequently used to study wing disc morphogenesis. Unfortunately, these cultures do not sustain the normal growth of discs and therefore can only be used to probe short time-scale dynamics of processes such as mitosis (Gibson et al., 2006, 2011), morphogen spreading (Kicheva et al., 2007) and evagination (Aldaz et al., 2010). Recapitulating the WT patterns of growth in these cultures over long time-scales remains a formidable challenge. Indeed, the proper development of a wing requires a well-defined chemical environment that is strictly controlled in time throughout larval stages. For example, pulses of the hormone ecdysone that occur at different times in the larva can lead to very different outcomes depending on their amplitude or the local concentration of juvenile hormone (Cranna and Quinn, 2009). Nevertheless, one can anticipate some progress that will allow culture for intermediate time-scales (for a recent advance, see Zartman et al., 2013). Eventually, the two approaches– in vivo for longitudinal chronic imaging and ex vivo for high frequency imaging– can complement each other and could be combined in the same experiments (in vivo imaging followed by dissection and ex vivo culture). Wing cells die only after hatching of the fly. One can therefore track GFP clones from the larval up to the adult stages. In vivo imaging could thus be used to connect a range of morphogenetic processes that have thus far been studied in isolation (disc growth, evagination, pupal wing morphogenesis).
Attempts to immobilize Drosophila larvae for imaging have already been performed. They consist of either squeezing (Ghannad-Rezaie et al., 2012; Nienhaus et al., 2012) or anesthetizing (Füger et al., 2007) the larva. Squeezing is easier but can distort wing discs and compromise accurate growth quantification (Fig. 2). Mechanical stress may also damage tissues and induce compensatory growth. Anesthetization, which, as we showed, does not interfere with the development of the larvae (Fig. 1), requires a closed chamber and a vaporizer for the anesthetic. Our chamber design based on simple prototyping and 3D printing, together with the ease of vaporization using two plastic syringes, should make it accessible to the wider community.
How does our approach compare with the state of the art in other model systems? In plants, growth of entire meristems can be fully characterized, each cell division being detected and registered. We are still far from this level of precision. In animal tissues, the poor accessibility of growing organs has slowed the development of tools to quantify growth. Until now, the most accurate characterization– in the mouse limb bud– assessed growth from landmarks on the external envelope of the tissue and required ex vivo culture, with the limitation on growth sustainability discussed above. Zebrafish was used recently to analyze cleavage of the early embryo (Olivier et al., 2010) and proliferation of the growing retina (He et al., 2012). Although the former did not specifically investigate a growing tissue and the latter did not investigate shape changes, these studies
Fig. 7. Estimating regional strain from multiple discs. (A) We estimate the strain in ROIs (here two regions:ρ1,ρ2). At time 1, the arrows connecting clones (red circles) to the compartment boundary intersection are divided into segments belonging to the regions (solid or dashed arrows). Here, clone 1 will contribute to the estimation of strain inρ1, clones 2-4 toρ1andρ2, and clone 5 to neither. (B) To estimate the strains inρ1andρ2, we measure how the combined solid and dashed arrows of time 1 (red) transform into the corresponding arrows at time 2 (green). For this, we least square fit the transformation of all the segments, because the estimation is overdetermined given the large number of clonal displacements. Note that we do not need to break the arrows at time 2 (green) into segments, nor do we need to know the contour ofρ1andρ2at time 2. (C) The same set of ROIs can be used for many discs to obtain average strains. (D-H) Experimental measurements. (D) Comparing regional landmark growth, regional clonal growth and individual clonal growth in a central region of the pouch.λ+and λ−are the eigenvalues of the strain tensor characterizing expansion. The strain tensor for this ROI is shown in the disc schematic. (E) Same as B for two subregions. (F) Characteristics of the principal growth component (eigenvalue and orientation) for the regions of B and C. Error bars in D-F indicate s.e. obtained with the formula described in section 6.2 of the supplementary material mathematical appendix. (G) Clonal growth and regional growth from landmark anisotropy for a set of ROIs in the pouch. Clonal growth is systematically more anisotropic. (H) Schematic of the ROIs used.
illustrated the potential of this model system. Our approach, which measures clonal dynamics rather than fixed final shapes and which can be combined with genetics, is thus one among only a few that provide a means to observe in vivo the dynamics of growth and other plastic processes (competition, regeneration) in animal tissues. MATERIALS AND METHODS
Genetics and fly stocks
The wing pouch was identified with a reporter of the vestigial quadrant enhancer (Zecca and Struhl, 2007; termed 5xQE-DsRed therein, and VeQE -DsRed here). Flip-out clones were generated with both the Gal4/UAS system (Brand and Perrimon, 1993) using act>y+>Gal4 (AyGal4)UAS-GFP (Bloomington Stock Center #4411), and the LexA-LexAop system using the transgene Act>y+>LexA LexAop-CD8::GFP (a gift from C. Bertet, NYU, NY, USA), which is a recombinant of a LexA flip-out (Schwank et al., 2011) with Bloomington Stock Center #32203 (Pfeiffer et al., 2010). UAS-Yki is a gift from P. Leopold (University of Nice, France). Genotypes are listed by figure in supplementary material Table S1. Clones were induced by a 30 min heat shock at 36°C, which led to an approximately equal number of Gal4 clones and LexA clones.
Microscopy
Larvae were immobilized using a custom-made holder mounted in a MatTek 35 mm diameter Petri dish (Fig. 1A,B). The holder was made with pieces of coverslip and double-sided tape (Fig. 1C) and designed to hold the anterior part without compression. The holder was held against the bottom of the Petri dish with springs consisting of bent dissection pins soldered on 5 mm diameter neodymium magnets (inset in Fig. 1B). A small piece of soft iron placed outside of the Petri dish holds the magnets in place inside (Fig. 1A,B).
The chamber was closed with a custom-designed lid (3D-printed by sculpteo.com; the .stl file is provided in the supplementary material) which allowed anesthetics or fresh air to be flushed through outlet ports (Fig. 1A,D). We chose desflurane (Baxter) as an anesthetic owing to its prior successful application in imaging of neuromuscular junctions (Füger et al., 2007). We vaporized desflurane with two plastic syringes as described in supplementary material Fig. S1. We preferred this approach to our initial use of a vaporizer as it was simpler yet performed equally well. The amount of desflurane to add to the syringe depends on the volume of the imaging chamber and must be adjusted empirically. Once established, ideal conditions are reproducible.
A protocol consists of: (1) anesthetizing the larva; (2) immediate imaging of the wing discs; (3) waking up the larva by flushing in fresh air; (4) freeing the larva in soft agar food to allow it to eat and grow; (5) repeating the procedure as many times as needed. In 1 hour, one can typically process three or four larvae with one chamber or six larvae with two chambers (allowing for mounting one larva while imaging the previous one).
Two-photon imaging was performed with a NikonRS two-photon microscope and spinning-disc imaging on a PerkinElmer Ultraview.
Developmental assay after anesthetization
Larvae from several tubes were rinsed and pooled to constitute a single age distribution. Larvae were anesthetized in groups of 50 in the chamber, allowed to recover and put back in pre-minced food. The number of pupae was scored over time during the following days.
Caspase assay after anesthetization
Third instar larvae were washed, anesthetized if required, and left in pre-minced food. They were fixed 6 h or 20 h later using a standard protocol (Klein, 2008). Anesthetized and control groups were stained together and identified post-staining (see supplementary material Table S1 for rationale). Antibodies used were rabbit anti-caspase 3 (1/300; Ozyme #9661) and goat anti-rabbit (1/500; Invitrogen, #A-21244). DNA was stained with Hoechst.
Image processing
Once imaged, the wing pouches were segmented using a custom MATLAB program. The signal from the apical surface was extracted by maximizing the derivative of the VeQEsignal into the stack and interpolating it with a
smoothed thin-plate spline. Clonal data were reduced to a binarized section of the clonal stack just below the apical surface. After segmenting the individual pouches, clones in different snapshots of the same pouch were matched up by the user (Fig. 6E). The analysis pipeline is described in mathematical appendix section 1 in the supplementary material.
Methods for inferring distortion are detailed in the mathematical appendix in the supplementary material: section 2 introduces the distortion tensor and how to extract growth parameters from it; section 3 describes estimation of the strain using clones as landmarks on the tissue; section 4 describes estimation of the strain from the shape of clones; section 5 describes curvature corrections to account for the three-dimensionality of the tissue; and section 6 describes data-merging from multiple discs.
Acknowledgements
We thank C. Bertet, G. Struhl, P. Leopold and the Bloomington Stock Center for Drosophila stocks; M. Mavrakis, R. Levayer, E. H. Chan and B. Shraiman for comments on the manuscript; members of the teams of T.L., P. F. Lenne and B. Shraiman, as well as Pierre Nassoy for discussions; B. Shraiman for help in the analysis; M. Gonzales-Gaitan for discussions and advice on live imaging; the imaging facility and Nikon Imaging Center (Nacem) at IBDM for technical support; and the national infrastructure FBI-Picsl imaging platform for support and assistance.
Competing interests
The authors declare no competing financial interests.
Author contributions
L.L.G. conceived the project and performed the experiments. I.H. and L.L.G. designed and performed data analysis using computational and mathematical procedures developed by I.H. I.H, T.L. and L.L.G. analyzed and discussed the results and wrote the paper.
Funding
This work was funded by the Centre National de la Recherche Scientifique (CNRS; T.L. and L.L.G.), the Fondation pour la Recherche Médicale (équipe labelisée; T.L.) and the Association pour la Recherche sur le Cancer ( programme ARC; T.L.).
Supplementary material
Supplementary material available online at
http://dev.biologists.org/lookup/suppl/doi:10.1242/dev.109264/-/DC1
References
Aldaz, S., Escudero, L. M. and Freeman, M. (2010). Live imaging of Drosophila imaginal disc development. Proc. Natl. Acad. Sci. U.S.A. 107, 14217-14222. Behrndt, M., Salbreux, G., Campinho, P., Hauschild, R., Oswald, F., Roensch, J.,
Grill, S. W. and Heisenberg, C.-P. (2012). Forces driving epithelial spreading in zebrafish gastrulation. Science 338, 257-260.
Bertet, C., Sulak, L. and Lecuit, T. (2004). Myosin-dependent junction remodelling controls planar cell intercalation and axis elongation. Nature 429, 667-671. Blanchard, G. B., Kabla, A. J., Schultz, N. L., Butler, L. C., Sanson, B.,
Gorfinkiel, N., Mahadevan, L. and Adams, R. J. (2009). Tissue tectonics: morphogenetic strain rates, cell shape change and intercalation. Nat. Methods 6, 458-464.
Blankenship, J. T., Backovic, S. T., Sanny, J. S. P., Weitz, O. and Zallen, J. A. (2006). Multicellular rosette formation links planar cell polarity to tissue morphogenesis. Dev. Cell 11, 459-470.
Boot, M. J., Westerberg, C. H., Sanz-Ezquerro, J., Cotterell, J., Schweitzer, R., Torres, M. and Sharpe, J. (2008). In vitro whole-organ imaging: 4D quantification of growing mouse limb buds. Nat. Methods 5, 609-612. .
Bosveld, F., Bonnet, I., Guirao, B., Tlili, S., Wang, Z., Petitalot, A., Marchand, R., Bardet, P.-L., Marcq, P., Graner, F. et al. (2012). Mechanical control of morphogenesis by Fat/Dachsous/Four-jointed planar cell polarity pathway. Science 336, 724-727.
Boulina, M., Samarajeewa, H., Baker, J. D., Kim, M. D. and Chiba, A. (2013). Live imaging of multicolor-labeled cells in Drosophila. Development 140, 1605-1613. Brand, A. H. and Perrimon, N. (1993). Targeted gene expression as a means of altering cell fates and generating dominant phenotypes. Development 118, 401-415. Carlton, P. M., Boulanger, J., Kervrann, C., Sibarita, J.-B., Salamero, J., Gordon-Messer, S., Bressan, D., Haber, J. E., Haase, S., Shao, L. et al. (2010). Fast live simultaneous multiwavelength four-dimensional optical microscopy. Proc. Natl. Acad. Sci. U.S.A. 107, 16016-16022.
Chen, P., Nordstrom, W., Gish, B. and Abrams, J. M. (1996). grim, a novel cell death gene in Drosophila. Genes Dev. 10, 1773-1782.
Colombani, J., Andersen, D. S. and Léopold, P. (2012). Secreted peptide Dilp8 coordinates Drosophila tissue growth with developmental timing. Science 336, 582-585.
Cranna, N. and Quinn, L. (2009). Impact of steroid hormone signals on Drosophila cell cycle during development. Cell Div. 4, 3.
Fü ger, P., Behrends, L. B., Mertel, S., Sigrist, S. J. and Rasse, T. M. (2007). Live imaging of synapse development and measuring protein dynamics using two-color fluorescence recovery after photo-bleaching at Drosophila synapses. Nat. Protoc. 2, 3285-3298.
Garcia-Bellido, A. and Merriam, J. R. (1971). Parameters of the wing imaginal disc development of Drosophila melanogaster. Dev. Biol. 24, 61-87.
Ghannad-Rezaie, M., Wang, X., Mishra, B., Collins, C. and Chronis, N. (2012). Microfluidic chips for in vivo imaging of cellular responses to neural injury in Drosophila larvae. PLoS ONE 7, e29869.
Gibson, M. C., Patel, A. B., Nagpal, R. and Perrimon, N. (2006). The emergence of geometric order in proliferating metazoan epithelia. Nature 442, 1038-1041. Gibson, W. T., Veldhuis, J. H., Rubinstein, B., Cartwright, H. N., Perrimon, N.,
Brodland, G. W., Nagpal, R. and Gibson, M. C. (2011). Control of the mitotic cleavage plane by local epithelial topology. Cell 144, 427-438.
Halder, G. and Johnson, R. L. (2011). Hippo signaling: growth control and beyond. Development 138, 9-22.
He, J., Zhang, G., Almeida, A. D., Cayouette, M., Simons, B. D. and Harris, W. A. (2012). How variable clones build an invariant retina. Neuron 75, 786-798. Heisenberg, C.-P. and Bellaïche, Y. (2013). Forces in tissue morphogenesis and
patterning. Cell 153, 948-962.
Huang, J., Wu, S., Barrera, J., Matthews, K. and Pan, D. (2005). The Hippo signaling pathway coordinately regulates cell proliferation and apoptosis by inactivating Yorkie, the Drosophila Homolog of YAP. Cell 122, 421-434. Keller, P. J., Schmidt, A. D., Santella, A., Khairy, K., Bao, Z., Wittbrodt, J. and
Stelzer, E. H. K. (2010). Fast, high-contrast imaging of animal development with scanned light sheet-based structured-illumination microscopy. Nat. Methods 7, 637-642.
Kicheva, A., Pantazis, P., Bollenbach, T., Kalaidzidis, Y., Bittig, T., Jü licher, F. and González-Gaitán, M. (2007). Kinetics of morphogen gradient formation. Science 315, 521-525.
Klein, T. (2008). Immunolabeling of imaginal discs. Methods Mol. Biol. 420, 253-263.
Krzic, U., Gunther, S., Saunders, T. E., Streichan, S. J. and Hufnagel, L. (2012). Multiview light-sheet microscope for rapid in toto imaging. Nat. Methods 9, 730-733.
Landau, L. D. and Lifshitz, E. M. (1976). Theory of Elasticity, 3rd edn. Oxford: Pergamon Press.
Lecuit, T. and Le Goff, L. (2007). Orchestrating size and shape during morphogenesis. Nature 450, 189-192.
LeGoff, L., Rouault, H. and Lecuit, T. (2013). A global pattern of mechanical stress polarizes cell divisions and cell shape in the growing Drosophila wing disc. Development 140, 4051-4059.
Levayer, R. and Moreno, E. (2013). Mechanisms of cell competition: themes and variations. J. Cell Biol. 200, 689-698.
Livet, J., Weissman, T. A., Kang, H., Draft, R. W., Lu, J., Bennis, R. A., Sanes, J. R. and Lichtman, J. W. (2007). Transgenic strategies for combinatorial expression of fluorescent proteins in the nervous system. Nature 450, 56-62. Major, R. J. and Irvine, K. D. (2005). Influence of Notch on dorsoventral
compartmentalization and actin organization in the Drosophila wing. Development 132, 3823-3833.
Martı́n, F. A., Herrera, S. C. and Morata, G. (2009). Cell competition, growth and size control in the Drosophila wing imaginal disc. Development 136, 3747-3756.
Meyer, E. J., Ikmi, A. and Gibson, M. C. (2011). Interkinetic nuclear migration is a broadly conserved feature of cell division in pseudostratified epithelia. Curr. Biol. 21, 485-491.
Nienhaus, U., Aegerter-Wilmsen, T. and Aegerter, C. M. (2012). In-vivo imaging of the drosophila wing imaginal disc over time: novel insights on growth and boundary formation. PLoS ONE 7, e47594.
Nishimura, T., Honda, H. and Takeichi, M. (2012). Planar cell polarity links axes of spatial dynamics in neural-tube closure. Cell 149, 1084-1097.
Olivier, N., Luengo-Oroz, M. A., Duloquin, L., Faure, E., Savy, T., Veilleux, I., Solinas, X., Débarre, D., Bourgine, P., Santos, A. et al. (2010). Cell lineage reconstruction of early zebrafish embryos using label-free nonlinear microscopy. Science 329, 967-971.
Pérez-Garijo, A., Martı́n, F. A. and Morata, G. (2004). Caspase inhibition during apoptosis causes abnormal signalling and developmental aberrations in Drosophila. Development 131, 5591-5598.
Pfeiffer, B. D., Ngo, T.-T. B., Hibbard, K. L., Murphy, C., Jenett, A., Truman, J. W. and Rubin, G. M. (2010). Refinement of tools for targeted gene expression in Drosophila. Genetics 186, 735-755.
Rauzi, M., Verant, P., Lecuit, T. and Lenne, P.-F. (2008). Nature and anisotropy of cortical forces orienting Drosophila tissue morphogenesis. Nat. Cell Biol. 10, 1401-1410.
Sappl, P. G. and Heisler, M. G. (2012). Live-imaging of plant development: latest approaches. Curr. Opin. Plant Biol. 16, 33-40.
Schwank, G., Tauriello, G., Yagi, R., Kranz, E., Koumoutsakos, P. and Basler, K. (2011). Antagonistic growth regulation by Dpp and Fat drives uniform cell proliferation. Dev. Cell 20, 123-130.
Shraiman, B. I. (2005). Mechanical feedback as a possible regulator of tissue growth. Proc. Natl. Acad. Sci. U.S.A. 102, 3318-3323.
Su, T. T. and O’Farrell, P. H. (1998). Size control: cell proliferation does not equal growth. Curr. Biol. 8, R687-R689.
Tapon, N., Harvey, K. F., Bell, D. W., Wahrer, D. C. R., Schiripo, T. A., Haber, D. A. and Hariharan, I. K. (2002). salvador Promotes both cell cycle exit and apoptosis in Drosophila and is mutated in human cancer cell lines. Cell 110, 467-478. Tomer, R., Khairy, K., Amat, F. and Keller, P. J. (2012). Quantitative high-speed
imaging of entire developing embryos with simultaneous multiview light-sheet microscopy. Nat. Methods 9, 755-763.
Uyttewaal, M., Burian, A., Alim, K., Landrein, B., Borowska-Wykrę t, D., Dedieu, A., Peaucelle, A., Ludynia, M., Traas, J., Boudaoud, A. et al. (2012). Mechanical stress acts via katanin to amplify differences in growth rate between adjacent cells in Arabidopsis. Cell 149, 439-451.
Worley, M. I., Setiawan, L. and Hariharan, I. K. (2013). TIE-DYE: a combinatorial marking system to visualize and genetically manipulate clones during development in Drosophila melanogaster. Development 140, 3275-3284. Zartman, J., Restrepo, S. and Basler, K. (2013). A high-throughput template for
optimizing Drosophila organ culture with response-surface methods. Development 140, 667-674.
Zecca, M. and Struhl, G. (2007). Recruitment of cells into the Drosophila wing primordium by a feed-forward circuit of vestigial autoregulation. Development 134, 3001-3010.