HAL Id: inria-00539089
https://hal.inria.fr/inria-00539089
Submitted on 24 Nov 2010
HAL is a multi-disciplinary open access
archive for the deposit and dissemination of
sci-entific research documents, whether they are
pub-lished or not. The documents may come from
teaching and research institutions in France or
abroad, or from public or private research centers.
L’archive ouverte pluridisciplinaire HAL, est
destinée au dépôt et à la diffusion de documents
scientifiques de niveau recherche, publiés ou non,
émanant des établissements d’enseignement et de
recherche français ou étrangers, des laboratoires
publics ou privés.
Context matters: Evaluating Interaction Techniques
with the CIS Model
Caroline Appert, Michel Beaudouin-Lafon, Wendy Mackay
To cite this version:
Caroline Appert, Michel Beaudouin-Lafon, Wendy Mackay. Context matters: Evaluating Interaction
Techniques with the CIS Model. [Research Report] 2003. �inria-00539089�
Context matters: Evaluating Interaction Techniques
with the CIS Model
Caroline Appert
Michel Beaudouin-Lafon
Wendy E. Mackay
LRI & INRIA Futurs
Université Paris Sud
Orsay, France
{appert, mbl, mackay}@lri.fr
ABSTRACT
This article introduces the Complexity of Interaction Sequences model (CIS). CIS describes the structure of interaction techniques and predicts their performance in the context of an interaction sequence. The model defines the complexity of an interaction technique as a measure of its effectiveness within a given context. We tested CIS to compare three interaction techniques: fixed unimanual palettes, fixed bimanual palettes and toolglasses. The model predicts that the complexity of both palettes depends on interaction sequences, unlike toolglasses. CIS also predicts that fixed bimanual palettes outperform the other two techniques. Predictions were tested empirically with a controlled experiment and contrast with previous studies. We argue that, in order to be generalisable, experimental comparisons of interaction techniques should include the concept of context sensitivity.
RÉSUMÉ
Cet article introduit le modèle Complexity of Interaction Sequences CIS). CIS décrit la structure des techniques d’interaction et prédit leur performance dans le contexte d’une séquence d’interaction. Le modèle définit la complexité d’une technique d’interaction comme la mesure de son efficacité dans un contexte donné. Nous avons testé CIS pour comparer trois techniques d’interaction : les palettes fixes unimanuelles, les palettes fixes bimanuelles et les toolglasses. Le modèle prédit que, contrairement aux toolglasses, la complexité des deux types de palette dépend des séquences d’interaction. CIS prédit également que les palettes fixes bimanuelles sont toujours plus efficaces que les deux autres techniques. Les prédictions ont été vérifiées empiriquement par une expérimentation contrôlée et contrastent avec les résultats des précédentes études. Nous argumentons que, afin d’être généralisables, les comparaisons expérimentales entre techniques d’interaction doivent prendre en compte le concept de sensibilité au contexte.
Keywords
Interaction technique, Interaction Sequence, Complexity, Context, Palette, Bimanual Palette, Toolglass, Human Factors, Experimentation, Performance, Measurement, Theory.
Mots clés
Technique d’Interaction, Séquence d’Interaction, Complexité, Contexte, Palette, Palette Bimanuelle, Toolglass, Facteurs Humains, Expérimentation, Performance, Mesure, Théorie.
INTRODUCTION
Research in HCI has produced many novel interaction techniques aimed at improving the usability of graphical applications. Yet very few make it into real products. This may be due to the difficulty of assessing the actual value of a technique before it is integrated into a real interface. Researchers often evaluate new interaction techniques with usability studies. However, the results from these studies are often specific to the software and setting, making them hard to generalise. An alternative is a controlled experiment that measures the performance of the technique using a benchmark task. However the choice of the task is crucial: the designers of the technique have an incentive to create test tasks that optimize performance of the technique, as opposed to evaluating its actual performance in context. How can we capture the context of use to better evaluate an interaction technique? We introduce a new model, Complexity of Interaction Sequences (CIS), that addresses context through the notion of an interaction sequence. CIS can describe the structure of interaction techniques and analyze them through a set of criteria, it can also predict the complexity of an interaction technique, i.e. measure its effectiveness given a particular interaction sequence. The goal of CIS is to complement other evaluation techniques by helping researchers understand the effect of context on the performance of interaction techniques.
After a review of related work and an illustration of the problems with controlled experiments, we present the CIS model and apply it to three techniques: fixed unimanual palettes, fixed bimanual palettes and toolglasses. We show the different ways these techniques are sensitive to context, test these predictions with a controlled experiment and compare them to previously published results. We conclude with directions for future work.
RELATED WORK
Formal models of interaction are too numerous to be reviewed exhaustively here. We focus on those that address interaction at a level of abstraction similar to CIS.
Card et al [5] introduce a taxonomy of input devices, described as translators from physical properties to logical parameters of an application. Input devices are evaluated by their expressivity and efficiency, as measured by pointing speed and precision, footprint, etc. The Model Human Processor [8] classifies interactions into elementary tasks such as selection and evaluates their execution with human factors such as memory load or learning time. CIS analyzes interaction at a higher level than input devices and elementary tasks by focusing on interaction techniques. Goals, Operators, Methods and Selection rules (GOMS) [12, 13] is a family of descriptive and predictive models based on task analysis. Keystroke-Level Model (KLM) and CMN-GOMS analyze interaction as a sequence of
elementary tasks and predict its execution time. NGOMSL and CPM-GOMS are more elaborate models based on cognitive theories. GOMS tends to focus on cognitive aspects of interaction rather than the articulatory level. CIS is closer to the sensory-motor aspects of interaction. It models the state of the interface to better analyze the sensitivity of interaction techniques to the context of use. In the Cognitive Dimensions Framework, Green [9] defines six types of activities such as transcription and incrementation and a set of dimensions such as viscosity and visibility to evaluate information artifacts. He shows that users adapt their behaviour to the type of activity and identifies the most important dimensions for each activity. CIS is influenced by this framework, as well as approaches such as Activity Theory [3], that address the interplay between the task at hand and the properties of the available interaction techniques.
DANGERS OF CONTROLLED EXPERIMENTS
Controlled experiments are considered by many as the most scientific way to evaluate interaction techniques. However several known threats to validity must be addressed. A technique may be evaluated with a task too simple to reflect its use in situ. For example, marking menus [15] are radial pop-up menus where an item can be selected by a mark without displaying the menu. In a simple item selection task, they were up to 3.5 times faster than other menus. However, in real use, menu selections would be interspersed with other interactions such as pointing or dragging an object in the direction opposite of the item just selected. Such evaluations may show the technique's peak performance rather than its performance in normal use. Similarly, interaction techniques are often compared with other techniques on a task that favors the tested technique. For example, toolglasses [4] are semi-transparent movable tool palettes used with two hands. To apply a tool to an object, the user clicks through the tool onto the object. Kabbash & Buxton [14] report that toolglasses are faster than other palettes, based on a controlled experiment using the “connect the dots” task: colored dots appear one at a time; users must connect the last dot to the new one with a line matching the color of the new dot (Fig. 1). This task favors toolglasses because successive dots always have different colors: with a palette, selecting a new color requires a round trip to the palette, while the toolglass is always at hand. Even though the experiment was properly controlled and the results carefully reported, it is not clear that the results can be generalized.
Few controlled studies have attempted to explicitely take context of use into account. Mackay [16] compares the efficiency of three interaction techniques (toolglasses, floating palettes and marking menus) used in the CPN2000 interface [2] according to two cognitive contexts: copy and problem solving, similar to Green's transcription and incrementation. She observes that the use of a tool varies according to the context as well as users' preference. Users preference and efficiency are higher with floating palettes in a copy context and with marking menus and toolglasses in a problem solving context. In a copy context, users tend to create objects of the same type in sequence whereas in a problem solving context, they create objects according to their thought processes. In other words, which technique is "best" depends on the context of use.
Even though it is important to evaluate the limit performance of interaction techniques, it is dangerous to overgeneralize the results of such evaluations. Since controlled experiments are costly, it would not be practical to test all possible tasks. What is needed is a model that can describe interaction techniques and predict their comparative performance in realistic settings. The CIS model attempts to address these goals.
CIS: A DESCRIPTIVE AND PREDICTIVE MODEL
Defining an interaction technique
CIS describes an interface as a set of objects that users can manipulate. Some objects are work objects, e.g. drawing shapes, while others are tool objects, e.g. menu items and toolbars. The state of the interface is defined by the set of work and tool objects and the values of their attributes. The set of possible manipulations, called the interaction
space, is described by a set of tuples:
• Creation tuples: (t: T, v1: type(att1), ..., vn: type(attn))
T is the set of object types. This tuple creates an object
of type t with attributes v1, .. vn ;
• Modification tuples: (o: O, att, v: type(att))
O is the set of objects. This tuple assigns the value v to
attribute att of object o;
• Destruction tuples: (o: O, destroy). For example, consider a simple interface that can:
• create rectangles, ellipses and triangles of a predefined size with a fixed unimanual palette (FP) and a toolglass (TG) each with three creation tools;
• modify the fill and line color of a shape with tools similar to the Microsoft Office tools: and ; • delete a shape by selecting it and pressing the ‘del’ key. The three types of work objects and their attributes are: • Rectangle, Ellipse, Triangle:
{p: position, line: color, fill: color} The eight types of tool objects and their attributes are: • FP: {on: {tri, rect, ell}, p_tri: position,
p_rect: position, p_ell: position, s: size} • TG_rect, TG_ell, TG_tri:
{p: position, s: size}
• Fill, Line: {activated: color, p: position, pcolor: position}, color ∈ color
• Del: {p: position}
• Cursor: {p: position}
The interaction space is the set of tuples defined by the following types:
• Creation: (t: {Rectangle, Ellipse, Triangle}, p: position) • Modification: (r: Rectangle, {fill, line}, c: color)
(e: Ellipse, {fill, line}, c: color) (t: Triangle, {fill, line}, c: color) • Destruction: (r: Rectangle, destroy)
(e: Ellipse, destroy)
(s: Triangle, destroy)
An interaction step is a sequence of actions that progressively reduces the set of all possible tuples to a single tuple. We distinguish two types of actions:
• A selection identifies a subset of the current set of tuples; it is usually achieved by moving an object, typically the cursor, over a tool or work object;
• A validation confirms the subset identified by a selection, which becomes the current set of tuples; it is usually achieved by clicking a button or typing a key. An interaction technique is a set of interaction steps that have the same structure, i.e. that consist of similar actions. Two selections are similar if they involve objects of the same type; Two validations are similar if they confirm tuples of the same type.
In our example, if the current state of the interface contains the set WO of work objects, the interaction technique to change the fill- and line-color of objects is as follows:
S1: move cursor to obj ∈ WO
selects S1 = {(obj, att, c) | att ∈ {fill, line}, c ∈ color } ∪
{(obj, destroy)}, i.e. tuples that modify or destroy obj.
V1: left click validates S1
S2: move cursor to tool ∈ {Fill, Line}
selects S2 = {(obj, tool, c) ∈ S1 | c ∈ color }, i.e. tuples
that apply a fill or line color to obj.
V2: left click validates S2
S3: move cursor to tool.pcol, col∈ color
selects S3 = { (obj, tool, col) ∈ S2 }, i.e. the single tuple
that applies color col to the fill or line style of obj.
V3: left click validates S3 and executes it.
The process of reducing the set of all possible tuples to a single one can also be seen as a progressive instantiation of a tuple: starting from a void tuple, each selection/validation assigns a value to an element of the tuple: (*, *, *) become (obj, *, *), then (obj, tool, *) and finally (obj, tool, col). CIS uses this constructive approach to describe interaction techniques.
Describing an interaction technique
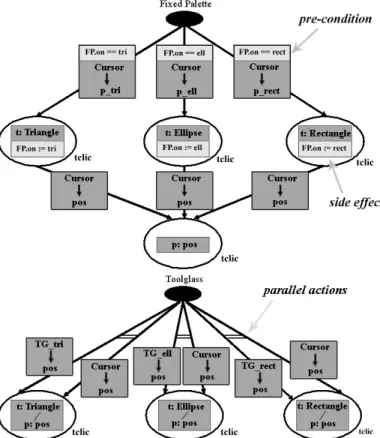
CIS describes a technique with an oriented graph, called the
name. Each arc is a selection action, labelled by the object being moved and its target. Each node (except the root) is a validation action, labelled by the element(s) of the tuple it instantiates and the duration of the physical action. Nodes can have side effects that describe the change of state of the interface other than the partial instantiation of the tuple. For example, selecting a tool in a palette activates this tool for future actions. Arcs can have preconditions; when true, the selection and validation actions are skipped. For example, once a tool is selected in a palette, it can be reused without selecting it again. Figure 2 shows the interaction graphs of unimanual fixed palettes and toolglasses.
The sequence graph describes the overall interface. It is constructed by merging together the roots of all the interaction graphs and adding arcs from each leaf to the new root. An interaction sequence is a sequence of tuples that can be instantiated by a path starting and ending at the root of the sequence graph. It is a set of valid interactions.
Descriptive power: properties of interaction techniques
Interaction graphs can describe a large variety of interaction techniques. We have found the following set of criteria both easy to apply and it is useful to compare them qualitatively:
• Order and Parallelism
An interaction technique imposes a sequential and/or parallel organization of its constituent actions, visualized by the shape of the interaction graph and the use of the parallel construct. For example, a toolglass is highly parallel while a traditional palette is highly sequential.
• Persistance
Interaction techniques may have side effects such as setting attributes of tool objects. These side effect may affect how the interaction technique is used the next time, as described by the pre-conditions in the interaction graphs. For example, the tool selected when using a traditional palette is persistent, so, for example, creating two rectangles in a row only requires selecting the rectangle tool once. Toolglasses on the other hand, do not have such persistance.
• Fusion
Some tools can instantiate multiple tuples at once. For example, many drawing tools allow selection of several shapes by pressing the SHIFT key and modifying them all at once. Other tools use integrality principles [11] to manipulate multiple attributes of an object at once, such as the style and thickness of lines in a drawing editor.
• Development
Some interfaces allow the user to create several copies of a tool with different values for its attributes. For example, in HabilisDraw [1], multiple ink wells can be used to color objects. This is more efficient than using a single color tool and changing its color, but uses more screen real estate.
Figure 2: interaction graphs of Fixed Palette and Toolglass
Predictive power: the complexity measure
In order to measure the efficiency of an interaction technique, we introduce a measure of complexity, inspired by the measure of complexity used in evaluating algorithms. We define a problem to be solved as a state to be reached using an interaction sequence. The size of the problem is the length of the sequence. The actions are the selection and validation actions used in an interaction sequence that solves the problem, i.e. that instantiates the tuples in the sequence. The complexity of an interaction technique for the given sequence measures the cost of the actions relative to the size of the problem when using this interaction technique. We use two measures: the number of actions to solve the problem and the execution time of these actions. Figure 3 shows how several interaction sequences can solve the same problem, i.e. reach the same state. As with algorithms, we can explore the best- and worst-case complexities, i.e. the interaction sequences that solve the problem with the lowest and highest measures.
We have developed an application, SimCIS, that simulates the use of an interaction technique and predicts its complexity. It takes as input :
• the initial state of the interface, Sinit.
• the interaction graph of a technique, IGtech.
• the interaction sequence, Seq.
SimCIS constructs the sequence graph, computes the path P that instantiates the sequence of tuples Seq and evaluates the action and time complexity (Figure 4).
Figure 3: Two sequences leading to the same state
Figure 4: the CIS Model
Sequence (size = 12) S1 S2 Time 13 056 7 015 Number of actions 44 30
Figure 5: OMD and palette complexity for S1 (left) & S2 (right)
Action complexity is computed as the number of nodes and the number of arcs in the path P. When a pre-condition is true, the corresponding arc and end node are not counted. Time complexity is computed by summing the time taken by each arc and node in P. The time taken by an arc is the sum of the time taken to choose that arc at the parent node and the time taken by the pointing action. The former is estimated by Hick's law [10]: k log2(1+n) for n arcs; the
latter is estimated by Fitts’ law [7]: a + b log2(1+D/W) for a target of size W at distance D. The time taken by a node is the constant time that labels the node. When the pre-condition of an arc is true, the time of the arc and its end node are ignored.
SimCIS also generates a diagram illustrating the different object movements for the sequence, called the Object Movement Diagram (OMD). The vertical axis represents time (downward) while the horizontal axis approximates the distances between objects. Movable objects and positions of interest are represented by vertical lines, static objects by double vertical lines. When objects are linked together, such as the tools of a palette, they are linked by a double horizontal line. Object movements are depicted by diagonal lines. When two objects move together, such as
the cursor and a dragged object, the two lines are linked by a simple horizontal bar. Figure 5 shows the OMD for the sequences in figure 3 and the fixed unimanual palette. Sequence S1 is more complex than S2 for this interaction
technique. The diagrams clearly illustrate why: S1 requires
many round trips to the palette while S2 does not.
TESTING THE MODEL
In order to achieve a goal, defined as a desired state of the interface, users can choose among multiple interaction techniques and interaction sequences. This choice is informed by the state of the interface, their knowledge of the available interaction techniques, and the amount they can plan their actions. Some tasks, such as copying, allow users to plan long in advance while others, such as problem solving, are more incremental [16]. We define interaction
context as the combination of the current state of the
interface and the amount users can plan. The former depends on the user's past actions while the latter depends on the task at hand and the next identified goal to be reached. We assumethat the choice of interaction sequence is driven by the perceived efficiency of each possible path: once they know what they want to do, users try to do it as fast as possible based on their knowledge of the interface. We next use CIS to predict the complexity of three interaction techniques and submit these predictions to a controlled experiment. The techniques are: Fixed Unimanual Palette (FP), Toolglass (TG), and Fixed Bimanual Palette (BP). BP, implemented in the CPN2000 interface [2], uses two hands and two cursors. Each hand controls one cursor: the non-dominant hand is typically used to select tools in the palette while the dominant hand selects work objects. We chose these techniques because of their physical similarity but different profiles when analyzed using parallelism and persistance criteria (Table 1).
FP BP TG Persistance Yes Yes No Parallelism No Yes Yes
Table 1: characteristics of the three techniques
We used SimCIS to compare these techniques on a variety of sequences. We report here the results for sequences S1
and S2 (fig. 3). S1 minimizes distances between work
objects, while S2 minimizes the number of tool switches.
These sequences operationalize to some extent the problem solving and copy contexts defined by Mackay [16]: in problem solving, users tend to create objects according to their thought process and exhibit more locality, i.e. create objects of different types that are close together (as in S1);
In a copy context, users can plan ahead more and tend to create objects of the same type together to minimize tool switches (as in S2).
Figure 6 summarizes the predictions computed by SimCIS: FP is highly sensitive to context for both time and action complexity; BP has the same action complexity as FP but time complexity is much less sensitive to context; TG shows no sensitivity to context in action complexity, and
(Ellipse, (300, 100)) (Triangle, (400, 100)) (Rectangle, (500, 100)) (Triangle, (300, 400)) (Rectangle, (300, 300)) (Ellipse, (700, 100)) (Triangle, (600, 100)) (Triangle, (600, 200)) (Rectangle, (500, 300)) (Ellipse, (300, 500)) (Triangle, (400, 400)) (Triangle, (300, 200)) S1 S2 (Ellipse, (300, 100)) (Ellipse, (700, 100)) (Ellipse, (300, 500)) (Rectangle, (500, 100)) (Rectangle, (500, 300)) (Rectangle, (300, 300)) (Triangle, (400, 100)) (Triangle, (600, 100)) (Triangle, (600, 200)) (Triangle, (400, 400)) (Triangle, (300, 400)) (Triangle, (300, 200)) Problem size = 12
very little in time complexity. FP and BP are more efficient for S2 while TG is more efficient on S1. Finally, SimCIS
predicts that BP is more efficient in time than both FP and TG. We observed the same patterns when testing the techniques on other sequences. These results are interesting because they confirm some of the experimental results reported in earlier work but challenge others (see below).
0 2000 4000 6000 8000 10000 12000 14000 FP BP TG Technique ti me (i n ms ) S1 S2 0 10 20 30 40 50 FP BP TG Technique N umb er of ac ti on s S1 S2
Figure 6: comparing the complexity measures EXPERIMENT
In order to test the validity of these predictions and of our hypothesis that users tend to optimize for time when given a task, we ran a controlled experiment comparing the three interaction techniques on different sequences.
Task
A set of shapes (green squares, blue triangles and red circles) was displayed. A trial consisted of deleting all the shapes, one after the other, as fast as possible. Each interaction technique contained three tools that matched the three shape types. To delete a shape, the subject applied the tool with the shape's type onto that shape.
Experimental factors
We used a 3x2x2x3 within-subject design. Factors were: • Technique: FP, TG, BP
• Length: 6, 18 • Grouping: G, D • Order: R, S, F
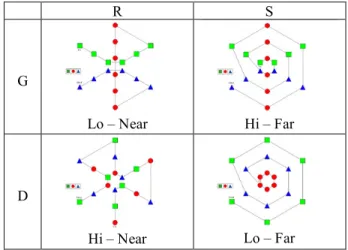
We included two interaction sequence lengths to test the effect of ability to plan the action sequence. Table 2 shows the four different screen layouts associated with Grouping and Order. In all cases, shapes are organized radially along 3 lines of 2 shapes (length=6) or 6 lines of length 3 (length=18). When shapes are grouped (G), all the shapes along a line have the same type. When they are distributed (D), all the shapes along a line are different. This factor was used in combination with order (below) to operationalize the context of use.
We imposed the order in which subjects had to delete the shapes for the R and S trials, so as to test the validity of the predictions computed by SimCIS. The order was free in F trials, to test the hypothesis that subjects minimize execution time. For imposed-order conditions, subjects were asked to follow a black line showing the required deletion sequence. In the radial imposed order (R), shapes had to be deleted along each line; in the spiral imposed order (S), shapes had to be deleted along a spiral.
The combination of grouping (G, D) and imposed order (R, S) defines four types of interaction sequences, classified as having a low or high number of tool switches ('Lo' and 'Hi'), and a short or long distance between successive objects ('Near' and 'Far') (Table 3). These factors correspond to a typical trade-off when planning a task: is it more efficient to optimize for distance between work objects at the expense of more tool switches, or to optimize for tool switches at the expense of a longer distance between work objects.
R S
G
Lo – Near Hi – Far
D
Hi – Near Lo – Far
Table 2: the four types of interaction sequences
Predictions
Table 4 shows the time complexity predictions for these sequences as computed by SimCIS. We extract four predictions from this data:
• (P1) FP and BP are highly sensitive to the number of context switches ('Lo' vs. 'Hi').
• (P2) BP is as fast or faster than the other two techniques. • (P3) Techniques are sensitive to object distance (‘Near’
vs. ‘Far’).
• (P4) A longer sequence length exacerbates the difference between the worst and best cases.
Although this task seems similar to the connect-the-dots task [14], it has one important difference: the whole task is displayed at once rather than being revealed successively, allowing the subject to plan ahead and decide the order to do the task. In the free condition (F), we expect subjects to optimize for time, i.e., given a technique T, to plan their interactions in a sequence that is favourable to T (PFree).
Subjects
Twelve adult volunteers, 10 males and two females, all right-handed, signed up for 45 minutes time slots. Ages ranged from 20 to 56 (mean=29.41, sd=9.73).
Apparatus
The training room contained one HP workstation XW4000 running Windows XP Professional, equipped with two WACOM tablets with one puck each for two-handed input. The right tablet was 145x125mm, the left was 456x361mm. The program was written in Java and ICON [6].
Procedure
The experiment consisted of 36 conditions grouped in three blocks, one block per technique. Each block consisted of
three sub-blocks: a training sub-block to get familiar with the technique, a block with free (F) trials, and a block with imposed order (R and S) trials. The training sub-block was always first. The order of sub-blocks and non-training sub-blocks within a block were counterbalanced across subjects using a 3x2 Latin square. The order of trials in a sub-block was counterbalanced within subjects. Each subject completed a total of 108 non-training trials (36 trials per technique, i.e. 3 repeated measures).
In the training sub-block, the subject had to delete shapes appearing one by one in the main window and clicked a button when they felt familiar with the technique. The next shape was always displayed at the top-right corner. At the end of the experiment, each subject filled out a survey. They were asked if they had previous knowledge of each technique, whether they had a preferred a technique during the experiment and the cases in which each technique was preferred. They were also shown four free-order trials and asked to rank their preferred techniques to complete them.
RESULTS
Data was recorded at the trial level: time between first click and disappearance of the last shape, number of switches, and number of errors. Tukey HSD test is used for pairwise comparisons. Unless otherwise specified, data for the Length condition (6 or 18) is analyzed separately.
Non-significant effects
Subjects made more errors with TG (length=6: 1.06; length=18: 2.49) and BP (length=6: 0.84; length=18: 2.62) than with FP (length=6: 0.68; length=18: 2.17). This is probably due to lack of experience: no subject had ever used either the TG or BP. Despite these differences, the technique had no significant effect on number of errors (length=6: F2, 33 = 1.42, p = 0.25; length=18: F2, 33 = 0.58, p
= 0.56). This means that differences between techniques cannot be explained by the number of errors, which is important since SimCIS does not take errors into account. Presentation order of the three techniques had no significant effect on execution time (length=6: F2, 33 = 0.47, p = 0.63;
length=18: F2, 33 = 0.58, p = 0.94).
Comparisons between empirical data and CIS predictions
Calculations here are based on the data for trials in which order was imposed (R and S). Technique had a significant effect on execution time (F2, 33 = 8.67, p = 0.0009). Only
pairs (BP, FP) and (BP, TG) are significantly different (Table 3), so BP < TG ≈ FP. As predicted by CIS, BP is
more efficient than TG and FP (P2).
TG BP FP
length=6 7972 7134 8812
length=18 23142 18903 23100
Table 3: Mean execution times (ms)
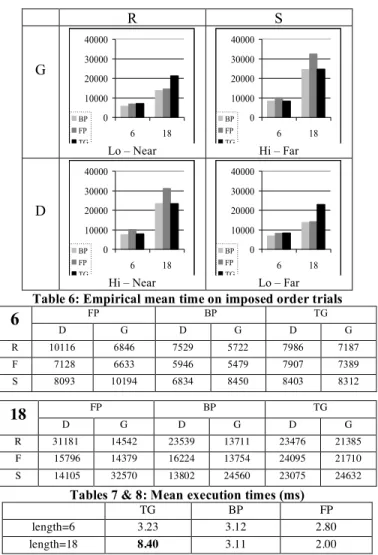
R S G 0 10000 20000 30000 40000 6 18 BP FP TG Lo – Near 0 10000 20000 30000 40000 6 18 BP FP TG Hi – Far D 0 10000 20000 30000 40000 6 18 BP FP TG Hi – Near 0 10000 20000 30000 40000 6 18 BP FP TG Lo – Far
Table 4: Complexity in time on imposed order trials
Compare the empirical observations for Order×Grouping (Table 6) to the SimCIS predictions (Table 4). Order interacts significantly with grouping on execution time for both palettes (length=6: F2, 132 = 9.63, p = 0.0001;
length=18: F2, 132 = 105.13, p < 0.0001).
As predicted, palettes are faster in conditions S×D and R×G (‘Lo’) than in conditions S×G and R×D (‘Hi’). Also,
BP is less context sensitive than FP (Table 5): differences
between minimal mean time and maximal mean time are significantly larger for FP than for BP (P1). Finally, for each technique, mean execution time is shorter in
conditions ‘Lo’בNear’ and ‘Hi’בNear’ than in ‘Lo’בFar’ and ‘Hi’בFar’ respectively, except for FP
between Lo×Near and Lo×Far when length=18 but SimCIS also predicts this exception, however differences do not reach significance (P3).
Differences between techniques are larger for length=18 trials than for length=6 trials (Table 5). On length=18 trials, pairs (S×G, R×D) and (R×G, R×D) (pairs (‘Hi’, ‘Hi’) and (‘Lo, ‘Lo’)) are not significantly different while pairs (‘Hi’,‘Lo’) are all significantly different for both FP and BP. On length=6 trials, differences are smaller: for BP, only pairs (S×G, R×G) are significantly different (P4).
Users optimize for execution time
The combination of imposed order and grouping was designed so that, for each technique, one was close to the optimal time. Subjects approach or even beat this time (Tables 7 & 8) when they are asked to delete all shapes as fast as possible in the free condition. Analyses of the effect of technique on number of tool switches is not significant for length=6 trials (F2, 33 = 2.67, p = 0.0836) but is on
length=18 trials (F2, 33 = 64.56, p < 0.0001, pairs (TG, BP)
and (TG, FP) are significantly different).
FP BP
length=6 3 347 2 727 length=18 18 469 10 849
Table 5: Differences between minimal mean execution time and maximal mean execution time for palettes
R S G 0 10000 20000 30000 40000 6 18 BP FP TG Lo – Near 0 10000 20000 30000 40000 6 18 BP FP TG Hi – Far D 0 10000 20000 30000 40000 6 18 BP FP TG Hi – Near 0 10000 20000 30000 40000 6 18 BP FP TG Lo – Far
Table 6: Empirical mean time on imposed order trials
FP BP TG
6
D G D G D G R 10116 6846 7529 5722 7986 7187 F 7128 6633 5946 5479 7907 7389 S 8093 10194 6834 8450 8403 8312 FP BP TG18
D G D G D G R 31181 14542 23539 13711 23476 21385 F 15796 14379 16224 13754 24095 21710 S 14105 32570 13802 24560 23075 24632Tables 7 & 8: Mean execution times (ms)
TG BP FP
length=6 3.23 3.12 2.80
length=18 8.40 3.11 2.00
Table 9: Mean number of switches in free order (F) trials
We verified that there was no learning effect when the imposed order trials (R/S) were presented before the free ones (F) (length=6: F1, 22 = 3.82, p = 0.0633; length=18: F1, 22 = 0.28, p = 0.6013). The overhead of having to follow the
black line in imposed-order trials may explain why free trials sometimes beat the best imposed-order trials.
Subjects minimize the number of tool switches when they use a palette (FP or BP) in ‘Lo’ condition, but not when they use TG (Table 9). This shows that subjects understood how each technique was sensitive to the context and optimized its use accordingly.
In the post-hoc survey, only three subjects were able to describe in which trials a technique would be most efficient. One subject always preferred TG, three BP, and five FP, the latter arguing that they were more used to it and that it was one-handed. The answers to the final question contrast with these preferences yet are consistent with the quantitative data: BP always scored better than the other two techniques, FP was better than TG on trials in condition G and TG was slightly better than FP on the 6-length trial in condition D. Altogether, these results show that users are able to optimize their use of an interaction technique and adapt it to the context at hand. Although they are not always able to articulate the properties of interaction techniques, they are
also able to identify the most efficient technique for a given task. This both validates our hypothesis (at least on the techniques we have tested) and opens up new developments for the CIS model and the SimCIS tool.
Differences with previously published results
Kabbash & Buxton (K&B) compared toolglasses to three other palettes, including R-tearoff menus (floating uni-manual palettes) and L-tearoff menus (floating biuni-manual palettes) [14]. We were surprised by the poor performance of K&B's equivalent to BP (TG < FP ≈ BP). This
difference is not due to their use of floating rather than fixed palette, since subjects moved the BP in only 2.9% of trials. Our results place BP on a par with TG (BP ≈ TG <
FP) when we consider trials with 'Hi' tool switches, which
force users to switch tools at each step, as in the connect-the-dot task.
If we consider trials with 'Lo' tool switches, our results show that TG is the worst: BP ≈ FP < TG. This is because
FP becomes more efficient with fewer tool switches. K&B's connect-the-dots task avoided this condition by forcing successive dots to differ in color.
In summary, there is no such thing as a "best" interaction technique. Showing the advantages of a new technique is legitimate, but it is as important to study "worst-case" scenarios, to obtain more generalizable results.
CONCLUSION AND FUTURE WORK
We have presented the CIS model that describes the structure of interaction techniques and predicts the difference between their efficiencies in a given interaction sequence. We used it to predict differences of efficiency between three interaction techniques: fixed palettes (FP), bimanual palettes (BP), and toolglasses (TG). We conducted a controlled experiment to test these predictions: the efficiency of FP and BP is indeed more context-dependant than TG, and BP outperforms both FP and TG. The experiment also showed that subjects take advantage of this sensitivity to optimize execution time.
We intend to develop CIS in several directions. First, we can improve the time complexity predictions by refining the model. For example, the largest difference between figures 7 and 8 are due to toolglasses because we lack a proper model of double pointing. Second, some techniques, such as those using continuous control, must be accounted for. Finally, we plan to extend SimCIS to cover combinations of interaction techniques and automatic identification of best- and worse-cases. This is challenging due to the combin-atorial explosion of the number of sequences to explore. CIS is not intended to replace empirical evaluation but rather acts as a tool to help test multiple alternatives and design experiments. It can help explain the sensitivity of interaction techniques to context and identify best- and worse-case scenarios. We argue that, in order to be generalisable, experimental comparisons of interaction techniques should include the concept of context sensitivity.
REFERENCES
[1] Amant, R. St. & Horton, T. E. (2002). Caracterizing Tool Use in an Interactive Environment. Int. Symp. On Smart
Graphics, p. 86-93
[2] Beaudouin-Lafon, M. & Mackay, W.E. CPN2000: A Post-WIMP Graphical Application. (2000). Proc. ACM
Symposium on User Interface Software and Technology
(UIST’00). p. 181-190
[3] Bertelsen, W. O. & Bødker S. (2002). Interaction through Clusters of Artefacts. Proc. European Conference on
Cognitive Ergonomics (ECCE’02).
[4] Bier, E.A., Stone, M.C., Pier, K. & Buxton, W. (1993). Toolglass and Magic Lenses: the See-Through Interface.
Proc. Siggraph, p. 73-80
[5] Card, S.K., Robertson, G. & Mackinlay, J. A. (1991). Morphological Analysis of the Design Space of Input Devices. Proc. ACM Transactions on Information
Systems, 9(2), p. 99-122
[6] Dragicevic, P. & Fekete J. D. (2001). Input Device Selection and Interaction Configuration with ICON. Joint
proc. HCI’01 and IHM’01. p. 543-558
[7] Fitts, P. M. (1954). The Information Capacity of the Human Motor System in Controlling the Amplitude of Movement. Journal of Experimental Psychology, (47), p.381-391
[8] Foley, J. D., Wallace, V. L. & Chan, P. (1984). The Human Factors of Computer Graphics Interaction Techniques.
IEEE Computer Graphics & Applications. p.13-48
[9] Green, T.R.G. (2000). Instructions and Descriptions: some cognitive aspects of programming and similar activities.
Proc. ACM Working Conference on Advanced Visual Interfaces (AVI’00), p. 21-28
[10] Hick, W. E. (1952). On the Rate of Gain of Information.
Quarterly Journal of Experimental Psychology, (4), p.
11-26
[11] Jacob, R., Sibert, L., McFarlane, D. & Preston Mullen, M. (1988). Integrality and Separability of Input Devices.
Proc. ACM Transactions on Computer-Human Interaction. 1(1). p. 3-26
[12] John, B. E. & Kieras, D. E. (1996). The GOMS Family of User Interface Analysis Techniques: Comparison and Contrast. Proc. ACM Transactions on Computer-Human
Interaction. (3), p. 320-351
[13] John, B. E. & Kieras, D. E. (1996). Using GOMS for User Interface Design and Evaluation: Which Technique ?
Proc. ACM Transactions on Computer-Human Interaction. 3(4), p. 287-319
[14] Kabbash, P., Buxton, B. & Sellen, A. (1994). Two-handed Input in a Compound task. Proc. ACM Human
Factors in Computing Systems (CHI’94), p. 417-423
[15] Kurtenbach, G., & Buxton, W. (1993). The Limits Of Expert Performance Using Hierarchic Marking Menus.
Proc. ACM INTERCHI '93. p. 482-487.
[16] Mackay, W.E. (2002). Which Interaction Technique Works When? Floating Palettes, Marking Menus and Toolglasses support different task strategies. Proc. ACM
Working Conference on Advanced Visual Interfaces