HAL Id: cea-02431798
https://hal-cea.archives-ouvertes.fr/cea-02431798
Submitted on 8 Jan 2020HAL is a multi-disciplinary open access archive for the deposit and dissemination of sci-entific research documents, whether they are pub-lished or not. The documents may come from teaching and research institutions in France or abroad, or from public or private research centers.
L’archive ouverte pluridisciplinaire HAL, est destinée au dépôt et à la diffusion de documents scientifiques de niveau recherche, publiés ou non, émanant des établissements d’enseignement et de recherche français ou étrangers, des laboratoires publics ou privés.
A comprehensive numerical modelling of a fission
chamber to be operated over a wide dynamics in the
vessel of a sodium-cooled reactor
P. Filliatre, C. Jammes
To cite this version:
P. Filliatre, C. Jammes. A comprehensive numerical modelling of a fission chamber to be operated over a wide dynamics in the vessel of a sodium-cooled reactor. PHYSOR 2016 - Unifying Theory and Experiments in the 21th Century, May 2016, Sun Valley, United States. �cea-02431798�
A COMPREHENSIVE NUMERICAL MODELLING OF A FISSION
CHAMBER TO BE OPERATED OVER A WIDE DYNAMICS IN THE
VESSEL OF A SODIUM-COOLED REACTOR
P. Filliatre and C. Jammes
CEA, DEN, DER, Instrumentation Sensors and Dosimetry Laboratory Cadarache, F-13108 St-Paul-lez-Durance, France
philippe.filliatre@cea.fr
ABSTRACT
Fission chambers are the detector of choice for online, in-vessel neutron flux measurements. One of their interesting features is their ability to be operated in different modes, depending on their counting rate. This open the possibility, provided that the acquisition chain is accordingly designed and that the chamber specifications are wisely chosen, to monitor the neutron flux over a wide dynamics of reactor power with the same detector.
This paper studies the case of a fission chamber alongside with a preliminary design of the foreseen ASTRID demonstrator. The quantities of interest, namely the fission rate, saturation curve, mean current, pulse shape, spectral density, are computed with a combined usage of the various modelling tools our team has developed within a decade. It is shown that the fission chamber can deliver a signal that is easy to interpret over seven decades of reactor power.
Key Words: Simulation; Instrumentation; Fission chambers
1. INTRODUCTION
Sodium-cooled fast neutron reactors (SFR) have been selected by the Generation IV International Fo-rum, thanks to their double capability of reducing nuclear waste and saving nuclear energy resources by burning actinides [1]. For a proper monitoring of the reactor in routine operations, and to ensure that any abnormal situation is detected quickly enough, a special attention is to be paid to the in-vessel instrumentation, which is to be designed right from the beginning of the reactor design.
Fission chambers are widely used for neutron flux measurements. Those detectors may experience a wide range of constraints, of several magnitudes, in term of neutron flux, γ-ray flux, temperature. Hence, designing a specific fission chamber and measuring chain for a given application is a demand-ing task, that can be achieved by a combination of experimental feedback and simulatdemand-ing tools, the latter being based on a comprehensive understanding of the underlying physics. A very attractive property of fission chambers is the possibility to operate them in three modes, namely the pulse mode (in which individual pulses are counted), current mode (in which the mean current is considered) and fluctuation
mode (in which the quantity of interest is the variance of the current). The mean current and the vari-ance are proportional to the count rate according to Campbell theorems. Both current and fluctuation modes are used when count rates are so high that individual pulses cannot be individuated. Provided that the acquisition chain is accordingly designed and that the chamber specifications are wisely cho-sen, this allows the chamber to deliver a signal that is easy to interpret over seven or so decades of reactor power.
In this paper, we examine as a working example a fission chamber, alongside with a preliminary design of the foreseen ASTRID demonstrator [2,3]. A numerical modelling of the signal is performed by using the various tools our team has developed within a long lasting effort in joining theoretical, modelling and experimental studies to improve design, signal analysis and diagnosis of FC in mock-up, industrial and material testing reactors, e.g. [4–11]. The paper is organized as follows: we give the input data (Sec.2), we compute the signals in all modes (Sec.3). Then the possibility to cover seven decades of reactor power is examined (Sec.4). Then we conclude (Sec.5).
2. INPUT DATA
2.1. Neutron flux
We consider the ASTRID core in its so-called CFV configuration [12–14], assumed to be at equilibrium and nominal power. In the rest of the paper, two locations are considered to put the detectors, both of them being inside the reactor vessel: above the core and below the core, referred as BCC and P respectively. The neutron flux at these locations is computed to be 1.1×10¹⁰n/cm2/s(BCC) and 1.9×
109n/cm2/s(P). The neutron flux is assumed to be spatially constant over the detector volume. The spectrum is essentially fast, however the degradation by sodium absorption is slightly more pronounced for P than for BCC.
2.2. The fission chamber
The fission chambers studied in this article have been designed by PHOTONIS to work at 600◦C,
hence their generic acronym CFHT. They have a cylindrical body with a diameter of 48 mm enclosing two pairs of electrodes, all coated over a sensitive length of 211 mm. The width of the inter-electrode gap can be either 1.5 mm (the label will be CFHT1.5 in this paper) or 1.0 mm (CFHT1.0). The fissile material is uranium 235 (U235) at 92% purity, under the form of U3O8 with a density of 8.38 g/cm3.
The surface mass is about 1.1 mg/cm2 (with a small difference between CFHT1.5 and CFHT1.0) so
that we have exactly for both chamber types 1 g of the isotope235U. The electrodes and the body are
made of stainless steel (316L) of density 8.0 g/cm3. The insulating material is alumina (Al
2O3) of
3. CHAMBER SIGNAL
3.1. Fission rate within the fissile deposit
A tool that computes the fission rate and the evolution of the isotopic composition of the fissile deposit under a given neutron flux and spectrum has been developed by our team and described in details in [4,5]. It relies on the DARWIN suite [15] that solves the Bateman equations.
The fission rate within a deposit of 1 g of U235 (purity 92%) has been computed for the locations BCC and P using the JEFF3.1 library [16], validated for the SFR [17]. It is 4.2 × 10⁸s−1 for BCC,
1.5 × 10⁸s−1for P. The evolution of this fission rate, taking into account the isotopic evolution of the
deposit, is negligible (about 10−5for 15 years at nominal power).
It has been checked by a neutron transport calculation that the self-protection, i.e. the fact that fissile layer is protected from the incoming neutron flux by itself and the surrounding structures of the cham-ber, is negligible. The issue of self-absorption (i.e. the fission products loose a part or their energy within the fissile coating) has been dealt in another work of our team [18]. With a surface mass of the coating of 1.1 mg/cm2, 9% of the fission products are stopped within the deposit, so that increasing
the fissile mass while keeping the geometry would not increase the sensitivity in a linear way. From the time being, this effect is not taken into account in Sec.3, in which the fission rate and the count rate are assumed to be identical.
3.2. Modelling of the signal
The modelling of the interactions of the fission products with the filling gas of the fission chambers, and the collection of the created electron-ion pairs, has lead our team to develop the CHESTER suite, described in details in [9]. This suite use the GARFIELD suite of CERN [19] and several of our previous works [7,20]. It received a partial experimental validation at reactor BR2 of SCK•CEN [21]. The output of CHESTER is a catalogue of individual histories of fission events in the fissile layer of the chamber (for a given fission rate), yielding a fission product that ionize the gas, the production of electron-ion pairs, their collection and the induced current. A straightforward post-processing allows to retrieve the quantities of interest.
CHESTER was designed to deal with fission chambers with a single inter-electrode space and only one coated electrode, so for the CFHT we ran CHESTER four times (one per coated electrode, with the corresponding fission rate) and summed the results. This approach is justified because the range of the fission products within the electrodes is computed to be around 10 µm, well below the thickness of the electrodes; and because the probability that a column of electron-ion pairs created by a fission product coming from the anode crosses a column coming from the cathode is estimated to be only 1 × 10⁻⁵
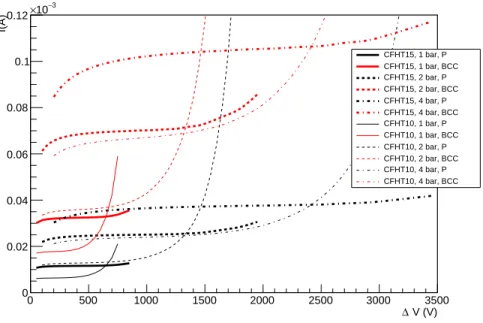
V (V) ∆ 0 500 1000 1500 2000 2500 3000 3500 I(A) 0 0.02 0.04 0.06 0.08 0.1 0.12 3 − 10 × CFHT15, 1 bar, P CFHT15, 1 bar, BCC CFHT15, 2 bar, P CFHT15, 2 bar, BCC CFHT15, 4 bar, P CFHT15, 4 bar, BCC CFHT10, 1 bar, P CFHT10, 1 bar, BCC CFHT10, 2 bar, P CFHT10, 2 bar, BCC CFHT10, 4 bar, P CFHT10, 4 bar, BCC
Figure 1.Saturation curves of CFHT1.5 and CFHT1.0, with pressures of 1, 2 and 4 bar, at BCC and
P locations.
3.3. Saturation Curve
CHESTER is used to compute the density of the creation of electron-ion pairs within the inter-electrode space for a given fission rate. Note that this quantity does not depend on the bias voltage. The density of creation of electron-ion pairs N is then used to compute the saturation curve, i.e. the retrieved mean current as a function of the bias voltage ∆V . For that, we assume that diffusion processes are negligible and that the quantities of interest depend only of the radial coordinate r (both hypotheses have been checked at the end of the process). Then the conservation of the electron and ion densities ne and na
reads (see [23] and references therein): −1 r ∂ ∂rrneve = Tsource,e− Tloss,e −1 r ∂ ∂rrnava = Tsource,a− Tloss,a Tsource,a− Tloss,a = rN + αrneve− krnena (1) in which ve, va, α and k denote the electron and ion velocities, the Townsend first ionization coefficient
(which describes the avalanche process), and the recombination coefficient. The velocities and α are computed by CHESTER as a function of the electric field (so of ∆V ), hence as a function of r, given the usual formula for the electric field Ec(r) = ∆V / (r ln (r2/r1)), where r1 and r2 are the inner and
outer electrodes. Because of the very presence of drifting electrons and ions in the filling gas, the actual electric field departs from that formula, a phenomenon called the space charge effect. However, a first-order evaluation showed that this departure is always below 5% for ∆V > 100 V, and hence can be neglected.
s) µ T ( 0 0.02 0.04 0.06 0.08 0.1 0.12 0.14 0.16 0.18 A) µ I ( 0 0.5 1 1.5 2 2.5 CFHT1.5, 1 bar 450V CFHT1.5, 2 bar 950V CFHT1.5, 4 bar 2000V CFHT1.0, 1 bar 150V CFHT1.0, 2 bar 450V CFHT1.0, 4 bar 900V s) µ T ( 0 5 10 15 20 25 30 35 40 A) µ I ( 0 0.001 0.002 0.003 0.004 0.005 0.006 0.007 0.008 0.009 0.01 CFHT1.5, 1 bar 450V CFHT1.5, 2 bar 950V CFHT1.5, 4 bar 2000V CFHT1.0, 1 bar 150V CFHT1.0, 2 bar 450V CFHT1.0, 4 bar 900V CFHT1.5, 1 bar 450V CFHT1.5, 2 bar 950V CFHT1.5, 4 bar 2000V CFHT1.0, 1 bar 150V CFHT1.0, 2 bar 450V CFHT1.0, 4 bar 900V
Figure 2.Mean electron (left) and ion (right) pulses for the CFHTs.
For k, we make use of the experimental results of [24] about columnar recombination, from which we have k/b = (2.6±0.8)×10−6m2/s: hence we take k = 1.6×10⁻¹¹m3/swith b = 6·10−4m[22]. The
system1is numerically solved. Denoting qe the elementary charge, h the length of the inter-electrode
space, rathe anode radius, the mean current is then:
I = 2πhqerane(ra)ve(ra) (2)
A correction is then applied to account for the columnar recombination [24]. The saturation curves that are obtained for CFHT1.5 and CFHT1.0, with pressures of 1, 2 and 4 bar, are shown on Fig.1. A fission chamber is usually operated with near the saturation point, defined as the inflection point of the saturation curve. It corresponds to the situation in which all the created charges are eventually collected at the electrodes. The saturation point is found to be identical for P and BCC locations. The saturation plateau, within which the bias voltage can vary without a significant change of the mean current, is comfortably large in all cases. For instance, for the CFHT1.5 at 1 bar, the saturation point is given by ∆Vsat = 450 V, but the current differs from I(∆Vsat)by less than 5% for 130 ≤ ∆V ≤ 760.
It is worth noticing that the saturation for the CFHT1.5 at 2 or 4 bar, and for the CFHT1.0 at 4 bar, is not reached before 1000 V: indeed, limiting the pressure to 1 or 2 bar for the CFHT1.5 and CFHT1.0 respectively allows to work around the usual value of 500 V. In the rest of this paper, it is assumed that the chamber is operated at saturation regime.
3.4. Pulse Shape
The mean electron and ion pulses are computed for the CFHT1.5 and CFHT1.0, at 1, 2, and 4 bar, with a bias voltage corresponding to the saturation point of Sec.3.3. They are shown on Fig.2. The shapes are roughly triangular, the rising time (that can be distinguished on electron pulses only) corresponds to the time of flight of the fission products within the gas. In all configurations, the collection time is close to 0.1 µs for the electron pulse, 30 µs for the ion pulse.
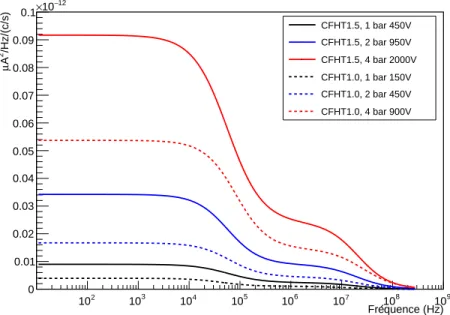
quence (Hz) e Fr 2 10 103 104 5 10 106 107 8 10 109 /Hz/(c/s) 2 A µ 0 0.01 0.02 0.03 0.04 0.05 0.06 0.07 0.08 0.09 0.1 12 − 10 × CFHT1.5, 1 bar 450V CFHT1.5, 2 bar 950V CFHT1.5, 4 bar 2000V CFHT1.0, 1 bar 150V CFHT1.0, 2 bar 450V CFHT1.0, 4 bar 900V
Figure 3.Spectral densities of the CFHTs.
3.5. Mean current
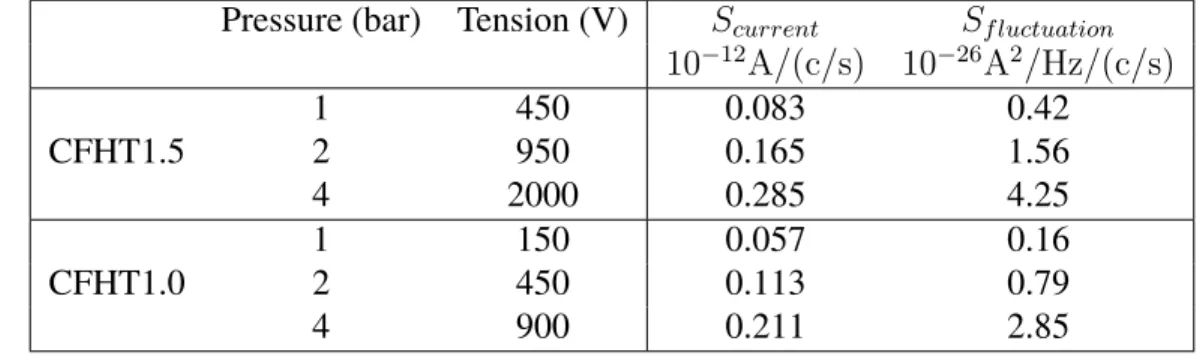
The signal of the chamber as a function of time is simulated by attributing a date to each individual pulse of the CHESTER catalogue, the dates are randomly chosen according to a Poisson process. Then the computation of the mean current is straightforward. The mean current is found to be proportional to the fission rate, at it should be, and agrees well with the current of the saturation point of Sec.3.3. The coefficient of proportionality is the sensitivity of the fission chamber in current mode: it is given on Tab.I.
Dealing with mean current, as it is done when the chamber is operated in current mode, has a major drawback: the γ flux also generates a current that can be of the same order of magnitude as the neutron-induced signal (e.g. [25]), without any way to make a discrimination. The γ flux has been estimated for the BCC location to be 9.8 × 10¹⁰γ/cm2/s. It mostly comes from the activation of the sodium.
The induced current comes mainly from the ionization of the filling gas by electrons generated by the γ-rays that interact with the chamber structures. In a previous paper, we showed how to evaluate this current with a MCNP calculation [8]. It is found that the γ-induced current of the CFHT is about 10% of the neutron-induced current, so that it may be possible to operate the CFHT in current mode as long as precise measurements of the neutron flux are not required.
Table I.Sensitivity in current and fluctuation mode (in the 20 − 300 kHz band) of the CFHTs. The
unit c/s stands for counts per second.
Pressure (bar) Tension (V) Scurrent Sf luctuation
10−12A/(c/s) 10−26A2/Hz/(c/s) CFHT1.5 12 450950 0.0830.165 0.421.56 4 2000 0.285 4.25 CFHT1.0 12 150450 0.0570.113 0.160.79 4 900 0.211 2.85 3.6. Spectral Densities
The spectral density conveys the sensitivity of the chamber in fluctuation mode as a function of the acquisition frequency. It is shown on Fig.3. For a clearer view, we show only a phenomenological fit of the raw results of the simulation (see [9]). Three plateaus, separated by rather smooth transitions, can be observed:
• below 1 × 10⁴Hz, a plateau that corresponds to both electron and ion pulses;
• between 1 × 10⁶Hz and 1 × 10⁷Hz, a plateau that corresponds to the electron pulses;
• for higher frequencies, the spectral density tends towards zero, albeit in practice we would ob-serve the noise of the acquisition chain, not simulated here.
The sensitivity of the CFHTs in the 20 − 300 kHz band is given on Tab.I.
4. MODE OVERLAP
The fission chamber is intended to work over a large dynamics of reactor power. This implies to be able to make it functioning either in pulse or fluctuation mode, with an overlap, over seven decades or so up to nominal power.
Although there is no lower limit to the pulse mode, if the fission rate is too low, the required acquisition time to reach a sufficient signal to noise ratio may be prohibitive. In the fissile layer, the fission events occur according to a Poisson process the intensity is given by the fission rate τ100computed in Sec.3.1,
multiplied by the fraction f of its nominal power the reactor is used. The relative uncertainty on the fission rate (assuming it comes only from the Poisson process) is given by:
in which N is the number of fission events registered during the time interval ∆t. The value of f beyond which δτ is higher than 10% for ∆t = 1 s is 2 × 10⁻⁸for BCC, 7 × 10⁻⁸ for P.
The higher limit of the pulse mode is given by the value of f above which the probability that two individual pulses overlap is considered to be too high for a correct inference of the fission rate. In practice, only electron pulses are considered. The probability that the time interval between two pulses is lower than the collection time Tcoll is given by:
p(t ≤ Tcoll) = 1 − e(−τ100f Tcoll) (4)
If we decide that this probability must be lower than a threshold c, then the limit on f is given by: fmax,pulse=
− ln(1 − c) Tcollτ100
(5) The result is found to depend only loosely on the geometry and pressure, as a consequence of the fact that the collection time is almost constant, as seen on Fig.2. For c = 0.1, we have fmax,pulse = 2 · 10−3
for BCC and fmax,pulse = 6 · 10−3for P.
The assessment of the lower limit of the fluctuation mode, and its overlap with the pulse mode, has been studied in depth in [11]. With a collection time about 0.1 µs, without noise, the relative difference between the estimation of the fission rate with the fluctuation mode and its actual value is kept below 10% for for a fission rate higher than 2 × 10⁶s−1: hence the minimum fraction f of the nominal power
of the reactor to use the fluctuation mode is fmin,f luc = 5 × 10⁻³for BCC and fmin,f luc = 10 × 10−3
for P. The linearity of the response in fluctuation mode also depends on the noise (coming from the electronic devices of the measuring chain). Assuming a white noise, then its standard deviation must be lower than 8% of the signal to keep the error on the estimation of the fission rate below 10%. It is noticeable that fmin,f lucis slightly above fmax,pulse, so that the overlap between the two modes is quite
poor for 10−3 ≤ f ≤ 10−2: the fission rate will be underestimated in pulse mode, overestimated in
fluctuation mode. The problem ca be addressed in two ways (possibly in combination):
• increase the bias voltage (but still within the saturation plateau), as fmax,pulse is proportional
to ∆V and fmin,f luc is inversely proportional to ∆V (in both cases because Tcoll is inversely
proportional to ∆V );
• estimate a correction to apply on the inferred fission rate, by using the techniques devised in [11] which have been used to evaluate fmin,f lucand fmax,pulse: as the overestimation or
underestima-tion is about 10%, such a correcunderestima-tion is achievable.
The higher limit of the fluctuation and current modes depend on the specifications of the measuring chain: the delivered bias voltage must not be affected by the current given by the chamber. As this current is about 100 µA, this constraint is not difficult to achieve.
5. CONCLUSION
In this paper, we have used in combination the various modelling tools that our team has developed since a decade, to predict the signal of fission chambers within the context of a sodium-cooled reactor. It has been shown that the CFHT are able to monitor the neutron flux over a large dynamics of reactor power, encompassing seven decades. Future works will focus on the experimental validation of these results; the questions of the integrity of the CFHT under temperatures well above 600◦C, to cover
accidental situations, and its endurance over many temperature cycles, will be also addressed.
REFERENCES
[1] L. Buiron, B. Fontaine, L. Andriolo, Transmutation abilities of the SFR low void effect core concept CFV 3600 MWth. In: Proceedings of ICAPP 12 - Int. Congress on Advances in Nuclear Power Plants. No. 12029. Chicago, USA
[2] P. Le Coz, J.-F. Sauvage, J.-P. Serpantie, Sodium-cooled Fast Reactors: the ASTRID plant project, In Proceedings of ICAPP 2011 Nice, France, May 2-5, 2011 Paper 11249
[3] F. Gauche, May 2012. Generation IV reactors and the ASTRID prototype: Lessons from the Fukushima accident. Comptes Rendus Physique 13 (4), 365-371
[4] P. Filliatre, L. Oriol, C. Jammes & L. Vermeeren, Reasons why Plutonium 242 is the best fission
chamber deposit to monitor the fast component of a high flux, Nucl. Instrum. Meth. Phys. Res.
A 593 (2008) 510
[5] P. Filliatre, L. Oriol & L. Vermeeren, Joint estimation of the fast an thermal components of
a high neutron flux with a two on-lin detector system, Nucl. Instrum. Meth. Phys. Res. A 603
(2009) 415
[6] P. Filliatre, C. Jammes, B. Geslot, L. Buiron, In vessel neutron instrumentation for
Sodium-cooled fast reactors: type, lifetime and location, Ann. Nucl. Energ. 37 (2010), 1435
[7] C. Jammes et al., Research Activities in Fission Chamber Modeling in Support of the Nuclear
Energy Industry, IEEE Trans. Nuc. Sci. 57 (2010) 3678
[8] P. Filliatre, L. Vermeeren, C. Jammes, B. Geslot, D. Fourmentel, Estimating the γ-ray
contri-bution to the signal of fission chambers with Monte Carlo simulations, Nucl. Instr. and Meth. A,
648 (2011) 228
[9] P. Filliatre, C. Jammes, B. Geslot, R. Veenhof, A Monte Carlo simulation of the fission chambers
neutron-induced pulse shape using the GARFIELD suite, Nucl. Inst. Meth. A, 678 (2012) 139
[10] V. Lamirand et al., Miniature Fission Chambers Calibration in Pulse Mode: Inter laboratory
Comparison at the SCK•CEN BR1 and CEA CALIBAN Reactors, IEEE Trans. Nucl. Sci. 61
[11] Z. Elter, C. Jammes, I. P´aszit, L. P´al, P. Filliatre, Performance investigation of the pulse and
Campbelling modes of a fission chamber using a Poisson pulse train simulation code, Nucl.
Inst. Meth. A, 774 (2015) 60
[12] P. Sciora et al., Low void effect core design applied on 2400 MWth SFR reactor. In Proceedings of ICAPP 2011 Nice, France, May 2-5, 2011 Paper 11048
[13] B. Fontaine, N. Devictor, P. Le Coz , A. Zaetta, D. Verwaerde, J-M. Hamy, The French R&D on SFR core design and ASTRID Project. In: Proceedings of GLOBAL 2011, Makuhari, Japan, Dec. 11-16, 2011. Paper No. 432757
[14] F. Varaine et al. Pre-conceptual design study of astrid core. In: Proceedings of ICAPP 12 - Int. Congress on Advances in Nuclear Power Plants. No. 12173. Chicago, USA
[15] A. Tsilanizara, C. M. Diop et al. DARWIN: an evolution code system for a large range of
appli-cations, J. Nucl. Sci. Technol. 37 (2000) 845
[16] A. Konig et al., The JEFF-3.1 Nuclear Data Library, JEFF Report 21, NEA 06190, ISBN: 92-64-02314-3
[17] J. Tommasi, P. Archier, J.-M. Ruggieri, Validation of the sodium void reactivity effect prediction
using JEFF-3.1 nuclear data, Ann. Nucl. Energ. 37 (2010) 1534
[18] C. Jammes, P. Filliatre, P. Loiseau, B. Geslot, On the impact of the fissile coating on the fission
chamber signal, Nucl. Instrum. Meth. Phys. Res. A 681 (2012) 101
[19] R. Veenhof, GARFIELD, A Drift Chamber Simulation Program, CERN, 1994, CERN program library, entry W5050 http://cern.ch/garfield, Nucl. Instr. and Meth. A 419 (1998) 726
[20] P. Filliatre, C. Jammes & B. Geslot, Stopping power of fission fragments of Cf252 in argon: a
comparison between experiments and simulation with the SRIM code, Nucl. Instr. and Meth. A
618 (2010) 294
[21] B. Geslot et al., New measurement system for on line in core high-energy neutron flux monitoring
in materials testing reactor conditions, Rev. Sci. Ins, 82 (2011) 033504
[22] T. Kanai, M. Sudo, N. Matsufuji & Y. Futami, Initial recombination in a parallel-plate ionization
chamber exposed to heavy ions, Phys. Med. Biol. 43 (1998) 3549
[23] S. Chabod, A. Letourneau, P. Gourdon, & C. Laye, Improvements in the Modeling of
Sub-Miniature Fission Chambers Operated in Current Mode, IEEE Trans. Nucl. Sci. 57 (2010) 2702
[24] P. Filliatre, B. Geslot, C. Jammes & V. Lamirand, Experimental study of columnar
recombina-tion in fission chambers, submitted in Nucl. Inst. Meth. A (2016)
[25] L. Vermeeren et al., Experimental verification of the fission chamber gamma signal suppression