HAL Id: hal-00653353
https://hal.inria.fr/hal-00653353v2
Submitted on 20 Dec 2011
HAL is a multi-disciplinary open access
archive for the deposit and dissemination of
sci-entific research documents, whether they are
pub-lished or not. The documents may come from
teaching and research institutions in France or
abroad, or from public or private research centers.
L’archive ouverte pluridisciplinaire HAL, est
destinée au dépôt et à la diffusion de documents
scientifiques de niveau recherche, publiés ou non,
émanant des établissements d’enseignement et de
recherche français ou étrangers, des laboratoires
publics ou privés.
Image-based 2D numerical modeling of oxide formation
in self-healing CMCs
Virginie Drean, Grégory Perrot, Guillaume Couégnat, Mario Ricchiuto,
Gérard Vignoles
To cite this version:
Virginie Drean, Grégory Perrot, Guillaume Couégnat, Mario Ricchiuto, Gérard Vignoles. Image-based
2D numerical modeling of oxide formation in self-healing CMCs. [Research Report] RR-7845, INRIA.
2011. �hal-00653353v2�
ISSN 0249-6399
a p p o r t
d e r e c h e r c h e
INSTITUT NATIONAL DE RECHERCHE EN INFORMATIQUE ET EN AUTOMATIQUE
N° 7845
December 2011Thème NUM
Image-based 2D numerical modeling of oxide formation
in self-healing CMCs
Centre de recherche Bordeaux - Sud-Ouest 351, Cours de la Libération
Bâtiment A 29 33405 Talence Cedex
Téléphone : +33 5 24 57 40 00— Télécopie : +33 5 24 57 40 25
Image-based 2D numerical modeling of oxide formation
in self-healing CMCs
V. Drean
1, G. Perrot
2, G. Couegnat
2, M. Ricchiuto
1, G.L. Vignoles
2Thème NUM Projet BACCHUS
Rapport de recherche n° 7845 – December 2011 - 10 pages
Abstract: Excellent lifetimes make Self-healing Ceramic-Matrix Composites (CMCs) are
promising candidates for jet engine hot parts. These composites are constituted of a 3D ar-rangement of SiC fiber tows infiltrated by a multilayer matrix. A pyrocarbon interphase acts as a crack deviator, SiC matrix layers bring stiffness, and boron-containing phases are able to pro-duce above 450°C a liquid oxide preventing further oxidation by a diffusion barrier effect. This paper introduces an image-based numerical simulation of the self-healing mechanism under oxygen gas. Existing 0D or 1D models give the time evolution of the oxygen concentration in the weakest fiber and deduce from it a global lifetime through an oxygen-controlled slow crack growth rate law. We propose an approach in which the resolution domain is a 2D FE mesh di-rectly obtained from transverse images of a tow containing the crack. Oxygen diffusion, carbon consumption around the fibers, and conversion of boron carbide into boron oxide are simulated. The model solves mass balances in terms of heights of oxygen (gaseous or dissolved), liquid oxide, pyrocarbon, and boron-containing phase. All the heights are considered perpendicular to the image plane (thin layer approximation), and represent the unit-volume (per square meter) occupied by each phase. Preliminary results on images containing several dozens of fibers and a multilayer matrix are discussed.
Keywords: composite materials, self-healing materials, image based modelling, transversal
crack model, liquid oxide formation, finite element discretization, oxidation mechanism
1 INRIA Bordeaux Sud-ouest, EPI BACCHUS – [email protected], [email protected]
2 LCTS, Lab. for ThermoStructural Composites, University Bordeaux I – [email protected],
INRIA
INRIA Research Report model
V. Drean
3, G. Perrot
4, G. Couegnat
2, M. Ricchiuto
1, G.L. Vignoles
2Thème NUM Projet BACCHUS
Rapport de recherche n° 7845 – Decembre 2011 - 10 pages
Résumé: Une importante durée de vie fait des composites à matrice céramique auto
cicatri-sante (CMCs) les candidats parfaits pour utilisation dans les compocicatri-santes à haute température des moteur aéronautiques du future. Ce type de composites sont constitués par des rangement 3D de fibres de SiC infiltrées par une matrice multicouche. Une interphase de pyrocarbone pro-tège les fibres en déviant la fissure, des couches de SiC dans la matrice la rendent plus rigide, et des phases qui contiennent du bore produisent à 450°C un oxyde liquide qui protège les fibres par un effet de barrière diffusive. Ce papier présente une modélisation numérique de ce phéno-mène de auto cicatrisation en présence d’oxygène. Les modèles 0D et 1D qui existent en littéra-ture donnent une approximation de l’évolution de la concentration d’oxygène en correspon-dance de la fibre la plus faible et permettent d’en déduire une durée de vie globale via un méca-nisme de croissance de la fissure contrôlée par l’oxygène. On propose une approche dans laquelle le domaine de calcul est un maillage éléments finis 2D, obtenu directement par des images de fils fissurés. La diffusion de l’oxygène, l’oxydation du pyrocarbone et la production d’oxyde liquide sont simulés. Le modèle résout des bilans de masse en termes de hauteur d’oxygène, d’oxyde de bore et de pyrocarbone. Ces hauteurs sont considérées comme étant per-pendiculaires à la fissure et représentent le volume unitaire (par unité de surface) occupé par chaque phase. Résultats préliminaires sur des images qui contiennent des dizaines de fibres et une matrice multicouche sont présentés.
Mots clés: matériaux composites, matériaux auto cicatrisants, modélisation par images,
mo-dèles de fissures transverses, formation oxyde liquide, discrétisation éléments finis, mécanismes d’oxydation
3 INRIA Bordeaux Sud-ouest, EPI BACCHUS – [email protected], [email protected]
4 LCTS, Lab. for ThermoStructural Composites, University Bordeaux I – [email protected],
INRIA Research Report model 3
RR n° 7845
1 Introduction
Self-healing Ceramic-Matrix Composites (SH-CMCs) are promising candidate materials for
civil aircraft jet engine hot parts1. Tests in actual conditions of use have been performed,
show-ing excellent lifetimes2. These materials are constituted of a woven/interlocked 3D arrangement
of SiC fiber tows, infiltrated by a multilayer matrix. All the interphase and matrix layers have a specific role. First, there is a pyrocarbon interphase acting as a crack deviator and preventing premature fiber failure while the matrix undergoes multiple cracking, that is, progressive dam-age. Second, SiC matrix layers bring stiffness and are chemically inert at moderate tempera-tures. Finally, boron-containing phases produce above 450°C a liquid oxide which fills cracks
and prevents further oxidation by a diffusion barrier effect3, thus increasing by large amounts
the material lifetime under exposition to high-temperature oxidation4.
The massive production of SH-CMC parts in engines can only be envisaged if there is a suffi-cient confidence in the material lifetime duration. The trouble is that the material can last as long as ten years; hence, a material development cycle based only on experimental characteriza-tion is not feasible. Modeling is mandatory in order to incorporate as much understanding of the material’s physics as possible, and identify and explain the experiments that have been carried out in “accelerated degradation” conditions, or on material parts. The present work has been developed in this frame.
The material lifetime results from a balance between degradation and self-healing5. In the
SH-CMC, the network of matrix cracks brings the oxygen in contact with all the inner material con-stituents; they are transformed gradually into oxides, some of them being gaseous (e.g. carbon), liquid (e.g. boron) or solid (e.g. silica at moderate temperatures). The calculation of the chemi-cal reaction rate everywhere in the material is a key point for lifetime prediction. Past reports have described models which give the time evolution of the oxygen concentration in, say, some key part of the composite (i.e. the weakest, most exposed fiber); they deduce from this quantity a global lifetime because the tensile strength of this fiber can be related to oxygen exposure
through an oxygen-dependent slow crack growth rate law6,7. These models were developed in 0
8,9 or 1 10 space dimensions. In order to gain further insight in the self-healing phenomenon at
fiber and tow scale, we propose now an image-based approach, in which the resolution domain is a 2D FE mesh directly obtained from original mesh generation software. Though the whole history of the material includes liquid phase flow, we will deliberately discard this phenomenon here and focus on the first steps of the material evolution, that is, the formation of the liquid oxide and the plugging of the crack.
The paper is organized as follows. First, we will recall the main physicochemical phenomena that are being accounted for in the model; then, model equations are built, and an analysis of their stiffness is presented. The next part describes the numerical implementation. Finally, some results are presented and discussed.
2 Material structure and physico-chemical processes
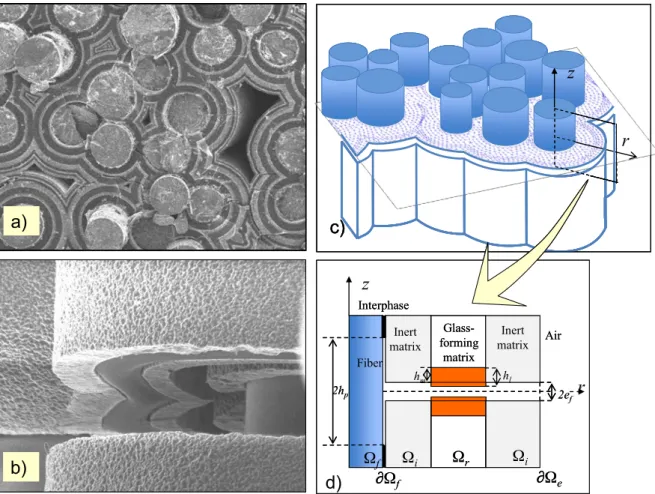
The SH-CMCs we model are depicted on fig. 1a. Several domains are easily recognized: 1. The SiC fibers, which are sensitive to oxidation through a subcritical crack growth behavior. Their diameter is in the range 8-15 µm.
2. The thin pyrocarbon (PyC) interphase coating the fibers. This layer acts a crack de-viator, helping the development of multi-cracking, which gives the material its exceptional
me-chanical behavior11,12. In this work we will consider that cracks are perpendicular to the fiber
and are limited by the fiber boundary. In particular, fig. 1b illustrates the fact that in our model the fibers are bridging the cracks.
3. The multi-layer matrix containing two constituents: silicon carbide, which is nearly inert at the temperatures typical of civil aircraft applications (it begins to oxidize appreciably
4
Drean-Perrot-Couegnat-Ricchiuto-Vignoles
INRIA 4. A number of cusp-shaped pores left by the production process. In particular, the
PyC, SiC and boron carbide layers are deposited by Chemical Vapor Infiltration (CVI)15,16, a
process that gives characteristic continuous layers growing in conformal shape with respect to the initial substrate (i.e. the fibers). The layer thicknesses are larger in the outer parts of the fi-ber bundles or tows, because of the competition between chemical deposition reactions and gas
diffusion17. As a result, some pores remain between the fibers after infiltration. These
imperfec-tions may or may not be connected to the outer gas phase, depending on whether the crack
net-work intercepts them.
Concerning the material evolution, the dominating phenomenon is oxidation. Accordingly, ox-ygen balance is the natural ingredient of the model, as well as balances for all oxidized
materi-als, namely, pyrocarbon -undergoing active oxidation and giving gaseous CO2- and boron
car-bide, yielding a liquid B2O3 oxide together with dissolved CO2. Silicon carbide may also
pro-duce a solid silica layer upon oxidation; however, the temperatures considered here (< 650°C) are not high enough to allow the development of a significant silica thickness. Moreover, here we only address the case in which the boron oxide liquid is viscous enough not to flow signifi-cantly away from the position where it has been created.
Figure 1. a) Structure of a multilayer self-healing ceramic-matrix composite viewed in a transverse direction with respect to fibers b) Crack in the multilayer matrix with a bridg-ing fiber18; c) simulation domain viewed in elevation, d) detail of the simulation domain subsets and of several parameters.
a)
b)
z
r
Fiber Inert matrix Inert matrix Glass-forming matrix Air InterphaseΩ
fΩ
i∂Ω
fΩ
rΩ
i∂Ω
e 2hp 2ef hl hmz
r
c)
d)
a)
a)
b)
z
r
Fiber Inert matrix Inert matrix Glass-forming matrix Air InterphaseΩ
fΩ
i∂Ω
fΩ
rΩ
i∂Ω
e 2hp 2ef hl hmz
r
c)
d)
z
r
Fiber Inert matrix Inert matrix Glass-forming matrix Air InterphaseΩ
fΩ
i∂Ω
fΩ
rΩ
i∂Ω
e 2hp 2ef hl hmz
r
Fiber Inert matrix Inert matrix Glass-forming matrix Air InterphaseΩ
fΩ
i∂Ω
fΩ
rΩ
i∂Ω
e 2hp 2ef hl hm Fiber Inert matrix Inert matrix Glass-forming matrix Air InterphaseΩ
fΩ
i∂Ω
fΩ
rΩ
i∂Ω
e 2hp 2ef hl hmz
r
c)
d)
INRIA Research Report model 5
RR n° 7845
3 Model setup
In order to describe the formation of the protective layer, oxygen diffusion, carbon consumption around the fibers, and conversion of boron carbide into boron oxide are simulated. The under-pinning model consists of mass balances of oxygen (gaseous or dissolved), boron carbide, bo-ron oxide, and pyrocarbon. The liquid oxide obtained as a product is assumed viscous enough not to flow away at least in the initial phase of the healing process simulated here. As a conse-quence, its growth is vertical above the carbide/oxide interface (see fig. 1d). Using a thin layer approximation, the mass balances are written in terms of heights representing the unit-volume (per square meter) of certain face present locally. All the heights are considered perpendicular to the plane of the image, assumed to be the crack plane. In particular, the simulation domain consists of several subsets. As depicted by figs. 1c and 1d we can distinguish the following sub-domains:
- the inert matrix domain (silicon carbide) Wi;
- the reactive matrix domain (boron carbide) Wr;
- the fibers boundary ∂Wf , modeled as an infinitely thin one-dimensional reactive layer
of pyrocarbon ;
- the pore boundaries ∂We, subjected to exposure to external oxygen ;
- the fibers Wf, bridging the crack and, not part of the computational domain.
The chemical balances of the oxidation processes are:
B4C1.6(s) + 4.6 O2(g) à 2 B2O3(l) + 1.6 CO2(g) (1)
C(s) + O2(g) à CO2(g) (2)
Note that the boron carbide in reaction (1) contains excess carbon with respect to the usual
stoi-chiometry B4C, as found in CVD experiments19,10 – we will note it BxC in the following. The
mass balance equations are considered as averaged over the direction perpendicular to the crack. This implies that several heights involved in the problem become variables defined over some part of the resolution domain. They are:
- the height hm of consumed boron carbide, defined only on Wr;
- the height hl of liquid boron oxide, which is larger than hm because of the molar
vol-ume differences (i.e. B2O3 has a larger molar volume than BxC), defined on Wr;
- the height of consumed pyrocarbon hp, existing only on the fiber/matrix interface
∂Wfi (considering that its thickness is so small that it does not need to be meshed).
The balance equations for oxygen, boron carbide and boron oxide involve source terms describ-ing diffusion-limited oxidation reactions. Pyrocarbon oxidation appears as a boundary condition on the fiber surface for the oxygen and pyrocarbon balances. The oxygen mass balance reads:
(
2)
(
2 2)
4
.
6
O2 l r O O g O g tC
k
C
D
h
C
h
+
∇
⋅
−
∇
=
−
Φ
∂
in Wr and Wi (3) 2 2 2 O fi p p O O gD
C
n
k
e
C
h
∇
⋅
=
−
−
on ∂W fi (4)(
)
⎪
⎪
⎩
⎪
⎪
⎨
⎧
=
−
−
−
=
⋅
∇
−
0
2 2 2 2 2 2 2 ext O O ext O O g O ei O OC
C
or
C
C
D
n
C
D
δ
on ∂Wei (5)6
Drean-Perrot-Couegnat-Ricchiuto-Vignoles
INRIA
In eqs. (3-4) we have used the variable hg which is the available height for oxygen gas
diffu-sion, and which is given by hg = ef + Fr(hm-hl), where Fr indicates whether one lies or not in the
reactive phase region. Eq. (5) displays two possible kinds of boundary conditions: either of the von Neumann type (similar to Fourier boundary condition in heat balances), or of the Dirichlet type (fixed assigned concentration). The time variations of the various heights involved in the system are given by the following ODEs:
( )
(
2
2 3)
4
.
6
O2 l O B C B r g tC
k
h
=
Φ
υ
x−
υ
∂
in Wr (6)( )
2 3 26
.
4
2
O l O B r l tC
k
h
=
Φ
υ
∂
in Wr (7)( )
p PyC p O2 th
=
υ
k
C
∂
on ∂W fi (8)The
!h
term represents the possibility of a time variation in the crack opening, due for instanceto variations in mechanical loading. The source terms for pyrocarbon and boron carbide
oxida-tion depend on a reacoxida-tion rate that follows a linear-parabolic law, as in the Deal-Grove model20:
1 2
1
−⎟
⎟
⎠
⎞
⎜
⎜
⎝
⎛
+
=
l O l BxC lD
h
k
k
(9) 1 21
−⎟
⎟
⎠
⎞
⎜
⎜
⎝
⎛
+
=
g O p PyC pD
h
k
k
(10)Though not very necessary on a physical point of view (because kBxC is very large in front of
DO2l/hl), eq. (10) ensures a proper initialization of the numerical resolution. The initial
condi-tions are:
(
0
)
;
;
0
;
1
2 2 2=
=
O=
f l=
p=
g=
ext O Ot
C
h
e
h
h
h
C
(11)The remaining notation is explained in Table 1, where typical values for all coefficients are also reported.
4 Numerical resolution
The resolution domain is obtained from image processing routines. Two options are possible: (i) a routine allows extracting from a micrograph of a transverse slice of a given tow a finite ele-ment mesh, with a proper description of the domains as listed above; (ii) another routine allows extracting from a micrograph information on the fiber size and neighborhood distribution, then synthesizing a random artificial medium with the same fiber properties, and finally creating the multilayer matrix by mesh dilation operations. In this way, it is possible to work either on an actual material, or on a virtual material.
The oxygen diffusion problem (3-5) has been discretized using a standard Galerkin approach on triangular P1 Lagrange finite elements. Time integration of the ODEs (6-8) is performed using an implicit backward differencing and solving the algebraic problem by means of standard Newton-Raphson iterations.
Using dimensional analysis, an estimate of the relative importance of the different phenomena has been carried out, based on the data reported in Table 1. As a result of this analysis, one can the time scale associated to gaseous oxygen diffusion is so small that on the time scale of liquid oxide formation the oxygen diffusion equation (3-5) might be considered as a decoupled steady problem to be used as a starting point to integrate the height evolution equations (6-8). This
INRIA Research Report model 7
RR n° 7845
decoupled approach allows to first solve for the oxygen concentration field with frozen the heights; then, larger time steps are taken for the computation of an increase of the heights, as-suming a steady concentration field. After one time step, thenew values for the heights are used
to obtain a solution of the oxygen diffusion equation. The procedure is carried out until hg
reaches zero on some point of the mesh.
Table 1. Meaning and units of the symbols used in the model.
Symbol Meaning Value Unit
CO2 Oxygen concentration mol.m-3
DO2 Oxygen diffusion coefficient m2.s-1
DO2g Oxygen diffusion coefficient 9.4·10-5 m2.s-1
DO2l Oxygen diffusion coefficient 5.4·10-10 m2.s-1
ef Crack opening 10-6 m
ep Pyrocarbon interphase thickness 10-7 m
hg Available height for gaseous transfer m
hl Liquid phase height m
hm Consumption height of BxC m
hp Consumption height of pyrocarbon m
kPyC Rate constant for PyC consumption 1.7·10-3 m.s-1
kp Effective rate constant for PyC consumption m.s-1
kBxC Rate constant for BxC consumption 1·10-3 m.s-1
kl Effective rate constant for BxC consumption m.s-1
uB2O3 Boron oxide molar volume 4.492 10-5 m3.mol-1
uBxC Boron carbide molar volume 2.314 10-5 m3.mol-1
uPyC Pyrocarbon molar volume 0.7059 10-5 m3.mol-1
d Boundary layer thickness 2 10-4 m
Fr Reactive phase indicator (1 in Wr, 0 elsewhere) -
5 Results
Illustrative results are presented on an SH-CMC tow image containing approximately 50 fibers. The fibers were obtained by scanning and thresholding a transverse micrograph of a CMC; the matrix layers were generated by mesh dilations. The layer sequence is (from fiber to surface)
PyC/SiC/BxC/SiC/BxC/SiC. Symmetry boundary conditions were applied everywhere the
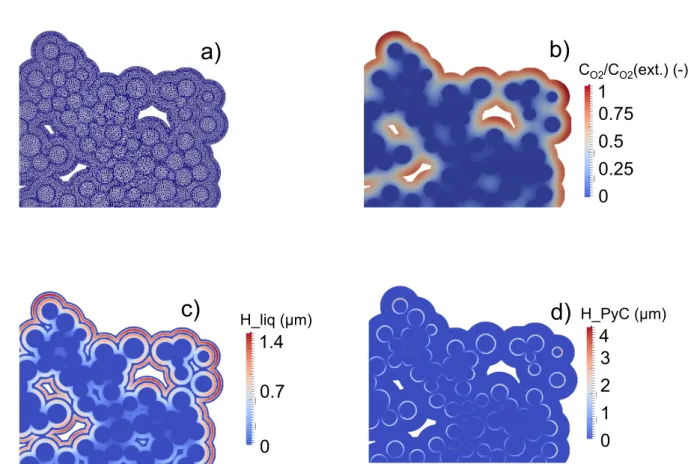
mate-rial was meeting the image border. All pores were considered as equally connected to the exte-rior oxygen source; a Neumann boundary condition was applied. Figure 2 gives shows the nu-merical results when plug formation is starting, at t = 112 s.
8
Drean-Perrot-Couegnat-Ricchiuto-Vignoles
INRIA
Figure 2. Visualization of the numerical results in a base case (see Table 1), at the begin-ning of healing (t = 112 s). a) Computational mesh, b) Scaled oxygen partial pressure field, c) liquid oxide height, d) Consumed pyrocarbon height.
Figure 2b clearly evidences the depletion of oxygen throughout the crack. Indeed, consumption by the glass-forming carbide and by carbon is not balanced by supply of gas by diffusion. So, only the boron carbide layers located close enough to the boundaries have reacted, as seen on fig. 2c. In correlation with this, the consumed pyrocarbon heights are larger for the mesh points lying closer to the borders; a depletion effect is also seen for the points which lie close to a se-cond fiber, as seen in fig. 2d. In fig. 3a are reported the consumed PyC heights as a function of the distance to the closest border, at t = 32s. Evidently, the mesh points lying closest to the sur-face are more oxidized; however one notes a large dispersion of the consumed height values everywhere in the material, as commented before on fig. 2d. To quantify this dispersion, the mesh points lying closest to the border (highlighted in fig. 3a) are studied and their histogram is plotted at figure 3b. The standard deviation is 14% of the average value, a rather appreciable amount.
a)
b)
c)
d)
H_PyC (!m)0
1
2
3
4
H_liq (!m)0
0.7
1.4
CO2/CO2(ext.) (-)0
0.25
0.5
0.75
1
INRIA Research Report model 9
RR n° 7845
Figure 3. Consumed PyC height results at t = 32 s. a) Values at mesh points vs. distance to the closest border. b) Values histogram for the mesh points lying closest to the border.
Two-dimensional effects, such as competition in oxygen consumption between adjacent fibers, can be dramatic, as shown by the histograms of liquid height formation on Figure 3. As we can see, the spreading of the distribution is rather large at the beginning, then further spreads, before arriving at the maximal achievable height. When the surface barrier formation begins, i.e. when a first mesh point reaches the maximal achievable value for the liquid height (here, 1.35 µm), other surface points are still far from this state (minimum around 0.7 µm). Consequently, it takes a rather long time between the beginning and the end of barrier formation. The estimation in the present case is ~ 80 s, i.e. close to the beginning time itself (112 s); however it is certainly an overestimation, that can be corrected when taking into consideration the glass phase flow.
Figure 4. Liquid height histograms at selected time values, for the mesh points lying clos-est to the border.
6 Conclusion and outlook
This work focuses on the modeling of the first moments of the formation of a glassy boron ox-ide protective barrier in an SH-CMC tow. The originality is to carry out modeling in 2D in a crack plane supposed to be transverse with respect to fibers. The results show that it is possible to quantify the gradients of barrier formation throughout the section, and obtain an average and standard deviation of the self-healing behavior.
Future work is aimed to account for the flow of the glass phase and of the diffusion of oxygen through it, in order to describe the “latency” period of the self-healing composite.
0 0.5 1 1.5 2 2.5 3 3.5 0.0 5.0 10.0 15.0 20.0 25.0 30.0 35.0 Distance to closest border
Consumed PyC height (µm) 0 5 10 15 20 25 30 0.5 0.6 0.7 0.8 0.9 1 1.1 1.2 1.3 1.4 1.5 1.6 1.7 1.8 1.9 2 2.1 2.2 2.3 2.4 2.5 2.6 2.7 2.8 2.9 3 3.1 3.2
Consumed PyC height values (µm) Number of mesh
points (-‐)
a)
b)
0 0.5 1 1.5 2 2.5 3 3.5 0.0 5.0 10.0 15.0 20.0 25.0 30.0 35.0 Distance to closest borderConsumed PyC height (µm) 0 5 10 15 20 25 30 0.5 0.6 0.7 0.8 0.9 1 1.1 1.2 1.3 1.4 1.5 1.6 1.7 1.8 1.9 2 2.1 2.2 2.3 2.4 2.5 2.6 2.7 2.8 2.9 3 3.1 3.2
Consumed PyC height values (µm) Number of mesh
points (-‐)
a)
b)
0 100 200 300 400 500 600 700 0 0.2 0.4 0.6 0.8 1 1.2 1.4 1.6 Liquid height (!m) Nu m ber of m esh po in ts (-) t=016 t=036 t=056 t=096 0 100 200 300 400 500 600 700 0 0.2 0.4 0.6 0.8 1 1.2 1.4 1.6 Liquid height (!m) Nu m ber of m esh po in ts (-) t=016 t=036 t=056 t=096 t = 32 s! t = 72 s! t = 112 s! t = 192 s! Max im al ac hi ev abl e l iqui d he ight !10
Drean-Perrot-Couegnat-Ricchiuto-Vignoles
INRIA
Acknowledgements
This work has been funded by GIS “Advanced Materials in Aquitaine” through a post-doc grant to V. D.. The authors also wish to thank Pr. F. Rebillat (LCTS, University Bordeaux) for fruitful discussion on the model.
References
1F. Christin,. Int. J. Appl. Ceram. Technol. 2, 97 (2005).
2J.-C. Cavalier, I. Berdoyes, and E. Bouillon, Adv. Sci. Technol. 50, 153 (2006).
3S. Goujard, J.L. Charvet, J.L. Leluan, F. Abbé, and G. Lamazouade, French Patent N° 95
03606 (1995).
4P. Forio and J. Lamon, Ceramic Transactions 128, 127 (2001).
5L. Quémard, F. Rebillat, A. Guette, H. Tawil and C. Louchet-Pouillerie, J. Eur. Ceram. Soc.,
27-4, 2085 (2007).
6W. Gauthier, J. Lamon and R. Pailler, Rev Compos Matér Avancés 16(2), 221 (2006). (in
French)
7P. Ladevèze and M. Genet, Compos. Sci. Technol., 70, 1575 (2010).
8C. Cluzel, E. Baranger, P. Ladevèze, and A. Mouret, Compos. Part A 40(8), 976 (2009).
9L. Marcin, E. Baranger, P. Ladevèze, M. Genet and L. Baroumes, L., Procs 7th Intl. Conf. on
High Temperature Ceramic Matrix Composites (HT-CMC7), Bayreuth, Germany (2010).
10F. Rebillat, Procs 5th Intl. Conf on High Temperature Ceramic Matrix Composites
(HT-CMC5). Seattle, WA, p. 315 (2005).
11V. Dréan, M. Ricchiuto and G. L. Vignoles, INRIA Reports N°7417 & 7418 (2010)(in
French).
12G. Camus, Intl. J. Sol. Struct. 37(6), 919 (2000).
13F. Lamouroux, G. Camus and J. Thébault, J. Amer. Ceram. Soc. 77(8), 2049 (1994).
14F. Lamouroux and G. Camus, J. Eur. Ceram. Soc., 14(2), 177 (1994).
15R. Naslain and F. Langlais, High Temp. Sci. 27, 221 (1990).
16T. M. Besmann, B. W. Sheldon, R. A. Lowden and D. P. Stinton, Science 253, 1104 (1991).
17G. L. Vignoles, Adv. Sci. Technol. 50, 97 (2006).
18X. Martin, PhD thesis, Bordeaux I University, n°2749, 2003 (in French)
19J.Berjonneau, G.Chollon, F.Langlais. J. Electrochem. Soc. 153(12), C795-C800 (2006)