HAL Id: tel-00553452
https://tel.archives-ouvertes.fr/tel-00553452
Submitted on 7 Jan 2011
HAL is a multi-disciplinary open access archive for the deposit and dissemination of sci-entific research documents, whether they are pub-lished or not. The documents may come from teaching and research institutions in France or abroad, or from public or private research centers.
L’archive ouverte pluridisciplinaire HAL, est destinée au dépôt et à la diffusion de documents scientifiques de niveau recherche, publiés ou non, émanant des établissements d’enseignement et de recherche français ou étrangers, des laboratoires publics ou privés.
Etude de la régulation de la transcription par l’ARN
polymérase III chez Saccharomyces cerevisiae. Rôle des
domaines conservés au cours de l’évolution de la
protéine Maf1, un répresseur de l’ARN polymérase III
Anna Ewa Gajda
To cite this version:
Anna Ewa Gajda. Etude de la régulation de la transcription par l’ARN polymérase III chez Sac-charomyces cerevisiae. Rôle des domaines conservés au cours de l’évolution de la protéine Maf1, un répresseur de l’ARN polymérase III. Sciences du Vivant [q-bio]. Université Paris Sud - Paris XI, 2010. Français. �tel-00553452�
Université Paris-Sud 11 Institute of Biochemistry and Biophysics Ecole Doctorale "Gènes, Génomes, Cellules" Polish Academy of Sciences
91405 Orsay, France Department of Genetics
Pawinskiego 5A 02-106 Warsaw, Poland CEA/Saclay Institut de Biologie et de Technologies de Saclay Service de Biologie Intégrative et Génétique Moléculaire 91191 Gif-sur-Yvette, France
PhD Thesis
Regulation of a gene transcription by RNA Polymerase III
in Saccharomyces cerevisiae. The role of evolutionarily
conserved domains of the Maf1 protein, RNA Polymerase III
repressor.
Etude de la régulation de la transcription par l’ARN
polymérase III chez Saccharomyces cerevisiae. Rôle des
domaines conservées au cours de l’évolution de la protéine
Maf1, un répresseur de l’ARN polymérase III.
Anna Ewa GAJDA
Defended on 9 December 2010, composition of the jury:
Prof. Magdalena BOGUTA Dr hab. Olivier LEFEBVRE Prof. Iwona FIJALKOWSKA
Prof. Zofia SZWEYKOWSKA – KULINSKA Prof. Michel JACQUET
: Thesis Director : Thesis Director : Reviewer
: Reviewer : Reviewer
I am very grateful to Prof. Magdalena Boguta for supervising my work and encouraging me to follow the “cotutelle” PhD studies. I thank her for the patience,
forbearance, kindness and cordial atmosphere.
I also thank all my polish team, especially: Asia Towpik, Iwona Karkusiewicz and Tomek Turowski for their helpfulness, support, for amusing talks and a great time we
spent together.
Je souhaiterais présenter mes remerciements à Monsieur Olivier Lefebvre qui m'a beaucoup aidée dans mes recherches et qui a facilité mon intégration à la vie en France. Monsieur Lefebvre m'a guidée précieusement dans mon travail, il m'a montré
la beauté des recherches scientifiques et a toujours eu confiance en mes capacités intellectuelles. Je le remercie aussi pour le "Résumé substantiel" qu'il a eu la bonté de
rédiger pour moi.
Je remercie Arounie Tavenet pour l'amitié qu'elle m'a offerte, pour nos entretiens et pour le temps que nous avons passé ensemble. Je tiens à exprimer ma gratitude envers Arlette qui a préparé un matériel immense pour mes expériences, se montrant toujours patiente et souriante. Je remercie également Nicolas Caudy pour les disques de musique de cinéma qui m'ont remonté le moral ainsi que Christine Conesa et Joël
Acker pour leurs précieux conseils.
From the bottom of my heart, I thank my best friends: Marta Miller, Justyna Rudzka, Eliza Orzechowska, Paula Belino-Studzińska and Marta Marciniak for being with me
in the most difficult moments.
Dziękuję również mojemu Tacie za wszelką pomoc w rzeczach małych i dużych, bez której nie mogłabym ukończyć tej pracy, jak i Urszuli za zrozumienie, wsparcie,
Summary:
Regulation of a gene transcription by RNA Polymerase III in Saccharomyces
cerevisiae. The role of evolutionary conserved domains of the Maf1 protein,
RNA Polymerase III repressor.
Yeast cell encounters numerous environmental situations that require a rapid and efficient adaptation of the cellular metabolism to changing life conditions. One of the first responses, is the inhibition of RNA polymerase III (Pol III) transcription. The Maf1 protein, the unique negative regulator of the Pol III apparatus in Saccharomyces cerevisiae (Sc), is conserved through evolution. The family of eukaryotic Maf1 share highly conserved amino acid sequence with two easily recognizable regions called A and BC domains. The work performed during this PhD thesis concerns the role of these evolutionary conserved domains in the activity of ScMaf1. I have constructed a library of Maf1, identified and localized the mutations of corresponding Maf1 proteins and studied the phenotype. Using yeast two-hybrid system, I have found the A and BC domains interact physically and defined the minimal 34 aa fragment of the A domain involved in this interaction. Using genetic screen for internal suppressor mutations, I have identified that mutations localized in the BC domain (D250E, V260D-N344I) recovered the activity of Maf1 mutated in the A domain (K35E), as deduced from no defected growth, efficient Pol III repression, phosphorylation and cellular localization of identified suppressors. The identified K35E mutation disrupted physical interaction between Maf1 domains, unless the presence of additional D250E or V260D-N344I suppressor mutations occurred. The Take Home message from the results obtained during my PhD thesis is that: “Full repression of Pol III requires the physical interaction between Maf1 domains”.
Résumé :
Etude de la régulation de la transcription par l’ARN polymérase III chez
Saccharomyces cerevisiae. Rôle des domaines conservés au cours de
l’évolution de la protéine Maf1, un répresseur de l’ARN polymérase III.
Dans l’environnement, la levure doit faire face à des conditions variées qui nécessitent une adaptation rapide du métabolisme cellulaire. Une des premières réponses est l’inhibition de la transcription par l’ARN polymérase III (Pol III). La protéine Maf1, le seul régulateur de la machinerie de la Pol III chez Saccharomyces cerevisiae (Sc), est conservée au cours de l’évolution. Les protéines Maf1 des Eucaryotes contiennent deux domaines A et BC phylogénétiquement conservés. Ce travail de thèse a cherché à identifier le rôle de ces domaines dans la fonction de la protéine ScMaf1. J’ai construit une banque de mutants de Maf1, identifié les changements dans leurs séquences ainsi que leurs phénotypes. En utilisant la technique du double-hybride, j’ai montré que les domaines A et BC interagissent physiquement et que l’extrémité N-terminale de 34 acides aminés du domaine A est le fragment minimal nécessaire à cette interaction. Grâce à un crible génétique, j’ai mis en évidence que les mutations du domaine BC (D250E et V260D-N344I) permettent de restaurer l’activité de Maf1 mutée dans le domaine A (K35E). Cette restauration est observable pour le phénotype, la répression efficace de la transcription par la Pol III, le niveau de phosphorylation et la localisation cellulaire de Maf1. La technique du double-hybride m’a permis aussi de montrer que la mutation K35E inactive partiellement l’interaction entre les domaines de Maf1 qui est restaurée par les mutations suppresseurs D250E et V260D-N344I. Les résultats permettent de conclure que : « la répression de la transcription par la Pol III requiert l’interaction physique des domaines de Maf1
CONTENTS :
ABBREVIATIONS: ... VI
I. INTRODUCTION ... - 1 -
1. Maf1 mediated repression of RNA polymerase III dependent transcription- 3 - 2. Search of evolutionarily conserved domains within the Maf1 sequence .. - 11 -
II. AIM OF THE WORK... - 26 -
III. RESULTS ... - 27 -
1. Construction of S. cerevisiae Maf1 mutated in evolutionarily conserved regions - A and BC domains. ... - 27 -
1.1. Maf1 mutations in the A domain...- 27 -
1.2. Maf1 mutations in the BC domain. ...- 35 -
1.3. Preliminary characterisation of Maf1 mutants. ...- 40 -
1.3.1 Does mutations in the BC domain of Maf1 trigger destabilization of the protein?... 40
-1.3.2 Dephosphorylation of mutated Maf1 in terms of starvation induced by rapamycin... 43
-1.3.3 Analysis of phosphorylation pattern of Maf1 mutated proteins. ... 51
-1.3.4 Cellular localization of Maf1 mutated proteins... 53
-1.4. Summary...- 58 -
2. Full repression of RNA polymerase III transcription requires interaction between two domains of its negative regulator Maf1. ... - 60 -
2.1. Genetic interaction between evolutionarily conserved regions – A and BC domains of S. cerevisiae Maf1. ...- 60 -
2.1.1 Screening for mutations localized in BC domain that suppress single point mutations identified in A domain... 60
-2.1.2. Suppressor mutations in BC domain recover the function of Maf1 mutated in A domain. ... 65
-2.1.3. Summary... 72
-2.2. Physical interaction between evolutionarily conserved regions – A and BC domains of S. cerevisiae Maf1. ...- 72 -
2.2.1 Minimal fragment of A domain of Maf1 involved in interaction with BC domain. ... 75
-2.2.2 The physical interaction between Maf1 domains is required for Pol III repression... 77
-3. Analysis of protein interactions involving evolutionarily conserved regions – A and BC domains of S. cerevisiae Maf1... - 80 -
IV. DISCUSSION ... - 83 -
1. Interaction between A and BC domains is important for the function of Maf1. ... - 83 -
3. Elucidation of Maf1 as a member of intrinsically disordered proteins
family. ... - 89 -
4. Current context of the presented data. ... - 95 -
V. MATERIALS AND METHODS ... - 98 -
VI. SUPPLEMENTAL DATA ... - 114 -
VII. APPENDIXES... - 125 -
1. Publication in press: Gajda et al., 2010... - 125 -
2. Résumé substantiel en Français ... - 126 -
ABBREVIATIONS: A600 : aa: α: BLAST: bp: BSA: β-gal: ca.: ChIP on Chip: CPZ: DAPI: DISOPRED: DNA: DomPred: EDTA: EtBr: Exp.: e.g: Gal4AD: Gal4BD: GST: HA: HCA: HIS: HRP: HU : IP: kb: kDA: LEU / Leu: MMS : NLS : nt: OD: ORF: PCR: Phe: absorbance 600 nm amino acid antibody
Basic Local Alignment Search Tool base pair
bovine serum albumin β-galactosidase
circa
Chromatin Immunoprecipitation analyzed on DNA microarray chlorpromazine
4’,6-diamidino-2-phenylindole Prediction of Protein Disorder deoxyrybonucleic acid
Protein Domain Prediction ethylenediaminetetraacetic acid ethidium bromide
exponential growth phase for example
Gal4 Activating domain Gal4 Binding domain Glutathione S-transferase hemagglutinin
Hydrophobic Cluster Analysis Histidine
Horse radish Peroxidase hydroxyurea
immunopurification / immunoprecipitation kilo base
kilo Dalton Leucine
methyl methane sulfonate nuclear localization sequence nucleotide
optical density open reading frame
polymerase chain reaction Phenyloalanine
Pol I: Pol III: pre-tRNA: PSI-BLAST: PSIPRED: PSORT: Rap.: Rb: RNA SC: SDS: SDS-PAGE: TCA: tDNA: TOR: TORC1: TORC2: tRNA: U6 snRNA: WT: X-gal: Y2H: YPD: YPGly: 2D / 3D: 5S rDNA: 5S rRNA: RNA polymerase I RNA polymerase III premature transfer RNA
Position specific iterative BLAST Protein Structure Prediction
Prediction of protein sorting signals and localization sites Rapamycin
Retinoblastoma protein deoxyribonucleic acid synthetic complete medium sodium dodecyl sulfate
sodium dodecyl sulfate polyacrylamide gel electrophoresis trichloroacetic acid transfer DNA Target of Rapamycin TOR complex 1 TOR complex 2 transfer RNA
U6 small nuclear RNA wild-type
bromo-chloro-indolyl-galactopyranoside yeast-two-hybrid system
yeast extract peptone dextrose yeast extract peptone glycerol 2/3 - dimension
5S ribosomal DNA 5S ribosomal RNA
I.
INTRODUCTION
In eukaryotic cells, RNA polymerases (Pol) I and III are responsible for the synthesis of RNA species involved in ribosome biogenesis and the translation process. RNA synthesis by Pol I and Pol III represents more than 80% of all S. cerevisiae nuclear transcription activity and is controlled in a coordinated way in response to various cellular and environmental conditions (Willis et al., 2004; Warner et al., 2001; Warner, 1999).
Pol III is responsible for the transcription of ~400 genes in S. cerevisiae (class III genes), mostly tRNA genes and 5S rRNA genes (Harismendy et al., 2003; Roberts et al., 2003; Moqtaderi et al., 2004). Analyses of the Pol III transcription system in S. cerevisiae have revealed a series of protein-DNA and protein-protein interactions leading to the recruitment of Pol III to its target tRNA genes: binding of the six-subunit TFIIIC factor to the intragenic promoter, TFIIIC-directed recruitment and assembly of the three components of TFIIIB (TBP, Brf1 and Bdp1), and subsequent recruitment of the seventeen-subunit Pol III enzyme (Geiduschek and Kassavetis, 2001) (Fig. 1).
The Pol III machinery is remarkably conserved between yeast and human cells. The most conserved components are those involved in assembly of the transcription complex: the τ131 subunit of TFIIIC and two components of TFIIIB (TBP, Brf1). The five Pol III-specific subunits in S. cerevisiae (C31, C34, C37, C53 and C82, Fig. 2) all have structural and functional homologs in human cells (Schramm and
Figure 1. Assembly of the transcription complex on S. cerevisiae tRNA gene. The scheme depicts the multistep pathway of transcription complex formation: (1, 2) promoter recognition by TFIIIC, (3) TFIIIC-directed assembly of the initiation factor TFIIIB, (4) recruitment of Pol III and (5) termination of transcription. Adapted from Harismendy et al., 2003.
Hernandez, 2002; Canella et al., 2010). These Pol III-specific subunits form two subcomplexes (Fig. 2). The C53/37 subcomplex is involved in promoter opening, elongation, termination and reinitiation (Cramer et al., 2008; Carter and Drouin, 2009; Kassaventis et al., 2010; Landrieux et al., 2006), whereas the C82/34/31 subcomplex is involved in promoter recognition and initiation. C34 interacts with TFIIIB, which recruits Pol III to promoters (Thuillier et al., 1995; Werner et al., 1993) and is involved in open complex formation (Brun et al., 1997).
Also Maf1, the general Pol III repressor, is conserved across eukaryotic organisms from yeast to man (Pluta et al., 2001). This conservation is of particular interest considering that misregulation of Pol III in human cells has been linked to malignant transformation. Excessive activation of Pol III-directed transcription can lead to tumorgenesis (Marshall et al., 2008; Marshall et al., 2008; Johnson et al., 2008). In line with this observation, two mammalian tumor suppressors, Rb and p53, have been shown to act as global repressors of Pol III transcription (White, 2008). Recent results of several groups report Maf1-mediated repression of Pol III transcription in human cells implicating H. sapiens Maf1 ortholog as a new class of mammalian Pol III regulators (Goodfellow et al., 2008; Reina et al., 2006; Johnson et al., 2007; Rollins et al., 2007). The involvement of H. sapiens Maf1 in the aberrant control of Pol III transcription in cancer cells remains to be elucidated. In the light of the high evolutionarily conservation of the Pol III machinery including Maf1, insights into Pol III (mis)regulation by Maf1 attained by studying model organisms, such as yeast, should provide some insight into the role of H. sapiens Maf1 in cancer development.
Figure 2. A model of the Pol III transcription initiation complex. A model of the Pol III transcription initiation complex. Protein–protein contacts observed by the two-hybrid system are indicated by red dots. Green dots indicate the interaction between AC40, AC19, ABC10α and ABC10β with A190 and A135 Pol I subunits homologous to C160 and C128. Genetic interactions observed by using multicopy suppression experiments of full-length mutations are indicated by arrows. The arrowhead points toward the subunit harboring the suppressed mutation. For the sake of simplicity,
1.
Maf1-mediated
repression
of
RNA
polymerase
III-dependent transcription.
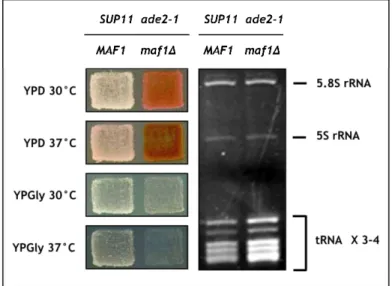
The Maf1 protein was identified originally in Saccharomyces cerevisiae in a genome-wide screen for mutations that decrease the nonsense suppressor efficiency of SUP11 (tRNA-Tyr(UAA)) (Fig. 3). The isolated mutation (maf1-1) conferred temperature-sensitivity in medium containing glycerol (a nonfermentable carbon source) (Murawski et al., 1994). The identified maf1-1 mutation besides inactivating the MAF1 gene (maf1∆) lead also to the increase of tRNA level, suggesting a deregulation of Pol III transcription (Pluta et al., 2001; Kwapisz et al., 2002; Upadhya et al., 2002). The disturbance of S. cerevisiae cell growth in respiratory conditions at high temperatures was explained by the toxic effect of tRNA accumulation (Ciesla et al., 2007). Performed investigations placed Maf1 as a main repressor of Pol III, involved in transduction of signals from diverse signaling pathways to the Pol III apparatus (Upadhya et al., 2002).
Maf1 represses Pol III transcription in response to unfavorable growth conditions (various drug treatment, oxidative stress), secretory pathway defects and during stationary phase and respiratory growth. Inactivation of MAF1 gene (maf1∆) blocks repression of Pol III transcription under all these conditions (Upadhya et al., 2002). Moreover, it was shown that under conditions of carbon source starvation, endoplasmic
Figure 3. The maf1∆ mutation results in increased tRNA level and antisuppressor phenotype. The presence of ade2-1 nonsense mutation leads to an accumulation of red pigment and can be overcome by a functional tRNA-Tyr (UAA) suppressor, SUP11. S. cerevisiae strain SUP11 ade2-1 (MB159-4D) is white, while SUP11 ade2-1 maf1∆ (MB159-4D∆) is red, indicating that the deletion of the chromosomal MAF1 counteracts the effect of SUP11 and acts as an antisuppressor. Moreover, the maf1∆ mutation results in temperature-sensitive growth on glycerol-containing medium (YPGly), and an increase of tRNA to a level 3-4-fold higher than the level in parental isogenic SUP11 ade2-1 cells. Adapted from Kwapisz et al., 2002.
reticulum stress (induced by DTT, 1,4-dithiothretiol) and during oxidative stress (induced by hydrogen peroxide) S. cerevisiae cells also lack Pol III repression in the absence of MAF1 (Desai et al., 2005, Boisnard et al., 2009). Maf1 was also shown to be essential for the regulation of Pol III transcription during the transition of S. cerevisiae cells from medium with fermentable to a nonfermentable carbon source inducing respiratory growth conditions (Fig. 4, Ciesla et al., 2007).
Recent data on Maf1 suggested possible connection between replication and transcription processes (Nguyen et al., 2010). In S. cerevisiae, active tRNA genes act as “replication fork barriers” during cell proliferation as Pol III with concomitant TFIIIB/TFIIIC transcription factors interfere with the elongation process carried out by processive DNA polymerases (Deshpande et al., 1996) in a way that might promote chromosome breakage. Checkpoint repression occurs in co-directional tRNA genes, which are replicated in the same direction as they are transcribed. The sensor kinase (Mec1), the signaling adaptor (Mrc1) and the transducer kinase (Rad53), involved in replication checkpoint, relay signals, which globally repress tRNA gene transcription in noneffected growth conditions and under replication stress (HU, hydroxyurea). Maf1 was shown to mediate replication stress signaling and pre-tRNA synthesis as shown by Rad53-dependent dephosphorylation of Maf1 in HU-treated
Figure 4. Inactivation of MAF1 leads to tRNA accumulation that is increased during cell growth on nonfermentable carbon sources. Cells with inactivated Maf1 grown in glycerol medium (YPGly) at 37°C have markedly higher levels of each type of tRNA tested, compared to WT cells, although this increase is different for the individual tRNA species. Northern blotting analysis. RNA from WT and maf1∆ cells (YPH500 S. cerevisiae strain) were separated on polyacrylamide gels, followed by hybridization using labeled oligonucleotide probes complementary to various tRNAs, 5S rRNA and U3 snoRNA. Numbers below represent quantification of the relative levels of each RNA present in WT and maf1∆ cells grown in glucose (YPD) and glycerol-containing medium (YPGly). Adapted from Ciesla et
cells (Nguyen et al., 2010). Cells lacking Maf1 exhibit elevated tRNA synthesis and are more sensitive to HU-directed replication stress.
These results have shown that S. cerevisiae cells require Maf1 to achieve Pol III repression and that Maf1 mediates multiple signals for Pol III regulation.
In human cells, Maf1 seems to play a similar role as in S. cerevisiae, mediating Pol III repression. At least Reina et al. (2006) show that in response to MMS and rapamycin, knock-down of Maf1 diminishes repression of Pol III.
Moreover, novel unpublished data on D. melanogaster Maf1 ortholog show an important global Maf1 effect on cellular growth and cell maintainance. Similarly to mammalian and S. cerevisiae cells, in D. melanogaster cells inhibition of tRNA synthesis occurs in response to nutrient deprivation in correlation with TOR (Target of rapamycin) signaling pathway inhibition. Moreover, in D. melanogaster, Maf1 was shown to regulate the development of larvae in response to nutrient availability. Diminished expression of Maf1 by RNA silencing (siRNA) caused increased tRNA levels, in spite of TOR inhibition induced by starvation. This correlated not only with faster larvae development, but also with their increased sensitivity and lower survival in response to starvation (Rideout and Grewal, 2010 – data unpublished).
The mechanism of Pol III regulation by Maf1 affects several components of Pol III transcription apparatus. One of the phenomena occurring during regulation of Pol III activity is a physical interaction of Maf1 with Pol III largest subunit, C160. This was initially demonstrated by overexpression of the C160 N-terminal fragment, which led to suppression of maf1-1 temperature-sensitivity on a nonfermentable carbon source (Boguta et al., 1997). Further investigations provided some more evidences for the observed genetic interaction. Mutations in RPC160 (gene encoding C160) were obtained and described as spontaneous suppressors of maf1-1 and maf1∆ (Pluta et al., 2001). Also, co-immunopurification experiments revealed that S. cerevisiae Maf1 in cell extracts associates, directly or indirectly, with C160. Pull-down experiments have revealed that S. cerevisiae Maf1 interacts, most probably directly, with the N-terminal domain of C160 (235 residues) (Oficjalska-Pham et al., 2006) and weakly but specifically with Brf1 (TFIIIB – related factor), a subunit of Pol III transcription initiation factor TFIIIB (Desai et al., 2005) involved in recruitment of Pol III to promoters. Desai et al. (2005) postulated that repression of Pol III by Maf1 occurs as a two step process: by blocking the assembly of the TFIIIB–DNA complex and subsequently by recruitment of Pol III to pre-existing TFIIIB–DNA complexes.
Similar results supporting the hypothesis of interaction with components of Pol III, were obtained for human Maf1. Co-immunoprecipitation experiments indicated that human Maf1 interacts with Rpc1 (the largest subunit of Pol III – reported as C160 in S. cerevisiae cells), Brf1 (S. cerevisiae Brf1 homologue) and Brf2 (a subunit of the TFIIIB complex required for transcription of U6 snRNA, 7SK and H1 genes) (Reina et al., 2006; Rollins et al., 2007; Goodfellow et al., 2008).
In yeast S. cerevisiae, inhibition of Pol III activity by Maf1 was studied also in conditions involving the nutrient-sensing signal transduction pathway and during stationary growth phase.
Inhibition of Pol III occurs during stationary growth phase or under rapamycin treatment, which mimics nutrient deprivation. It was estimated that the level of Pol III-dependent transcription decreases up to 10-20% after a 25-min. induction by rapamycin (Harismendy et al., 2003; Roberts et al., 2003). In the stationary growth phase, down-regulation of Pol III transcription occurs by decrease in Pol III, Brf1 and Bdp1 (subunits of Pol III transcription factor - TFIIIB) recruitment to class III genes as shown by ChIP on chip analysis (Harismendy et al., 2003; Oficjalska-Pham et al., 2006). In the absence of Maf1, Pol III occupancy on class III genes strongly increases compared with the exponential phase of growth, Brf1 is present at similar levels while the presence of Bdp1 is slightly affected with very vivid Pol III-dependent transcription to (Oficjalska-Pham et al., 2006). Under rapamycin treatment, Pol III and TFIIIB (Brf1 and Bdp1) occupancy on class III genes decreases in control cells, while in cells lacking Maf1 the occupancy decreases slightly or does not change. Moreover, Maf1 occupancy on class III genes is increased during cell starvation (rapamycin treatment, nutrient deprivation) as shown by Oficjalska-Pham et al. (2006) and Roberts et al. (2006). In addition, interaction of Pol III with Maf1 is increased after treatment with rapamycin or in the stationary phase of growth (Oficjalska-Pham et al., 2006).
All these results show that independently from the pathway inducing the down-regulation of Pol III transcription, Maf1 acts in a similar way by affecting directly the assembly of TFIIIB onto class III genes promoters and recruitment of Pol III to the transcription initiation complex.
The activity of Maf1 is regulated at posttranslational level by phosphorylation that occurs in favorable conditions (Oficjalska-Pham et al., 2006; Moir et al., 2006; Willis and Moir, 2007). Furthermore S. cerevisiae Maf1 was shown to serve as a target for either PKA or Sch9 kinases (Lee et al., 2009; Huber et al., 2009). Huber et
al. (2010) have demonstrated predominant role of the Sch9 kinase in Maf1 phosphorylation in normally growing S. cerevisiae cells and Maf1-dependent Pol III down-regulation via Sch9 inhibition. Maf1 contains six motifs fitting the R(R/K)xS consensus, which is often attributed to AGC family kinases (S90, S101, S177, S178, S209 and S210) Huber et al. (2010) in an in vitro assay indicated these sites, and additionally S179, as a targets for the Sch9 kinase.
In exponentially growing S. cerevisiae cells, Maf1 is phosphorylated and migrates as several bands corresponding to different phosphorylation states on modified SDS/PAGE polyacrylamide gels (Oficjalska-Pham et al., 2006). Different stress conditions, like rapamycin, stationary phase, chlorpromazine (CPZ), methyl methane sulfonate (MMS) or nutrient depletion that induce down-regulation of Pol III transcription, causes dephosphorylation of Maf1 and its migration as a single band, which is interpreted as a fast-migrating dephosphorylated form (Oficjalska-Pham et al., 2006; Roberts et al., 2006; Moir et al., 2006). Maf1 interacts with Pol III in its dephosphorylated form (Fig. 5, Oficjalska-Pham et al., 2006; Roberts et al., 2006, Huber et al., 2009), which indicates phosphorylation as a form of regulating Maf1 activity.
Similarly to S. cerevisiae Maf1, human Maf1 also exhibits phosphorylation-dependent activity. It was shown that, the inactive form of human Maf1 remains phosphorylated (Reina et al., 2006; Rollins et al., 2007; Goodfellow et al., 2008; Michels et al., 2010). The human Maf1 is phosphorylated on serines: S60, S68 and S75 (nota bene: amino acids positions in human Maf1 are not the same for S. cerevisiae Maf1), by mTORC1 kinase (Michels et al., 2010; Shor et al., 2010; Kantidakis et al., 2010). After treatment of human cells with rapamycin, Torin1 or MMS, Maf1 is dephosphorylated and migrates as a single fast-migrating form, in contrast, to unaffected cells presenting additional slow-migrating bands.
Figure 5. Pol III-Maf1 interaction increases in stress conditions. Maf1 is phosphorylated, but only the dephosphorylated form of Maf1 interacts with Pol III. Western blot analysis using a modified acrylamide:bisacrylamide ratio SDS-PAGE of Maf1-myc immunopurified from exponential phase (Exp.), stationary phase (Stat.), or rapamycin-treated (Rap.) cells (IP Maf1, lanes 1–3) and of Maf1-myc co-immunopurified with C160 from the same cells (IP Pol III, lanes 4–6). Adapted from Oficjalska-Pham et al., 2006.
The dephosphorylated form of human Maf1 like S. cerevisiae Maf1 interacts with Pol III (Reina et al., 2006).
S. cerevisiae Maf1 is also dephosphorylated under respiratory growth conditions, which are induced by the change from fermentable (glucose) to nonfermentable (glycerol) carbon source. Transfer from glucose to glycerol medium results in Maf1 dephosphorylation (Ciesla et al., 2007). Re-transition of S. cerevisiae cells to glucose medium, is followed by Maf1 re-phosphorylation (Fig. 6, Towpik et al., 2008).
The phosphorylation state of Maf1 is correlated with its cellular localization. In exponentially growing S. cerevisiae cells, Maf1 is phosphorylated and is present at the same concentration in the cytoplasm and the nucleus, as observed by immunofluorescent microscopy. Different stress conditions, treatment of cells with rapamycin, nutrient deprivation, stationary phase or respiratory growth conditions lead to dephosphorylation and nuclear concentration of Maf1, which is associated with repression of Pol III-dependent transcription (Oficjalska-Pham et al., 2006; Roberts et al., 2006; Moir et al., 2006; Towpik et al., 2008). Dephosphorylation of PKA/Sch9 sites that occurs under rapamycin treatment, correlates with Maf1 relocation into the nucleus (Moir et al., 2006; Huber et al., 2009). However, it is not known whether dephosphorylation precedes, follows or is simultaneous with import of Maf1 into the nucleus (Moir et al., 2006).
Figure 6. Maf1 is re-phosphorylated and exported out of the nucleus after transferring cells from respiratory conditions (glycerol medium, YPGly) to glucose medium (YPD). Maf1 becomes dephosphorylated upon transition from glucose to glycerol medium (compare YPD and YPGly lanes), the opposite transition results in gradual Maf1 phosphorylation (compare YPGly and YPD lanes; 5 min to 1 h). Relocation of Maf1 to the cytoplasm in response to glucose appeared to be concomitant with Maf1 hyperphosphorylation. Localization of Maf1 was analyzed by immunofluorescence microscopy using polyclonal anti-Maf1 antibodies. Nuclei were stained with 4,6-diamidino-2-phenylindole (DAPI) (top panel). Crude extracts prepared from the same cells by trichloroacetic acid precipitation were analyzed using SDS-PAGE with a modified acrylamide:bisacrylamide ratio, followed by immunoblotting with polyclonal anti-Maf1 antibodies (bottom panel). The slower-migrating diffuse band corresponds to
Nuclear import of S. cerevisiae Maf1 is directed by two nuclear localization sequences (NLS1 and NLS2). Activity of the N-terminal NLS (NLS1) was proposed to be regulated via phosphorylation, while the C-terminal NLS is regulated independently of the phosphorylation state (Moir et al., 2006). The accumulation of Maf1 in nucleus due to the lack of the Msn5 exportin protein is not sufficient to cause Pol III repression in the absence of additional factors that are triggered by cellular signaling pathways. Moreover, Maf1 was dephosphorylated and phosphorylated normally in the msn5∆ mutant and Pol III was under proper regulation (Fig. 7, Towpik et al., 2008).
Recent investigations point that Maf1 localization does not depend only on shuffling between the nucleus and the cytoplasm, but also its presence in the nucleolus is detectable and has a crucial role for Maf1 activity in pathway involving TOR (Target of rapamycin) (Wei et al., 2009). TOR is an evolutionarily conserved P13K-related kinase and a central regulator of cell growth found originally in S. cerevisiae (Heitman et al., 1991). TOR proteins form two functional complexes: TOR complex 1 (TORC1) and TOR complex 2 (TORC2) (Loewith et al., 2002). The anticancer drug - rapamycin inhibits specifically TORC1. TORC1 regulates a broad spectrum of growth-related processes, including ribosome biogenesis and protein translation (Wullschleger et al., 2006). TORC1 is a major regulator of transcription in S. cerevisiae, counting all ribosomal genes transcribed by the three major RNA polymerases (Warner, 1999; Moss and Stefanovsky, 2002). Rapamycin (by
Figure 7. Model of Maf1 regulation during transfer of S. cerevisiae cells from respiratory conditions to glucose. In response to the shift of respiratory growing culture to medium with glucose, nuclear Maf1 is phosphorylated (P) by an unknown kinase (X). Phosphorylation of Maf1 prevents its interaction with Pol III and enables binding to the Msn5 carrier and export out of the nucleus. In parallel, protein kinase A-directed phosphorylation at different sites prevents nuclear import of the cytosolic Maf1. Adapted from Towpik et al., 2008.
approaching TORC1) and nutrient starvation cause rapid repression of the TOR signaling pathway in correlation with ribosomal genes repression.
Wei et al. (2009) showed that TORC1 (TOR complex 1) indirectly regulates synthesis of tRNA by Pol III through Maf1 phosphorylation. Moreover, TORC1 regulates Maf1 translocation from the nucleoplasm to the nucleolus, a subnuclear compartment, in which, 5S rDNA is transcribed by Pol III. Maf1 is normally excluded from nucleolus. Inhibition of TORC1 by rapamycin promotes Maf1 nucleolar localization and association with 5S rDNA, a Pol III transcribed chromatin.
The scheme of Maf1-dependent Pol III transcription regulation in response to nutrient availability is presented on Figure 8. The graphic presentation shows also the simultaneous regulation of Pol I, which is coordinated at the same time by TORC1 effector, common for all eukaryotic RNA polymerases,.
Figure 8. Model of Pol III transcription regulation mediated by Maf1 in response to nutrient depletion. TORC1 regulates simultaneously Pol I and Pol III according to nutrient availability. Sch9 partially mediates TORC1 signaling to activate Pol I and Pol III transcription by the nutrients. In the presence of nutrients TORC1 promotes Pol I and Pol III transcription in the nucleolus and phosphorylates Maf1 preventing its negative effect on Pol III . Additionally, TORC1 activates Sch9 and uses Sch9 to phosphorylate Maf1 in the nucleus and promote its export to the cytoplasm. Bold lines, activation/repression; empty lines, changes in localization (from Boguta, 2009).
2.
Search of evolutionarily conserved domains within the
Maf1 sequence.
The Saccharomyces cerevisiae MAF1 gene (Boguta et al., 1997) encodes a hydrophilic protein of 395 amino acids (aa) rich in serine and asparagine residues with a predicted molecular mass of 44.7 kDa. Comparison of the S. cerevisiae Maf1 sequence with multiple databases using the BLAST server revealed more than a hundred orthologs in humans, animals (50), plants (28) and lower eukaryotes (27). No potential prokaryotic orthologs were identified. Although eukaryotic Maf1 differ in molecular mass, ranging from 26 kDa (S. pombe, H. sapiens) up to 45 kDa (S. cerevisiae) (Willis et al., 2004), they all share a common organization pattern.
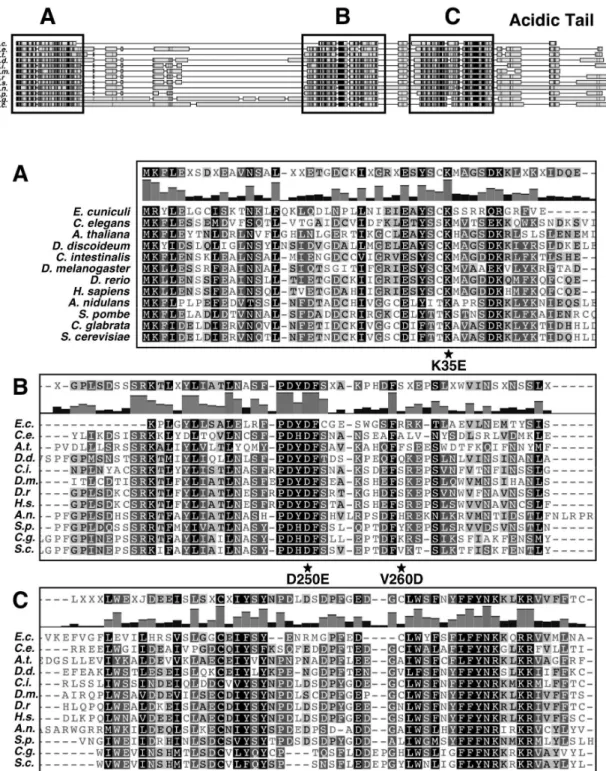
The family of Maf1 proteins contains three phylogenetically conserved sequence regions, labeled A, B and C (Pluta et al., 2001). The C-terminal acidic tail is present in most Maf1 orthologs. Similarity of Maf1 sequences is presented in Figure 9 (Gajda et al., 2010). A short distance of approximately aa 10 between B and C segments is constant in evolution, with the exception of A. nidulans (showing insertion of aa 15), therefore this region could be considered as a single domain and is referred hereafter as the BC domain. In contrast, the space between A and B regions is different between species. A and BC domains are fused in E. cuniculi, whereas yeast S. cerevisiae and C. glabrata Maf1 orthologs have long linkers of aa 182 and aa 174, respectively. Within the BC domain, signature sequences indicative of the Maf1 protein family can be identified (PDYDFS and LWSFnYFFYNKklKR, Fig. 9) (Pluta et al., 2001). Interestingly, in the majority of Maf1 orthologs, the second motif includes a nuclear targeting signal, proven to be functional in S. cerevisiae Maf1 (Moir et al., 2006). The PSORT program found in S. cerevisiae Maf1 two possible nuclear targeting signals: KRRK (position 204, NLS1) and a double signal RKRK-KRKR (positions 327 and 328, NLS2) (Pluta et al., 2001).
Despite numerous data on Maf1, no functional information has been obtained from its amino acid sequence due to lack of significant homology with protein domains of known function.
Figure 9. Alignment of Maf1 sequences. Schematic representation of Maf1 protein sequences from different species: Encephalitozoon cuniculi (gi|19069247|, size: 161 aa), Caenorhabditis elegans (gi|17506011|, size: 245 aa), Arabidopsis thaliana (gi|22326767|, size: 224 aa), Dictyostelium discoideum (gi|66816633|, size: 278 aa), Ciona intestinalis gi|198415188|, size: 233 aa), Drosophila melanogaster (gi|46409204|, size: 226 aa), Danio rerio ( gi|47087413|, size: 247 aa), Homo sapiens (gi|49065352|, size: 256 aa), Aspergillus nidulans (gi|67901388|, size: 314 aa), Schizosaccharomyces pombe (gi|254745531|, size: 238 aa), Candida glabrata (gi|49529111|, size: 391 aa) and Saccharomyces cerevisiae (gi|1170854|, size: 395 aa). Protein sequences have been aligned with MUSCLE multiple alignment software (41) and the figure created with Geneious Pro 4.5.4 software. Conserved domains are boxed and labeled by letters: A, B and C on the upper panel. Sequence alignments of each conserved domain (A, B and C) are shown in the lower panel. Histograms above the alignments indicate the percentage of identity among the sequences. Consensus sequences are shown above the alignments. Positions of K35E, D250E and V260D mutations are indicated by a star below the alignments (N344I mutation is located 6 aa after the end of the BC domain and therefore is not
Classical methods of analyzing protein sequences focus on the detection of the highest amino acids identity.
If the sequence of a protein with unknown structure is similar to one with known architecture, it is assumed, that the fold of the main polypeptide chain will share the same conformation. If the similarity between two sequences is statistically high this method may be very efficient. Yet in case of sequences with low similarity this method is not valuable, although differences between the investigated sequences may not imply any important differences in the three-dimensional (3D) folding of the proteins. This can be explained by the fact that sequence alignments compare whole amino acid sequences but do not take into account neither the formation of regular secondary structures by some sets of sequences and the concomitant spacial architecture of the protein imposed by the solvent, nor the biochemical properties of amino acids composing the polypeptide chain (Gaboriaud et al., 1987).
The HCA (Hydrophobic cluster analysis) is an unconventional, highly efficient and sensitive method of analyzing protein sequences. HCA serves as a powerful tool to investigate the three-dimensional (3D) structure of a protein. Furthermore, it provides data to understand features of protein stability and folding (Callebaut et al., 1997). The idea of HCA was firstly reported by Gaboriaud et al. (1987) and Lemesle-Varloot et al. (1990). It originates from a two-dimensional (2D) helical representation of protein sequence and focuses on the presence of possible hydrophobic clusters formed by internal hydrophobic residues in amino acid sequence.
The principles of HCA analysis are based on simple biological phenomena of hydrophobic and hydrophilic molecular entities that behave in a regular manner. Mostly hydrophobic amino acids dominate the internal core, while mostly hydrophilic amino acids lie on the protein surface to protect the core from solvent (water, ions). This dichotomic behaviour of hydrophobic and hydrophilic residues is due to the fast escape of hydrophobic amino acids from water under the pressure of entropic and enthalpic forces. In consequence, the hydrophobic amino acids create stable and compact structures that are typical for a particular fold. These structures are called clusters (Callebaut et al., 1997). Clusters of hydrophobic amino acids are statistically found in close correspondence with the internal features of regular secondary structures (Woodcock et al., 1992). Hydrophobic amino acids are known to be favored within the internal faces of regular secondary structures (α-helices and β-strands) and disfavored within the main irregular
secondary structures (loops) (Eudes et al., 2007). The HCA analysis divides amino acids into two main classes: the hydrophobic ones and the others, which are hydrophilic and/or indifferent to their environment.
The hydrophobic amino acids are devided into two groups: strong hydrophobic amino acids (valine (V), isoleucine (I), leucine (L), phenylalanine (F)), which have the major impact on creating hydrophobic internal features of secondary structures and moderately hydrophobic amino acids (methionine (M), tryptophan (W), tyrosine (Y)) that may be exposed or semi-exposed to the outer surface. Tryptophan and tyrosine are thought to mediate often intermolecular interactions and tyrosine often favors loop formation. In HCA strong and moderately hydrophobic amino acids are grouped together and are highlighted as a hydrophobic clusters. Proline (P) due to distinctive cyclic structure of its side chain, acts as a structural disruptor in the middle of regular secondary structure elements, such as α-helices and β-strands. However, proline is commonly found as the first residue of an α-helices as well as on the boundaries of β-strands. Proline is also commonly localized in turns, which may account for the curious fact that proline is usually solvent-exposed, despite having a completely aliphatic side chain. In HCA, proline is currently considered to be a cluster breaker. All the other amino acids are considered as a single class of residues that have a minor impact on the development of hydrophobic clusters. Although these amino acids are regarded as a neutral for the formation of hydrophobic cores, they share some specific properties. For example arginine (R) and lysine (K), both, are polar amino acids with a long aliphatic stems. Sometimes these amino acids substitute hydrophobic amino acids, in situation when, their heads reach a polar environment (solvent or ionic pairs). Asparagine (N) can adopt a left helical main chain conformation otherwise mainly occupied by glycine (G). Alanine (A) occupies both hydrophobic and hydrophilic areas although it favours forming α-helices. Cysteine (C) is regarded as a nonpolar, hydrophobic residue, which suggests its participation in group of hydrophobic cluster formers. However, its ability to form disulphide bonds is a factor that excludes cysteine from mentioned group and its presence in polypeptide chain is always worth detailed consideration when analyzing the possible 3D structure of a protein. Threonine (T), a branched amino acid, frequently replaces valine (V) or isoleucine (I) in β-strands and, like serine (S), may mask its polarity inside α-helices. Serine is thought to mimic proline rings. Glutamic acid (E) and aspartic acid (D) are polar amino acids occupying hydrophilic areas (Callebaut et al., 1997).
In summary, the main driving forces of regular secondary structures are strong hydrophobic amino acids (V, I, L, F) as well as moderately hydrophobic amino acids (M, Y, W), while the main driving forces of loops are P, G, D, N and S.
To make the representation of protein structures more clear and understandable by avoiding too many one-letter code symbols, HCA uses four symbols for particular amino acids: a star for proline (P), which has the greatest influence on the polypeptide chain, a diamond for glycine (G), which, in contrast, does not have a great impact on the conformation of the chain, squares with or without a dot - for serine (S) and threonine (T) respectively, which despite sharing polar properties, may mask their polarity by creating H-bonds with the carbonyl groups of the main chain, particularly within helices.
The main principles of HCA presentation are explained on the example of human α1-antitrypsin (Callebaut et al., 1997, Fig. 10). The G246-S283 fragment of human α1-antitrypsin is displayed as a α-helix (3,6 aa per turn) formed on a cylinder (Fig. 10a). Residues from G246 to E264 have similar positions, which are parallel to the axis of the cylinder. Subsequently the cylinder has been cut to its axis and unrolled (Fig. 10b). Unfolding of the cylinder separates some adjacent amino acids. In order to preserve the natural environment of all residues and give a better impression of the sequence, the representation has been duplicated (Fig. 10c). Hydrophobic residues have been contoured (Fig.10d).
Hydrophobic amino acids commonly form the previously mentioned clusters. These clusters correspond to regular secondary structures (Woodcock et al., 1992). The vertical clusters, as shown experimentally, are associated with β-strands whereas the horizontal ones are mostly α-helices. This points the connection between the general shape of the cluster that indicates particular secondary structure. Between recognizable group of clusters there may occur visible stretches of sequences that are revealing a presence of loops or unstructured regions between the protein’s domains. The 2D α-helical presentation of hydrophobic clusters matches best match the observed regular α or β secondary structures of globular proteins.
The HCA analysis of S. cerevisiae Maf1 reveals the presence of two highly structured regions, corresponding to the A and BC domains, which are separated by unstructured region, matching to the linker region between Maf1 domains. This linker region is poor in hydrophobic residues suggesting that in vivo it might be exposed on the outer surface, during protein folding. Moreover, comparison of the HCA analysis for the S. cerevisiae and H. sapiens Maf1 proteins, reveals their
similar organization indicative of the high conservation of these folds through evolution (Fig. 11).
Figure 11. Hydrophobic Cluster Analysis (HCA) of Maf1 sequences. Schematic representation of predicted 3D structure of the S. cerevisiae vs H. sapiens
Maf1 proteins. Red star indicates proline, diamond – glycine, squares with or without a dot – serine and threonine, respectively. Acidic residues (E, Q, N) are in red, basic residues (K, R) are in blue. Hydrophobic amino acids form clusters shown as green contoured areas). Vertical clusters correspond to β-strands whereas horizontal clusters are associated with α-helical structures. For further information see Callebaut et al., 1997. Localization of the A and BC domains of Maf1 is indicated with black arrows.
If the crystal structure of a protein is unavailable as in the case of Maf1 there is still a possibility to presume its structural organization. The bioinformatic field provides a wide range of different software tools for predicting a variety of protein structural features, such as secondary structures (e.g. PSIPRED), a presence of natively disordered regions (e.g. DISOPRED2) as well as boundaries of protein domains (e.g. DomPred). One of the most popular servers, the PSIPRED server, has been developed in the Bioinformatics Unit at the University College London. It consists of several independent servers dedicated to characterizing the protein features mentioned above as well as predicting of protein folds (e.g. mGenTHREADER), transmembrane helix topology (e.g. MEMSAT2) and 3D models of tertiary structures (e.g. BioSerf) (Bryson et al., 2005).
PSIPRED is a highly accurate secondary structure prediction method based on the PSI-BLAST (Position Specific Iterated BLAST) (Altschul et al., 1997) output. PSIPRED has been estimated to achieve an average accuracy of 76,5%, which places this method among the most accurate softwares for predicting the secondary structure of the proteins. The PSIPRED server, apart from, the pure data analysis provides also a graphical representation of the secondary structure prediction, which makes the output visible and clearl to understand by the user (McGuffin et al., 2000). Comparison of S. cerevisiae and H. sapiens Maf1 sequences, according to PSIPRED analysis, revealed highly similar organization of secondary structures. In the A domain, PSIPRED prediction indicated the presence of two α-helices separated by two adjacent β-strands, while for the BC domain - five α-helices and concomitant four β-strands are predicted (Fig. 12). No secondary structure elements were predicted for the linker region.
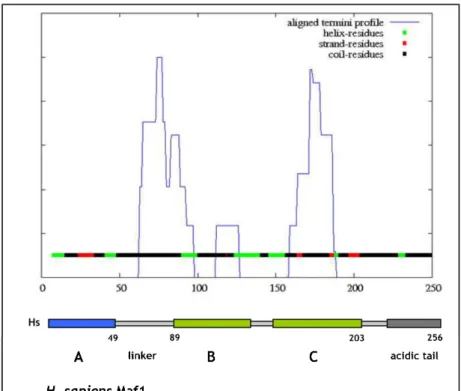
The DISOPRED2 server is commonly used for prediction of unstructured regions called regions of native disorders (http://bioinf.cs.ucl.ac.uk/disopred/). In contrast to PSIPRED, it is devoted to analyzing protein regions, that do not posses any static structures, but are in a constant change between different structures (Bryson et al., 2005). The DISOPRED method was estimated to be one of the best methods of false positive rates. The method has an accuracy of ~93% per residue when using the 5% false positive rate threshold (Ward et al., 2004). Analysis of S. cerevisiae Maf1 amino acid sequence showed the presence of two structured regions of approximate localization: aa 1-50 and aa 225-325 (Fig. 13B, lower panel). These regions correspond to the A and BC domains of S. cerevisiae Maf1 (aa 1- 49 and aa 231-338 respectively), separated by an unstructured region (aa 50-225) corresponding to the linker region separating Maf1 A and BC domains (aa 49-231).
Figure 12. Secondary structure prediction of Maf1 protein. PSIPRED v 2.6 protein structure prediction server was used to identify the secondary structures of S. cerevisiae and H. sapiens Maf1 proteins. Only A and BC domains are presented. Green tube (or H letter), yellow arrow (or E letter) and black line (or C letter) represent alpha helix, beta strand and coil, respectively.
There is also a visible second unstructured region (aa 340- 395) that is related to the acidic tail of Maf1. Similar analysis of the H. sapiens Maf1 sequence revealed its analogous organization to the S. cerevisiae Maf1 protein. According to DISOPRED2, H. sapiens Maf1 present two structured regions of approximate localization: aa 1-50 and aa 85-210 (Fig. 13A, upper panel). These regions correlate with the position of the A and BC domains of human Maf1 (aa 1-49 and aa 83-203 respectively). The identified structured regions are separated by an unstructured region (aa 50-85), which corresponds to the linker in H. sapiens Maf1 localized between aa 49-83. The graphical representation of the protein, reveals also a second unstructured region between aa 210-240, which is related to the acidic tail of H. sapiens Maf1 (aa 203-256).
The DomPred (Protein Domain Prediction Server) serves as a tool to predict domain boundaries while predicting the overall fold of the protein (http://bioinf.cs.ucl.ac.uk/dompred)(Marsden et al., 2002). Analysis of the S. cerevisiae Maf1 amino acid sequence showed, similarly to the DISOPRED prediction, the presence of 2 domains (Fig. 14B, lower panel). According to the computational analysis, the boundary between the identified domains ranges between aa 100-240. This fragment could in approximate relate to the linker region between the A and BC domains of S. cerevisiae Maf1, as indicated by the sequence alignment (Fig. 9). Similar analysis performed for the H. sapiens Maf1 revealed different organization of the protein. Indeed, the DomPred software detected the presence of only one obvious domain (Fig. 14A, upper panel), corresponding to the A domain of H. sapiens Maf1 (aa 1-49). The fragment ranging from ca. aa 60-100 might be related to the linker region of H. sapiens Maf1 (aa 49-83), while the structured region located ca. between aa 100-160 that could correspond to the conserved B domain of H. sapiens Maf1. The DomPred software failed to detect the anticipated, conserved remaining C domain, indicating, a “boundary” region (aa 160-190) in its place, instead.
Discrepancies between the DISOPRED and DomPred analyses does not exclude each other, as bioinformatic tools serve mostly as a guide for further genetic or biochemical protein analysis. However, all together, the results of HCA, DISOPRED and DomPred analyses with PSI-BLAST alignments show that Maf1 is organized in two structured regions separated by an unstructured linker.
Figure 13. Prediction of unstructured regions in Maf1 sequences. Graphical representation of native disorders existing in the Maf1 protein predicted by DISOPRED2, Prediction of protein disorder server (http://bioinf.cs.ucl.ac.uk/disopred/). False positive threshold is 5%. Visible peacks correspond to the unstructured regions of Maf1. Underneath a schematic representation of Maf1 organization. Upper panel. H. sapiens Maf1; the A domain (aa 1-49) is indicated in blue, the BC domain (aa 89-203) is indicated in green color. Lower panel. S. cerevisiae Maf1; the A domain (aa 1-49), the BC domain (aa 231-338), indicated as described.
Figure 14. Prediction of domain boundaries in Maf1 sequence. Graphical representation of the domain boundaries existing in Maf1 protein as predicted by DomPred, Protein Domain Prediction Server (http://bioinf.cs.ucl.ac.uk/dompred). Visible peacks correspond to unstructured boundary regions of Maf1 domains. Underneath a schematic representation of Maf1 organization as described in the legend to Fig. 13. Upper panel; H. sapiens Maf1. Lower panel; S. cerevisiae Maf1.
Apart from bioinformatic analyses, some experimental prerequisites also allow to consider Maf1 as a structured protein, which activity depends on organization of its folds.
First approaches to distinguish the impact of particular parts of Maf1 on its potential to inhibit Pol III activity were made by Desai et al. (2005). The group investigated recombinant forms of different orthologs of Maf1: SpMaf1 (full-length protein from S. pombe in bacteria) and ScMaf1(B+C) (truncated form of Maf1 from S. cerevisiae containing only B and C sequence blocks). Both recombinant forms of Maf1 were able to inhibit tRNA-Leu and U6 snRNA synthesis in vitro. In addition, binding of these Maf1 recombinant forms to Brf1 blocked the assembly of TFIIIB onto DNA (Desai et al., 2005). These results suggested that the roles of A, B and C blocks in the activity of Maf1 are not equal. A domain seemed to be unnecessary for inhibition of Pol III-dependent transcription (at least for the S. cerevisiae Pol III transcription machinery). Further studies on the functions of Maf1 parts in its activity were investigated in the human ortholog.
Considering the remarkable conservation of the yeast and human Pol III machineries, it could be also imagined, that the regulatory mechanisms involving Maf1 may be similar in yeast and man. Indeed, recent results presented by several research groups show Maf1-mediated repression of Pol III transcription in human cells indicating Maf1 orthologs as a new class of mammalian Pol III regulators (Goodfellow et al., 2008; Reina et al., 2006; Johnson et al., 2007; Rollins et al., 2007).
For the human Maf1, Pol III subunits and Brf1 were shown to associate with different regions of Maf1 (Reina et al., 2006). Two truncated versions of human Maf1, containing only the conserved A domain sequence (Maf1 aa 1-81) or both, the A and B domains, sequences (Maf1 aa 1-142) were investigated for potential interaction with Pol III subunits. The GST pull-down experiment showed that Rpc1 (corresponding to C160 in S. cerevisiae) and Rpac2 (corresponding to AC19 in S. cerevisiae) were associated with the Maf1 aa 1-81 truncated version. In conclusion, Reina et al. (2006) postulated that the first 81 amino acids of human Maf1 are sufficient for its association with Pol III subunits and that the B domain of Maf1 is required for association with Brf1. These results clearly show that there is a link between the structure and activity of the Maf1 protein and that particular Maf1 folds might be involved in different aspects of Maf1 activity as a repressor.
Furthermore, a detailed study over the H. sapiens Maf1 (HsMaf1) has been subjected in laboratory of Christoph Műller (Grenoble at that time) with
collaboration with the laboratory directed by Olivier Lefebvre (CEA/Saclay). To experimentally characterize the structural organization of human Maf1 (HsMaf1), they have carried out limited proteolysis experiments in combination with size-exclusion chromatography (Detailed description in supplementary material – Appendix 1, Gajda et al., 2010).
Proteolytically stable fragments are considered to be structurally well defined, whereas protease-sensitive sites often correlate with disordered protein regions. Using limited proteolysis with trypsin, HsMaf1 protein (aa 256) was digested into two major stable fragments that were identified as HsMaf1 aa 1-45 and Maf1 aa 75-234 using a combination of N-terminal sequencing and mass spectrometry (Q-Tof). These fragments corresponded to the A and BC domains of HsMaf1. The HsMaf1 linker region between those fragments (aa 46-74) and the C-terminal acidic tail (aa 235-256) were degraded and thus presumably unstructured. Both fragments were further analyzed by size-exclusion chromatography. Surprisingly, the two HsMaf1 fragments, although of substantially different molecular masses, co-eluted at an apparent 1:1 stoichiometry, suggesting an intramolecular interaction between them. Moreover, co-expression of these N-terminal and C-terminal fragments of HsMaf1 in bacterial cells and their subsequent purification revealed that the His-Tag A fragment of HsMaf1 co-precipitates with the un-tagged BC protein fragment at an apparent 1:1 stoichiometry, suggesting a direct interaction between these fragments. These results were also confirmed by co-elution using size-exclusion chromatography supporting a direct interaction between the A and BC domains of HsMaf1 (Fig. 15, Gajda et al., 2010).
The results obtained by Christoph Műller’s group on the H. sapiens Maf1 as well as the good sequence conservation of the A and BC domains along evolution were an indication to study the relation of the A and BC domains in S. cerevisiae, an organism more amenable to study structure-function relationships.
Figure 15. Domain structure of human Maf1. A. Limited proteolysis and resulting proteolytic fragments of HsMaf1. SDS-PAGE of full-length human HsMaf1 protein (1, black) that is digested into two stable fragments aa 1-45 and aa 75-234 using trypsin (2, red). Bacterially co-expressed and co-purified HsMaf1 domains aa 1-45 and aa 85-210 (4, green). HsMaf1 aa 82-236 (3, blue) lacking the N-terminal 45 residues was expressed as a control. B. Size-exclusion chromatography profiles. Samples presented in (A) were separated on single or tandem Superdex 200 10/300 size-exclusion columns (GE Healthcare). Only the HsMaf1 construct 82-236 eluates in the void volume of the Superdex 200 size-exclusion column, while all other samples are monodispersed and elute approximately at volumes corresponding to monomers. The elution profile of different molecular weight standards is shown as a dashed line. Peaks I, II, III and IV correspond to ovalbumin (Mr=44000), carbonic-anhydrase (Mr=29000), ribonuclease A (Mr=13700) and aprotinin (Mr=6500), respectively. Fractions corresponding to the red and green elution profiles were analyzed by denaturing gel electrophoresis and shown as insets. Fragment 1-45 co-elutes with proteolytic fragments - 75-234 and 75-262 (red profile) and with the recombinant fragment 85-210 (green profile). Adapted from Gajda et al., 2010.
II.
AIM OF THE WORK
The Maf1 protein was identified in the early ’90 in the laboratory directed by Prof. Boguta. Since then numerous studies concerning Maf1 function as a Pol III repressor have been directed. Currently, Maf1 is considered as the one and only Pol III repressor in S. cerevisiae cells that conveys signals from the diverse signaling pathways on Pol III apparatus.
Maf1 is highly conserved through evolution. The common organization for S. cerevisiae Maf1, described as two structured regions of high similarity separated by an unstructured linker region, is typical for all eukaryotic Maf1 orthologs. These regions of high similarity, called the A and BC domains have no functional homology with the identified protein domains.
Since Maf1 organization is conserved through evolution it must be of high importance for Maf1 activity as a Pol III repressor.
This work addressed two main questions:
Is there a structure-function relation between the A and BC domains of Maf1 and the regulation of Pol III transcription?
Are the A and BC Maf1 domains involved in phosphorylation or the cellular localization of the protein?
To explore these matters and evaluate the significance of the A and BC domains of Maf1, libraries of maf1 mutants harboring mutations localized in sequence encoding each particular domain were constructed and the cellular behavior of chosenMaf1 mutant proteins was investigated.
Supported by the biochemical analysis done by Christoph Műller’s group indicating direct interaction between the domains of human Maf1, also in this work the genetic suppressor approach and yeast-two-hybrid system were applied to explore the potential interaction between the A and BC domains of S. cerevisiae Maf1.
Finally, to investigate how Maf1 affects the Pol III apparatus, a search for partner proteins of Maf1 using parts of Maf1 A and BC domains as a bait was performed.
Altogether, the aim of this study was devoted to a deeper understanding of the structure-function relationship between Maf1 domains and its capacity to repress Pol III.
III.
RESULTS
1.
Construction
of
S.
cerevisiae
Maf1
mutated
in
evolutionarily conserved regions - A and BC domains.
The common approach in analyzing the relationship between the primary sequence of a protein and its activity is to construct several mutants in the gene encoding this protein and investigate their changed cellular behavior depending on the carried mutations. To gain a better understanding of Maf1 functions in S. cerevisiae yeast cell, the MAF1 gene was mutagenized in order to generate defined mutations localized in each particular domain. The obtained maf1 mutants have been initially characterized due to amino acid substitutions and the growth phenotype.
1.1. Maf1 mutations in the A domain.
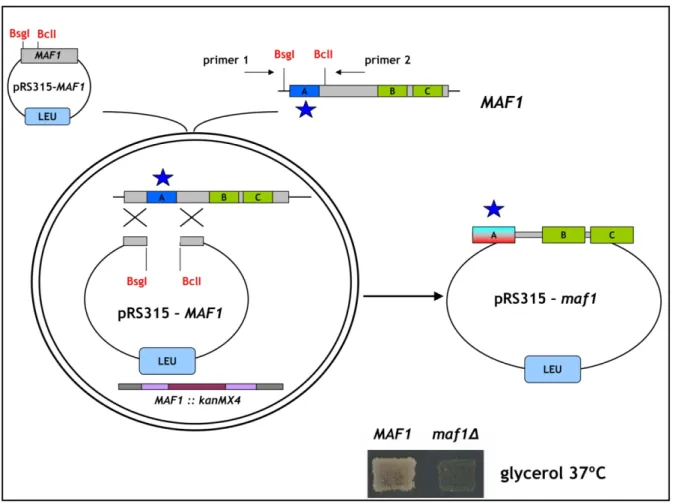
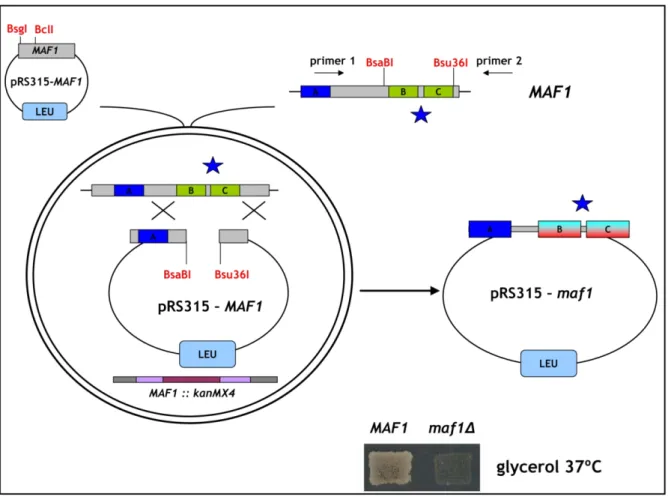
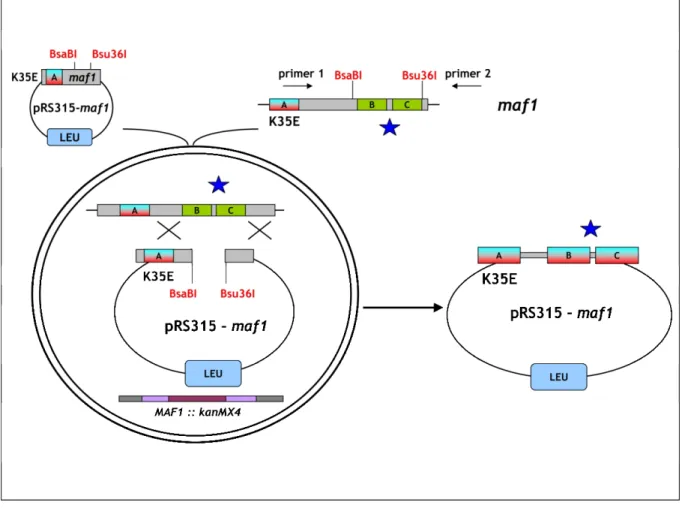
To obtain library of Maf1 protein mutated in the evolutionarily conserved A domain, the rapid method of “Gap repair” for localized mutagenesis has been applied (Muhlrad et al., 1992). The strategy of constructing MAF1 mutants was based on low-fidelity PCR. Sequence encoding A domain and the linker (aa 1-180) has been amplified under conditions that predicted obtaining 1-2 mutations in this region. Co-transformation of the maf1∆ strain with the low fidelity PCR product and gapped plasmid containing regions of MAF1 flanking the A domain enabled in vivo recombination to repair the gap with mutagenized DNA encoding A domain (Fig. 16). The phenotype of 10 000 transformants was screened. Preliminary analysis revealed that among screened transformants nearly 1 000 exhibited temperature-sensitive growth on medium containing glycerol, a nonfermentable carbon source (characteristic phenotype for mutated maf1 strain, Boguta et al., 1997). Potential maf1 mutants were used to isolate plasmid DNA that was subsequently examined by PCR to confirm the presence of the mutagenized region of Maf1 A domain. Approximately 500 plasmids harboured the A domain encoding sequence. After PCR verification, selected plasmids were amplified in E. coli and analyzed with endonuclease EcoRI. Plasmids giving an appropriate restriction pattern (61) were retransformed to the maf1∆ S. cerevisiae strain (YPH500 maf1∆) to confirm that the observed phenotype results from mutations in maf1 allele. Sequencing revealed the type of mutation of the maf1 gene in each of the analyzed plasmids. Selected mutants were additionally examined by Western blotting to confirm the expression of the Maf1 protein.
Transformants were once more replica plated on medium containing glycerol and incubated for 3 days at 37ºC. The growth phenotype observed for the analyzed S. cerevisiae cells expressing mutated Maf1s ranged from: lack of growth (-) similar to the maf1∆ strain, moderate growth defect (+/-) up to no growth defect (WT). No correlation between the observed growth phenotype and the mutagenized region of Maf1 was noted. Moreover, the K→E mutations of the second amino acid obtained in this screen seemed not to change the predicted in vivo half-life of Maf1 protein as reported by the “N-end rule” (Varshavsky, 1997).
Sixty-one isolated maf1 mutants were classified based on the type of identified mutations: missense, frameshift or STOP codon. Missense maf1 mutants (32) represented mutations in sequence encoding: the A domain alone (22), the A domain and the linker region between the A and BC domains (5) or only the linker region (5).
Figure 16. Schematic representation of the experimental strategy applied to construct Maf1 mutated in the A domain. The Maf1 A domain is indicated with blue color. The “gap-repair” system based on homologous recombination in vivo has been presented. Sequence, mutated by low-fidelity PCR encoding the A domain is designated with a blue star. Resulting plasmid harboring maf1 mutated in the sequence encoding A domain is presented on the right.