HAL Id: hal-00174738
https://hal.archives-ouvertes.fr/hal-00174738
Submitted on 25 Sep 2007
HAL is a multi-disciplinary open access
archive for the deposit and dissemination of
sci-entific research documents, whether they are
pub-lished or not. The documents may come from
teaching and research institutions in France or
abroad, or from public or private research centers.
L’archive ouverte pluridisciplinaire HAL, est
destinée au dépôt et à la diffusion de documents
scientifiques de niveau recherche, publiés ou non,
émanant des établissements d’enseignement et de
recherche français ou étrangers, des laboratoires
publics ou privés.
Topographical Dynamics of Brain Connections for the
Design of Asynchronous Brain-Computer Interfaces
Cedric Gouy-Pailler, Sophie Achard, Bertrand Rivet, Christian Jutten,
Emmanuel Maby, Antoine Souloumiac, Marco Congedo
To cite this version:
Cedric Gouy-Pailler, Sophie Achard, Bertrand Rivet, Christian Jutten, Emmanuel Maby, et al..
Topo-graphical Dynamics of Brain Connections for the Design of Asynchronous Brain-Computer Interfaces.
EMBC 2007 - 29th Annual International Conference of the IEEE Engineering in Medicine and Biology
Society, Aug 2007, Lyon, France. pp.2520-2523. �hal-00174738�
Topographical Dynamics of Brain Connections for the Design of
Asynchronous Brain-Computer Interfaces
Cédric Gouy-Pailler, Sophie Achard, Bertrand Rivet, Christian Jutten,
Emmanuel Maby, Antoine Souloumiac and Marco Congedo
Abstract— This article presents a new processing method to design brain-computer interfaces (BCIs). It shows how to use the perturbations of the communication between different cortical areas due to a cognitive task. For this, the network of the cerebral connections is built from correlations between cortical areas at specific frequencies and is analyzed using graph theory. This allows us to describe the topological organisation of the networks using quantitative measures. This method is applied to an auditive steady-state evoked potentials experiment (dichotic binaural listening) and compared to a more classical method based on spectral filtering.
I. INTRODUCTION
The general goal of the research carried out in the field of brain-machine interfaces (BMIs) is to provide disabled people suffering from severe motor diseases with a tool to restore communication and movement [2]. However brain-machine interfaces remain difficult to use in everyday life. Two main reasons can account for this situation: firstly, information transfer rate is low (about 35 bits per minute), and thus constrains drastically the possibilities of interaction; secondly, most systems are synchronous, i.e. the analysis of the cerebral activity is synchronized with a trigger, therefore the attention of the user is permanently drawn by the stimu-lus. Thus, increasing interest is devolved to the development of asynchronous BMIs.
Asynchronous BMIs have been first defined by Mason and Birch [7] in opposition to synchronous BMIs in which subjects have to perform a concentration task when the system is ready. Tasks involved in synchronous BMIs are called time-locked because tasks occur in a specific time interval after a trigger has been given by the system. An asynchronous BMI is therefore defined as a system in which the subject performs the task whenever he wants. So far, only a few successful experiments have been reported by different groups [10], [5], [7]. Among those approaches, two
Cédric Gouy-Pailler and Christian Jutten are with the GIPSA-lab, UMR CNRS 5216, Images and Signal Department, UJF; 46 avenue Félix Viallet, 38031 Grenoble Cedex, France;
Cedric.Gouy-Pailler@lis.inpg.fr
Sophie Achard is with the Brain Mapping Unit, Department of Psychiatry, University of Cambridge; Addenbrooke’s Hospital, Cambridge CB2 2QQ, United Kingdom;sa428@cam.ac.uk
Bertrand Rivet and Antoine Souloumiac are with the Commissariat à l’Energie Atomique (CEA), Saclay; Bât. 451, 91191 Gif-Sur-Yvette France;
bertrand.rivet@cea.fr
Emmanuel Maby is with the INSERM, U821, Lyon, F-69500, France ; Institut Fédératif des Neurosciences, Lyon, F-69000, France ; Université Lyon 1, Lyon, F-69000, France; Centre Hospitalier Le Vinatier, Bâtiment 452, 95 Boulevard Pinel, 69500 BRON;maby@lyon.inserm.fr
Marco Congedo is with Nova Tech EEG, Inc.; 8503 E. Keats Ave, Mesa, Arizona, USA;marco.congedo@gmail.com
classes must be distinguished: Mason’s group rely on operant conditioning resulting in an unspecific task, sometimes long to train, sometimes long to train, whereas Millàn’s group and Pfurtscheller’s group rely on a specific conscious cognitive task, which seems easier to learn. This paper aims at pro-viding signal processing tools for the second approach by modelling a cognitive task as a dynamic modification of the communication between different cortical areas.
This paper shows how to model the subject’s mental state based on the study of the dynamic of the cortical connections. We propose to model brain activity as a complex network in which nodes represent sensors and links between nodes represent a frequency-specific correlation between two sen-sors. Such a model aims at taking into account the whole knowledge acquired about dynamics of brain rhythms (event-related desynchronization and synchronization of neuronal populations during a cognitive task) and to focus on the modifications of the stable brain states induced by a cognitive task [9]. Whereas this kind of model is often used in functional magnetic resonance imaging [1] from a static point of view, we want to analyze the topology of a complex network as a time-varying function. Graph theory provides us with many parameters to describe such an organization [3]. We will choose one of them which is interesting for our purpose.
The remainder of the paper will detail the proposed method, and present an example of application with a steady-state auditive evoked potentials experiment.
II. METHODS
A. Graph Construction
Let xn(t) denotes the signal recorded by the sensor
num-ber n∈ [1..N ], where N is the total number of sensors. As
mental tasks are frequency-dependent, there exist frequency specific perturbations of the cerebral activity, thus signals are processed in the frequency domain. Therefore, at each interesting frequency bin (from a neurophysiological point
of view) fi, the signal acquired is filtered:
y(fi)
n (t) =
Z ∞
−∞
hi(u)xn(t − u)du
where hi(t) is a pass-band filter centered around the
fre-quency fi. This first step aims also at denoising the observed
signals.
Then let C(fi)(t) ∈ [−1; 1]N×N defines the time-varying
estimation of the correlation matrix at time t. This matrix is the main basis of the complex network in which nodes
represent sensors and links between nodes represent the strength of the communication between the cortical areas associated to each sensor. This network can be summarized
by an adjacency matrix A(fi)(t) ∈ {0, 1}N×N. An adjacency
matrix is defined by: a(fi) m,n(t) = ( 0 si |c(fi) m,n(t)| < σ(fi)(t) 1 si |c(fi) m,n(t)| ≥ σ(fi)(t) (1) where c(fi)
m,n(t) is the (m, n) term of the correlation matrix
C(fi)(t). σ(fi)(t) is determined according to the following
criteria:
• in order to be able to compare different graphs, we set
an authorized number of links in each network. So that differences between graphs are due to a modification of the stronger connections and not due to a global increase of the correlations between sensors. The number of links allowed in each network is chosen according to the experimental observations showing a small-world organization of this kind of network [1]. Such an organi-zation has been reported for many self-organized natural systems (e.g. social networks or spread of diseases [3]). The main property is that such networks consist of many short links and a few long-range connections. Information diffusion is made very efficient by such a combination of short and long-range connections i.e. ratio between the number of nodes to cross to go from a node to any other one in the network and the total number of links in the network is optimal.
• a frequency-specific threshold is chosen to take into
account the increase of the variance of the estimators in terms of the wavelet scales
Such a construction results in a binary symmetric ad-jacency matrix: links between nodes are either present or absent. In order to study the dynamics of such a network, the
adjacency matrix A(fi)(t) is computed on short-term moving
windows1.
B. Time-evolving topological measures
A measure called global efficiency is currently used to study the topological organization of the networks [3]. This measure characterises the capacity for parallel information transfer between nodes via multiple series of edges. This reduces the number of parameters describing the graph from
N(N −1)
2 (the matrice A
(fi)(t) is symmetric) to N for each
frequency.
Let G(fi)(t) denotes the graph related to the segment
of data associated to each sensor, {y(fi)
n (t)}n∈[1..N ] at
fre-quency fi. L(fm,ni)(t) is the shortest path length between the
node m and the node n at time t. Global efficiency of the
node m in the graphG(fi)(t) is then defined as [6]:
E(fi) globm(t) = 1 N− 1 X n∈G(fi)(t) n6=m 1 L(fi) m,n(t) (2)
1Every step of the procedure is freely available as a R package devel-oped by author S. Achard and available on the official CRAN website, http://cran.r-project.org/.
This measure quantifies connections of the link m to other nodes of the graph. Indeed, if a node m is isolated from one other node n (because of a lack of conections between those
two nodes), then L(fi)
m,n(t) = ∞ and 1
L(fi)m,n(t)
= 0. III. EXPERIMENTAL RESULTS
The method presented above is used to analyze signals acquired during a steady-state auditive evoked potentials experiment. This new experiment has been carried out by the team of Olivier Bertrand, head of the department “Cerebral Dynamics and Cognition“, unity U821 of the INSERM (French Medical Research Institute).
A. Description
Different kinds of cerebral activities can be used to design a brain-computer interface. Each of them needs a specific signal processing method which must take advantage of our knowledge about neurophysiology of the cognitive task. For example, neurophysiological basis of motor imagery have been widely studied and have yielded different brain-computer interfaces based on event-related synchronizations and desynchronizations. Those phenomena result in an in-crease or a dein-crease of spectral power in specific bands.
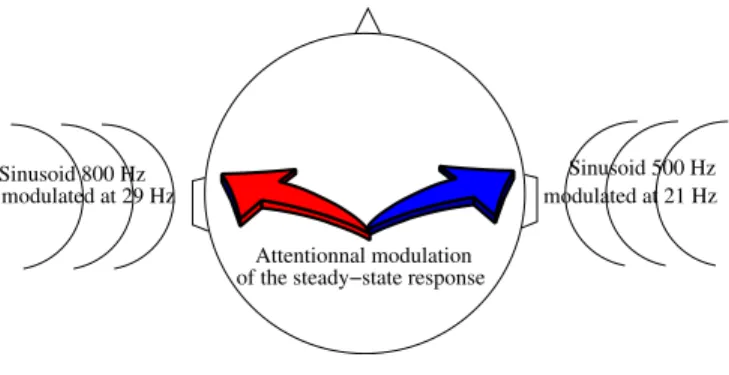
This experiment designed at the INSERM relies on steady-state evoked potentials. When a cerebral activity gets syn-chronized with a stimulus, it is called steady-state evoked potentials. Such responses can be visual (light flashes are sent at specific frequencies), auditives (the stimulus is a pure sinusoidal sound) or somatosensory (grasp an object vibrating at a certain frequency implies a synchronization of different brain areas around the sensorimotor cortex). The experiment described here go further: the idea is that the strength of an auditive steady-state potential can be modulated by the attention. Thus, in the case of a dichotic binaural listening (each ear is stimulated with a different sound), it is postulated that the strength of the steady-state response is alternatively modulated when the subject is concentrated on one or the other sound. Figure 1 summarizes the principle of this experiment.
Sinusoid 800 Hz modulated at 29 Hz
of the steady−state response Attentionnal modulation
modulated at 21 Hz Sinusoid 500 Hz
Fig. 1. Steady-state auditive evoked potentials experiment. During a dichotic binaural listening (right ear: 500 Hz sinusoidal sound modulated at 21 Hz, left ear: 800 Hz sinusoidal sound modulated at 29 Hz), it is stated that there exists an effect of the attention on the strength of the steady-state response.
A brain-computer interface based on this principle can be easily imagined: if we can detect where is focused the atten-tion of the subject, we can assign to each sound a specific command. Lastly, let us remind that cortical synchronizations are observed and searched with modulation stimulus (21 or 29 Hz).
B. Analysis
Even if this method is an excellent candidate to decrease the constraints of the current brain-computer interfaces, it raises some validation issues: we indeed know what the subject is supposed to do (to draw his attention on one of the sounds) but we do not know either what he is really doing or what difficulties he encounters (does he really succeed in concentrating?). Therefore two signal processing methods have been used to try to increase our confidence about the results obtained.
Recording conditions: Magnetoencephalographic (MEG) signals from 275 sensors are sampled at 600 Hz. A stereo-headphone is used by the subject to listen to the stimuli.
Connectivity networks: Neurophysiological bases of the described principle are well-known and can be easily used: we are looking for signals inside the brain which synchronizes at 21 or 29 Hz. Thus the first step of the study consists in filtering the observed signals at 21 and 29 Hz, which yields two different sets of signals. Frequency-specific signals are then used to build time-varying graphs. Although each one of the 275 sensors are used to construct the network and compute the global efficiencies, only about half of them are used as features. Global efficiencies of sensors of the left part of the brain computed from 29-Hz signals are kept. Similarly, global efficiencies of sensors of the right part of the brain computed from 21-Hz signals are equally kept. This methods gives 264 features to classify the data (global efficiencies from the central part of the brain are thrown away). A support vector machine is then used to perform the classification.
Spectral analysis: A simpler method is also used in order to compare the results and to increase the confidence about the success of the task. As a first step, signals from the left part of the brain are filtered using a pass-band filter centered on 29 Hz and signals from the right part of the brain are filtered using a pass-band filter centered on 21 Hz. As for the previous method, the sensors from the central part of the brain are not used. This yields 264 features, which are classified by a SVM.
C. Results
During a preliminary study, we focused our attention on the variance of the global efficiency (method 1) and the variance of the power spectral density estimations (method 2) as a function of the length of the windows considered. Each method is quite instable (high variance) for windows of length less than 2400 points. As a consequence, we focus here on windows of 3200 samples (about 5.3 seconds). A delay of 60 samples is applied between two successive
analyses. Lastly, pass-band filters are Finite Impule Response Filters of 200 coefficients. Such a number of coefficients is necessary to have a good resolution power and thus discriminate between 21 and 29 Hz.
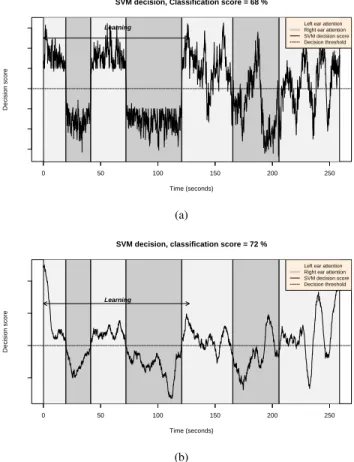
Figure 2 presents the results of the discrimination between the left-ear attention condition and the right-ear attention condition. For this experiment, recordings have been splitted into two sets: the first one is used for the training of the classifier and the second one is used as a test set. Figure 2(a) is obtained using the method presented here based on the topological evolution of connectivity graphs. Figure 2(b) shows classification results obtained using the method based on spectral density estimations. Those two methods give quite similar classification results.
0 500 1000 1500 2000 2500 −3 −2 −1 0 1 2 3
SVM decision, Classification score = 68 %
Time (seconds)
Decision score
0 50 100 150 200 250
Learning Left ear attentionRight ear attention
SVM decision score Decision threshold (a) 0 500 1000 1500 2000 2500 −5 0 5 10
SVM decision, classification score = 72 %
Time (seconds)
Decision score
0 50 100 150 200 250
Learning
Left ear attention Right ear attention SVM decision score Decision threshold
(b)
Fig. 2. Classification results for the steady-state auditive evoked potentials experiment. Fig. 2(a): classification results using the method based on complex networks (decision scores obtained by the SVM). Darkgray areas correspond to an attention focused on right ear sound, lightgray correspond to an attention focused on left ear. Fig. 2(b): classification results using the method based on spectral density estimation (decision scores obtained by the SVM). Darkgray areas correspond to an attention focused on right ear sound, lightgray correspond to an attention focused on left ear. Classification scores are computed as regard as theoretical task which is quite uncertain.
IV. DISCUSSION
For both methods, results remain too low to be able to design a user-friendly and reliable bracomputer in-terface. Nevertheless, the principle described here seems to be promising. For example, such a principle can be easily used to combine brain-computer interfaces, i.e. using
different neurophysiological bases as commands (steady-state auditive evoked potentials and motor imagery). Thus such a complementary approach would be of great interest to design brain-computer interfaces.
● ● ● ● ● ● ● ● ● ● ● ● ● ● ● ● ● ● ● ● ● ● ● ● ● ● ● ● ● ● ● ● ● ● ● ● ● ● ● ● ● ● ● ● ● ● ● ● ● ● ● ● ● ● ● ● ● ● ● ● ● ● ● ● ● ● ● ● ● ● ● ● ● ● ● ● ● ● ● ● ● ● ● ● ● ● ● ● ● ● ● ● ● ● ● ● ● ● ● ● ● ● ● ● ● ● ● ● ● ● ● ● ● ● ● ● ● ● ● ● ● ● ● ● ● ● ● ● ● ● ● ● ● ● ● ● ● ● ● ● ● ● ● ● ● ● ● ● ● ● ● ● ● ● ● ● ● ● ● ● ● ● ● ● ● ● ● ● ● ● ● ● ● ● ● ● ● ● ● ● ● ● ● ● ● ● ● ● ● ● ● ● ● ● ● ● ● ● ● ● ● ● ● ● ● ● ● ● ● ● ● ● ● ● ● ● ● ● ● ● ● ● ● ● ● ● ● ● ● ● ● ● ● ● ● ● ● ● ● ● ● ● ● ● ● ● ● ● ● ● ● ● ● ● ● ● ● ● ● ● ● ● ● ● ● ● ● ● ● ● ● ● ● ● ● ● ● ● ● ● ● ● ● ● ● ● ● ● ● ● ● ● ● ● ● ● ● ● ● ● ● ● ● ● ● ● ● ● ● ● ● ● ● ● ● ● ● ● ● ● ● ● ● ● ● ● ● ● ● ● ● ● ● ● ● ● ● ● ● ● ● ● ● ● ● ● ● ● ● ● ● ● ● ● ● ● ● ● ● ● ● ● ● ● ● ● ● ● ● ● ● ● ● ● ● ● ● ● ● ● ● ● ● ● ● ● ● ● ● ● ● ● ● ● ● ● ● ● ● ● ● ● ● ● ● ● ● ● ● ● ● ● ● ● ● ● ● ● ● ● ● ● ● ● ● ● ● ● ● ● ● ● ● ● ● ● ● ● ● ● ● ● ● ● ● ● ● ● ● ● ● ● ● ● ● ● ● ● ● ● ● ● ● ● ● ● ● ● ● ● ● ● ● ● ● ● ● ● ● ● ● ● ● ● ● ● ● ● ● ● ● ● ● ● ● ● ● ● ● ● ● ● ● ● ● ● ● ● ● ● ● ● ● ● ● ● ● ● ● ● ● ● ● ● ● ● ● ● ● ● ● ● ● ● ● ● ● ● ● ● ● ● ● ● ● ● ● ● ● ●
Fig. 3. Connectivity networks during a left ear attention task (figure left) and right ear attention (figure right)
Because of the use of magnetoencephalography in this study to acquire signals, everyday life applications are not straigthforward. Yet the same principle can be easily ex-tended to an electroencephalographic study. Spatial resolu-tion is indeed not really a limiting factor.
One can observe that graph analysis gives noisier results. The main cause is the use of correlation measures, which thus have to be replaced by a more stable one.
The method using graph analysis shows similar results in comparison to a simpler method based on the power spectrum of time series. The use of connectivity graphs has already shown to be of great interest in neuroscience to explore the role of brain regions at rest [1]. In the context of BCI, we have shown that a simple, univariate method based on the power spectrum of time series is also able to analyse signals from an experiment based on auditory attention. However, the use of a multivariate method such as graph connectivity in this context is also motivated by the possibility of improvements for further experiments like motor imagery. The connectivity graphs will allow us to select the most relevant sensors to take into account in the classification, for example in looking at category of nodes like hubs. Finally, the method using connectivity graphs will allow us to use more specialized characteristics (such as clustering, modularity. . . ) in adequation with the experiments and nature of the data. Lastly, source separation could be able to extract the different dynamical causes of an observed graph. This will be done by considering a graph as a linear mixture of statistically independent graphs.
V. CONCLUSION
A new experiment, designed and carried out at the IN-SERM was presented in this article. It is based on the modulation effect of the attention on the steady-state audi-tive evoked responses. We presented two different analysis
methods to discriminate signals acquired using a magnetoen-cephalography. Both of them give similar results. Although they need some improvements (such as a better sensor selection before classification), our results suggest that this kind of brain-computer interface is promising.
Some improvements are underway: delayed correlation measures can be easily introduced to take into account a possible delay of neuronal communication; correlation can be replaced by a non symmetric measure which could represent a direction of communication between different cortical areas; weighted links (according to the correlation value) could lead to a better understanding of the involved phenomena. Lastly it could be of great interest to use this method in the source space instead of the sensor space. Such an improvement could be based on two different approaches: by solving the electromagnetic inverse problem; or by looking for time-selective independent sources with blind source separation methods.
VI. ACKNOWLEDGMENTS
This work was supported by the French Ministry of Defense (Délégation Générale pour l’Armement – DGA) and the US National Institute of Health (NIH). This work is also part of the Open-ViBE project (Open-Source platform for a Virtual Brain Environment) supported by the French National Research Agency (Agence Nationale de la Recherche – ANR). This work was also funded by the European program of Cooperation in the Field of Scientific and Technical Research (COST B27 – Electric Neuronal Oscillations and Cognition) and Nova Tech EEG Inc.
REFERENCES
[1] Sophie Achard and Ed Bullmore. Efficiency and cost of economical brain functional networks. PLoS Comput Biol, 3(2):e17, Feb 2007. [2] Niels Birbaumer and Leonardo G Cohen.
Brain-computer-interfaces(BCI): Communication and restoration of movement in paral-ysis. J Physiol, Jan 2007.
[3] S. Boccaletti, V. Latora, Y. Moreno, M. Chavez, and D. U. Hwang. Complex networks: Structure and dynamics. Physics Reports, 424(4-5):175–308, February 2006.
[4] M. Congedo, F. Lotte, and A. Lécuyer. Classification of movement intention by spatially filtered electromagnetic inverse solutions. Phys
Med Biol, 51(8):1971–1989, Apr 2006.
[5] José del R Millán and Josep Mouriño. Asynchronous bci and local neural classifiers: an overview of the adaptive brain interface project.
IEEE Trans Neural Syst Rehabil Eng, 11(2):159–161, Jun 2003. [6] V. Latora and M. Marchiori. Efficient behavior of small-world
networks. Phys Rev Lett, 87(19):198701, Nov 2001.
[7] S. G. Mason and G. E. Birch. A brain-controlled switch for asyn-chronous control applications. IEEE Trans Biomed Eng, 47(10):1297– 1307, Oct 2000.
[8] G. Pfurtscheller, C. Brunner, A. Schlögl, and F. H. Lopes da Silva. Mu rhythm (de)synchronization and eeg single-trial classification of different motor imagery tasks. Neuroimage, 31(1):153–159, May 2006. [9] David Rudrauf, Antoine Lutz, Diego Cosmelli, Jean-Philippe Lachaux, and Michel Le Van Quyen. From autopoiesis to neurophenomenology: Francisco Varela’s exploration of the biophysics of being. Biol Res, 36(1):27–65, 2003.
[10] Reinhold Scherer, Gernot R Müller, Christa Neuper, Bernhard Graimann, and Gert Pfurtscheller. An asynchronously controlled EEG-based virtual keyboard: improvement of the spelling rate. IEEE Trans
Biomed Eng, 51(6):979–984, Jun 2004.
[11] T.M. Vaughan. Guest editorial brain-computer interface technology: a review of the second international meeting. Neural Systems and
Rehabilitation Engineering, IEEE Transactions on [see also IEEE Trans. on Rehabilitation Engineering], 11(2):94–109, June 2003.