Homeostatic Control of Slow-wave and Spindle Frequency Activity during Human Sleep: Effect of Differential Sleep Pressure and Brain Topography
9
0
0
Texte intégral
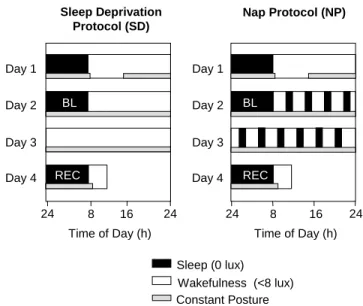
(2) repercussions on frequency- and derivation-specific SFA during NREM sleep has, to our knowledge, not been reported. In the present study, EEG spectra during recovery sleep after 40 h of either total sleep deprivation or a 75/150 min sleep–wake (nap) schedule were compared. The build-up of sleep pressure during scheduled wakefulness could be attenuated significantly by intermittent naps (Cajochen et al., 2001; Knoblauch et al., 2001). We aimed at assessing the effect of differential levels of sleep pressure on the dynamics of EEG power density along the antero-posterior axis, in particular in the slow wave- and spindle frequency range. We hypothesized that the reciprocal homeostatic regulation of SWA and SFA depends on brain location. We further hypothesized that the response to differential sleep pressure conditions in the spindle frequency range (12–16 Hz) is not uniform.. Materials and Methods Subject Selection Subjects were recruited via poster advertisements at the University of Basel. A fter successfully completing a brief telephone screening, they received detailed information on the study and three questionnaires: a morning–evening-type questionnaire (Torsvall and Akerstedt, 1980), the Pittsburgh Sleep Quality Index (PSQI), and an extensive questionnaire covering sleep habits, sleep quality, life habits, physical health and medical history. Subjects with self-reported sleep complaints (PSQI score ≥5) as well as extreme morning or evening types (score <12 or >23) were excluded from participation. Other exclusion criteria were chronic or current major medical illness or injury, smoking, medication or drug consumption, shift work within 3 months or transmeridian travel within 1 month prior to the study, excessive caffeine consumption and excessive physical activity. Subjects who did not fulfill any of the above exclusion criteria were invited to the laboratory and interviewed. They spent an adaptation night in the laboratory to test his or her ability to sleep in a new environment and to exclude primary sleep disorders (i.e. insomnia). A physical examination excluded medical disorders. All subjects gave signed informed consent, and the study protocol, screening questionnaires and consent form were approved by the Ethical Committee of the Cantons Basel-Stadt and Baselland. Subjects Ten healthy subjects (six male, four female, age range 24–32 years, mean: 27.1 ± 2.3 SEM) were studied. Female subjects started the study on days 1–5 after the onset of menstruation in order to complete the entire study block within their follicular phase. Three female subjects used oral contraceptives. During the week preceding the study (baseline week), subjects were instructed to maintain a regular sleep–wake schedule (bed and wake times within ±30 min of self-selected target time). The latter was verified by a wrist activity monitor (Cambridge Neurotechnologies®, Cambridge, UK) and sleep logs. They were also instructed to refrain from excessive physical activity, caffeine and alcohol consumption. Drug-free status was verified upon admission via urine toxicologic analysis (Drug-Screen Card Multi-6 for amphetamines, benzodiazepines, cocaine, methadone, opiates and tetrahydrocannabinol; von Minden GmbH, Moers, Germany). A ll 10 subjects completed the study without any complaints. Design Subjects underwent two study blocks in a balanced crossover design: a sleep-deprivation (SD) and a nap protocol (NP) (Fig. 1). In either protocol, subjects reported to the laborator y in the evening for an 8 h sleep episode. The timing of their sleep–wake schedule was calculated in such a way that the sleep episode was centered at the midpoint of each subject’s habitual sleep episode as assessed by actigraphy during the baseline week. On the next afternoon (day 1) electrodes and thermosondes were attached. After a second 8 h sleep episode (baseline night) at their habitual bedtime, a 40 h sleep deprivation under constant routine (CR) conditions or a 40 h nap protocol under constant posture conditions (near recumbent during wakefulness and supine during scheduled sleep. Sleep Deprivation Protocol (SD). Nap Protocol (NP). Day 1. Day 1 BL. Day 2. BL. Day 2. Day 3. Day 3 REC. Day 4 24. REC. Day 4 8. 16. Time of Day (h). 24. 24. 8. 16. 24. Time of Day (h) Sleep (0 lux) Wakefulness (<8 lux) Constant Posture. Figure 1. Overview of the protocol design. Subjects entered the lab for an 8 h nocturnal sleep episode followed by a day to adjust to the <8 lux experimental conditions. After the second 8 h night (baseline, BL), either a 40 h sleep deprivation or a 40 h multiple nap paradigm (10 75/150min sleep/wake cycles) under constant posture conditions was carried out, followed by an 8 h recovery night (REC). Black bars indicate scheduled sleep episodes (light levels: 0 lux), white bars indicate scheduled episodes of wakefulness (light levels: <8 lux), hatched bars indicate controlled posture (semi-recumbent during wakefulness and supine during scheduled sleep).. episodes) was carried out [for details of the CR method see Cajochen et al. (Cajochen et al., 1999b)]. In the NP protocol, subjects completed 10 alternating cycles of 75 min of scheduled sleep and 150 min of scheduled wakefulness. The light levels were <8 lux (typically 3–5 lux at the angle of gaze) during scheduled wakefulness and 0 lux during scheduled sleep. The protocol ended with a 8 h recovery sleep episode starting again at habitual bedtime. After a 1–4 week interval, the subjects started their second study block. Sleep Recording and Analysis Sleep was recorded polysomnographically using the VITAPORT digital ambulatory sleep recorder (Vitaport-3 digital recorder, TEMEC Instruments BV, Kerkrade, The Netherlands). Twelve EEGs, two electrooculograms (EOG), one submental electromyogram (EMG) and one electrocardiogram (ECG) signal were recorded. All signals were on-line digitized (12 bit A D converter, 610 µV/bit; storage sampling rate at 128 Hz for the EEG) and digitally filtered at 30 Hz (fourth-order Besseltype anti-aliasing filters, total 24 dB/Oct.) using a time constant of 1.0 s. The raw signals were stored on-line on a Flash R A M Card (Viking, Rancho Santa Margarita, USA) and downloaded off-line to a PC hard drive. EEG artifacts were detected by an automated artifact detection algorithm. This algorithm was based on a instantaneous frequency analysis, which yields the amplitude envelope and the frequency of eight band-filtered components instantaneously at a rate of eight per second. Low-frequency (as movement) artifacts, mid-frequency (as ECG interference) and highfrequency (as EMG) artifacts are detected individually if the respective instantaneous frequencies and amplitudes in the relevant frequency bands are not within preset ranges (CASA, 2000 Phy Vision BV, Kerkrade, The Netherlands). The EEGs were off-line subjected to spectral analysis using a fast Fourier transform (FFT, 10% cosine 4 s window) resulting in a 0.25 Hz bin resolution. For data reduction, artifact-free 4 s epochs were averaged over 20 s epochs. Sleep stages were visually scored on a 20 s basis (Vitaport Paperless Sleep Scoring Software) according to standard criteria (Rechtschaffen and Kales, 1968). EEG power spectra were calculated during NREM sleep in the frequency range from 0.5 to 32 Hz. Here, we only report EEG data derived from the midline (Fz, Cz, Pz, Oz) referenced against linked mastoids (A1, A2) in the range of 0.5–25 Hz.. Cerebral Cortex Oct 2002, V 12 N 10 1093.
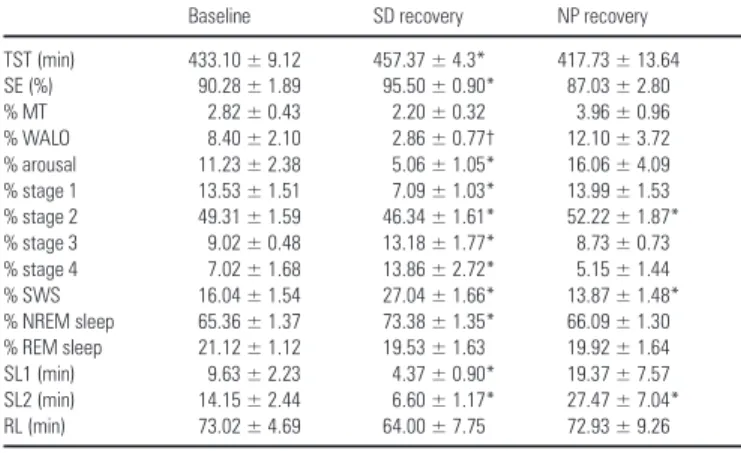
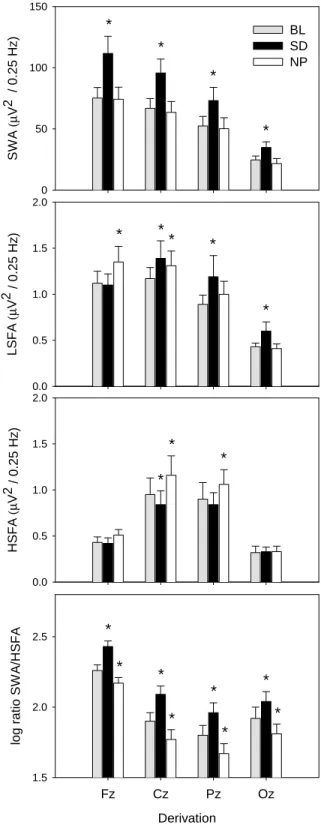
(3) Statistics The statistical packages SAS® (Version 6.12, SAS® Institute Inc., Cary, NC) and Statistica® [Statistica for Windows, StatSoft Inc. (1995)] were used. Statistical analyses did not reveal any significant difference between the two baseline nights, neither for sleep stage measures nor for EEG power density in any of the frequency bins. Therefore, for the sake of simplicity, the two baseline nights were pooled. In order to analyze the time course of sleep stages and EEG power density in the course of the sleep episodes, the 8 h sleep episodes were subdivided into 2 h intervals after the first occurrence of stage two (i.e. sleep onset). This resulted in the fourth 2 h interval being shorter than 2 h and of variable length for each subject and night. To correct for this, relative values for sleep stage variables (% of total sleep time) are reported. Values of each interval were compared with values of the corresponding intervals during the baseline night. In one case, artifacts considerably disturbed EEG recordings in intervals 3 and 4. This subject was excluded for the time course analysis of the visual scoring data. In the topographical analysis of SWA, high spindle frequency activity (HSFA) and low spindle frequency activity (LSFA), a first statistical analysis with the four separate EEG derivations (Fz, Cz, Pz, Oz) did not yield consistent significant interactions between condition × derivation. Therefore, derivations were pooled in order to obtain consistent significant interaction in the ANOVA. The frontal and central derivation (Fz + Cz) and the parietal and occipital derivation (Pz + Oz) were pooled for SWA and LSFA; the frontal and occipital derivation (Fz + Oz) and the central and parietal derivation (Cz + Pz) were pooled for HSFA. One-, two- and three-way analyses of variance for repeated measures (rA NOVA) were performed. All P values derived from rANOVAs were based on Huynh–Feldt’s (H–F) corrected degrees of freedom, but the original degrees of freedom are reported. For post hoc comparisons, the Duncan’s multiple range test and t-tests with correction for multiple comparisons (Curran-Everett, 2000) were used.. Results Sleep Measures Derived from Visual Scoring Sleep during Naps In order to test whether the subjects were able to sleep sufficiently during the NP protocol, the amount of total sleep time (TST; NREM sleep + REM sleep + stage 1) and relative sleep stages (percent of TST) during the baseline night (BL), throughout the 40 h episode of the NP protocol and during the recovery night (REC) were calculated for each subject and then averaged over subjects. Across the total of 12.5 h scheduled sleep episodes (10 naps each of 75 min duration), TST did not significantly differ from accumulated TST in the 8 h baseline sleep episode [459.27 ± 27.52 versus 434.93 ± 8.98 min; F(2,18) = 1.34, P = 0.28]. However, the proportion of sleep stages was different. The percentage of SWS was significantly higher than during baseline (19.71 ± 1.73 versus 15.99 ± 1.33%, P < 0.05), whereas REM sleep percentage was significantly reduced (15.70 ± 1.92 versus 21.59 ± 1.37%, P < 0.05, Duncan’s multiple range test). Details about the changes in sleep structure throughout the NP protocol are summarized in Knoblauch et al. (Knoblauch et al., 2001); spectral EEG changes will be reported elsewhere. Recovery Nights Table 1 summarizes all-night sleep measures (% of total sleep time) for the average baseline night and the SD and NP recovery night. A one-way rANOVA with the factor condition (BL, SD, NP) yielded a significant variation in all measures [F(2,18) > 6.0, P < 0.03] except for REM sleep, movement time (MT) and latency to REM sleep. Post hoc comparisons revealed that TST, sleep efficiency [SE; (TST/time in bed)×100], NREM sleep, SWS, stage 3 and stage 4 were significantly enhanced in the recovery night following the SD protocol compared with the baseline night at. 1094 Homeostasis of Slow-wave and Sleep Spindle Frequency Activity • Knoblauch et al.. Table 1 Sleep measures derived from visual scoring of the average baseline night and the SD, and NP recovery night (mean ± SEM, n=10). TST (min) SE (%) % MT % WALO % arousal % stage 1 % stage 2 % stage 3 % stage 4 % SWS % NREM sleep % REM sleep SL1 (min) SL2 (min) RL (min). Baseline. SD recovery. NP recovery. 433.10 ± 9.12 90.28 ± 1.89 2.82 ± 0.43 8.40 ± 2.10 11.23 ± 2.38 13.53 ± 1.51 49.31 ± 1.59 9.02 ± 0.48 7.02 ± 1.68 16.04 ± 1.54 65.36 ± 1.37 21.12 ± 1.12 9.63 ± 2.23 14.15 ± 2.44 73.02 ± 4.69. 457.37 ± 4.3* 95.50 ± 0.90* 2.20 ± 0.32 2.86 ± 0.77† 5.06 ± 1.05* 7.09 ± 1.03* 46.34 ± 1.61* 13.18 ± 1.77* 13.86 ± 2.72* 27.04 ± 1.66* 73.38 ± 1.35* 19.53 ± 1.63 4.37 ± 0.90* 6.60 ± 1.17* 64.00 ± 7.75. 417.73 ± 13.64 87.03 ± 2.80 3.96 ± 0.96 12.10 ± 3.72 16.06 ± 4.09 13.99 ± 1.53 52.22 ± 1.87* 8.73 ± 0.73 5.15 ± 1.44 13.87 ± 1.48* 66.09 ± 1.30 19.92 ± 1.64 19.37 ± 7.57 27.47 ± 7.04* 72.93 ± 9.26. For sleep stages, relative values (percent of total sleep time) are shown. TST = total sleep time (stages 1–4 + REM sleep), SE = sleep efficiency [(TST/time in bed) × 100], MT = movement time, WALO = wakefulness after lights off, arousal = WALO + MT, SL1 = latency to stage 1 (min), SL2 = latency to stage 2 (min), RL = latency to REM sleep (min). For SL1, SL2 and RL, statistics were applied on log-transformed values. An asterisk indicates significant differences to the average baseline night (P<0.05), † indicates a tendency (P<0.1, Duncan’s multiple range test).. the expense of stage 1 and 2 and the arousal index (WALO + MT) (for statistics see Table 1). WALO (wakefulness after lights off) tended to be reduced (P = 0.06). Sleep latency to stage 2 and to stage 1 was significantly reduced. SWS in the recovery night after the NP protocol was significantly reduced whereas stage 2 was significantly enhanced, and the latency to stage 2 was significantly longer (see Table 1). Although there was no significant variation in all-night REM sleep, the time course of REM sleep throughout the night was significantly different in the NP recovery night compared with baseline. This was analyzed by a two-way rA NOVA with the factors condition (BL, SD, NP) and interval (2 h interval 1–4, see Materials and Methods), which yielded a significant interaction of these two factors [F(6,48) = 3.53; P < 0.01]. Post hoc comparisons showed that REM sleep was significantly increased in interval 1 (P < 0.05) and tended to be decreased (P = 0.06) in inter val 4. REM sleep in NP did not show the usual overall increase across the night (P = 0.48 for intervals 1–2 and P = 0.08 for intervals 1–4), as it did in BL (P < 0.01). EEG Power Spectra during NREM Sleep: All-night Absolute EEG Power Density (0.5–25 Hz) A ll-night absolute EEG power density in each frequency bin between 0.5 and 25 Hz for the midline derivations (Fz, Cz, Pz, Oz) during NREM sleep is illustrated in Figure 2 for the average baseline night (BL) and the SD and NP recovery night. A two-way rA NOVA with the factors derivation (Fz, Cz, Pz, Oz) and condition (BL, SD, NP) revealed a significant interaction in the following frequency bins: 0.5–5, 8.75–10.25, 12.25–13.25, 13.75–16.5, 24–24.5 and 24.75–25.5 Hz (P < 0.05 for each frequency bin, bottom panel of Fig. 2). Visual inspection of the cur ves indicated a prominent spindle peak in the central, parietal and occipital derivation, whereas it was less pronounced in the frontal derivation. All-night SWA, LSFA and HSFA EEG power density in the 0.5–5 Hz (SWA), in the 12.25– 13.25 Hz (LSFA) and the 13.75–16.5 Hz (HSFA) range were each collapsed into bands. The frequency ranges for these bands were.
(4) 150. SWA (µV2 / 0.25 Hz). *. BL SD NP. * 100. *. *. 50. LSFA (µV2 / 0.25 Hz). 0 2.0. *. *. 1.5. *. *. 1.0. * 0.5. HSFA (µV2 / 0.25 Hz). 0.0 2.0. chosen based on a significant interaction in the two-way rANOVA with the factors derivation and condition (see Fig. 2). SWA, LSFA and HSFA are plotted for each derivation and night in Figure 3 (panels 1–3). A two-way rANOVA with the factors derivation and condition was performed and showed a significant interaction of these two factors for SWA [F(6,54) = 16.22; P < 0.01], LSFA [F(6,54) = 7.05; P < 0.01] and HSFA [F(6,54) = 6.47; P < 0.01]. For SWA, post hoc comparisons indicated that SWA significantly decreased from Fz to Cz to Pz to Oz in BL, SD and NP (Fig. 3, panel 1; P < 0.01, Duncan’s multiple range test). Compared with BL, SWA was significantly increased after SD (P < 0.01, Duncan’s multiple range test) and not significantly changed in NP (P > 0.05) for all derivations. LSFA LSFA was significantly enhanced after SD in all derivations (Fig. 3, panel 2; P < 0.01, Duncan’s multiple range test) except for Fz (P = 0.77). LSFA after NP showed a significant increase in the more frontal derivations Fz (P < 0.01) and Cz (P < 0.05), tended to be enhanced in Pz (P = 0.09) and was not significantly changed in Oz (P = 0.77).. *. *. 1.0. 0.5. 0.0. log ratio SWA/HSFA. Figure 2. EEG power spectra during NREM sleep of the midline derivations (Fz, Cz, Pz, Oz) for the average baseline night (BL, 왔) and the SD (쎲) and NP (쑗) recovery night. Mean values (n=10) are shown for each 0.25 Hz bin in the range of 0.5–25 Hz. The lowest panel shows F-values (gray bars) of a two-way rANOVA with the factors derivation (Fz, Cz, Pz, Oz) and condition (BL, SD, NP). Black bars near the abscissa represent frequency bins showing a significant interaction of these two factors (P < 0.05).. *. 1.5. 2.5. * *. *. *. * 2.0. *. *. *. 1.5. Fz. Cz. Pz. Oz. Derivation Figure 3. Topographical distribution and effects of SD and NP on selected EEG frequency bands (panels 1–4). Values of SWA (0.5–5 Hz), LSFA (12.25–13.25 Hz), HSFA (13.75–16.5 Hz) and the logarithmic SWA–HSFA ratio for the averaged baseline night (BL, gray bars), the SD (black bars) and NP (white bars) recovery night are depicted for the midline derivations along the antero-posterior axis (mean ± SEM, n=10). Asterisks indicate significant differences to baseline values (P < 0.05, Duncan’s multiple range test).. HSFA The SD and NP condition elicited opposite effects on HSFA: there was a significant increase during the NP recovery night in Cz and. Cerebral Cortex Oct 2002, V 12 N 10 1095.
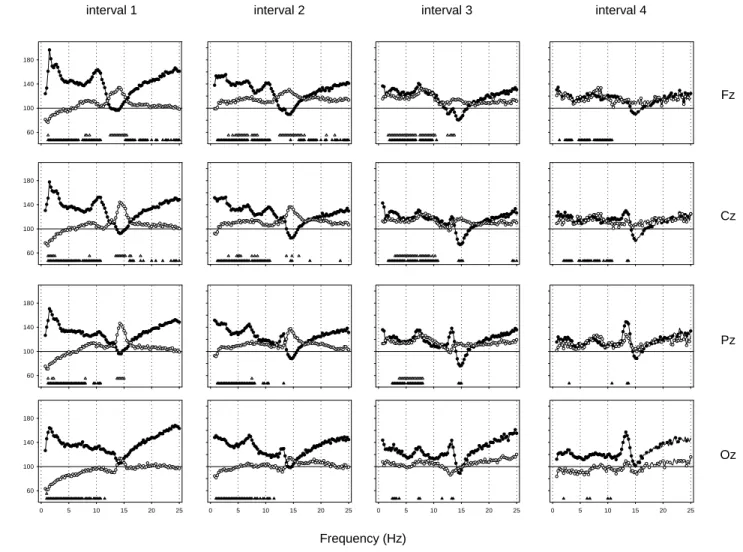
(5) interval 1. interval 2. interval 3. interval 4. 180. 140. Fz 100. 60. 180. 140. % of Baseline. Cz 100. 60. 180. 140. Pz 100. 60. 180. 140. Oz 100. 60 0. 5. 10. 15. 20. 25. 0. 5. 10. 15. 20. 25. 0. 5. 10. 15. 20. 25. 0. 5. 10. 15. 20. 25. Frequency (Hz) Figure 4. Relative EEG power spectra during NREM sleep in the midline derivations (Fz, Cz, Pz, Oz) for 2 h intervals after sleep onset (mean, n = 10). For each frequency bin, values for the SD (쎲) and the NP (쑗) recovery night are expressed relative to corresponding values of the averaged baseline night (=100%). Triangles near the abscissa indicate frequency bins for which a significant difference to baseline was found in the SD (왖) and the NP (왕) protocol (P < 0.05, paired t-test with correction for multiple comparisons).. Pz (P < 0.01, Duncan’s multiple range test), whereas in the SD recovery night HSFA was significantly decreased in Cz (Fig. 3, panel 3; P < 0.05). HSFA in the frontal and occipital derivation was not significantly changed (P > 0.05). Topography of LSFA and HSFA For analyzing the different topographical distribution of LSFA and HSFA, values in the frontal and central derivation and in the parietal and occipital derivation were added together for LSFA [(Fz + Cz), (Pz + Oz)] and in the frontal and occipital derivation and in the central and parietal derivation for HSFA [(Fz + Oz), (Cz + Pz); see Methods]. HSFA exhibited a centro-parietal dominance in all conditions (Fig. 3, panel 3, P < 0.05, Duncan’s multiple range test) and LSFA a fronto-central dominance (Fig. 3, panel 2, P < 0.05, Duncan’s multiple range test). SWA–HSFA Ratio The lowest panel in Figure 3 depicts the logarithmic ratio between SWA and HSFA. A two-way rANOVA with the factors derivation and condition was performed and showed a significant interaction [F(6,54) = 6.14; P < 0.01]. Post hoc comparisons to baseline showed that the ratio was enhanced in SD and reduced in NP in all derivations (P < 0.05, Duncan’s multiple range test). The ratio significantly decreased from Fz to. 1096 Homeostasis of Slow-wave and Sleep Spindle Frequency Activity • Knoblauch et al.. Cz to Pz and was significantly higher in Oz than in Pz for all conditions. Time Course of Relative EEG Power Density (0.5–25 Hz) In a next step, EEG power density during NREM sleep for each frequency bin and derivation in the SD and NP recovery night was expressed as a percentage of the corresponding value of the averaged baseline night for each 2 h interval (Fig. 4). A two-way rANOVA with the factor condition (BL, SD, NP) × time (intervals 1–4) and a paired t-test corrected for multiple comparisons (NP versus BL, SD versus BL) was performed for each derivation and frequency bin separately. SD Recovery Slow Wave Range (0.5–5 Hz) There was a global increase in NREM sleep EEG power density over a broad frequency range. The largest increase in the slow wave range occurred in interval 1 (1–5 Hz in Fz, Cz and Pz, 0.75–5 Hz in Oz). Theta Range (5–8 Hz) EEG power density in the theta range was significantly increased in most of the theta bins in intervals 1 and 2 for all derivations,.
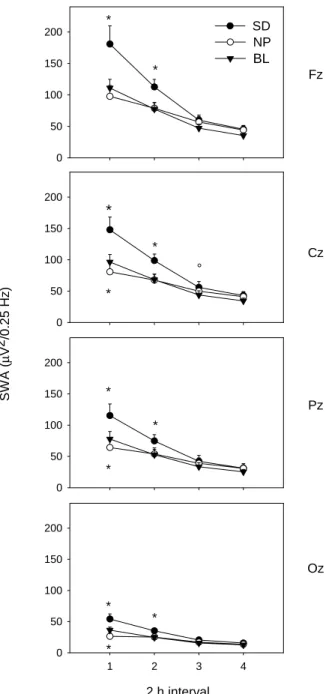
(6) in interval 3 for Fz, Cz, Pz and in interval 4 for Fz and Cz. Some theta bins in inter vals 3 and 4 for Oz were also significantly increased.. * 150. Alpha Range (8–12 Hz) EEG power density was significantly increased in a broad part of the alpha frequency range for all derivations in intervals 1 and 2 and in the frontal and central derivation in intervals 3 and 4. A distinct peak in relative alpha activity appeared in the first two intervals in the frontal and central derivation.. Beta range (>16 Hz) EEG power density between 16.25 and 25 Hz was significantly increased at the beginning of the night in the fronto-central region (in interval 1 in Fz and Cz and in interval 2 in Fz). NP Recovery Slow Wave Range (0.5–5 Hz) EEG power density in the lower slow wave range (0.75–2.25 Hz) was significantly decreased in interval 1 in all derivations (Fz: 1–1.25 Hz, Cz: 1–2.5 Hz, Pz: 1–1.25 Hz and 1.75–2.25 Hz, Oz: 0.75–1 Hz). In the inter vals 2–4, EEG power density in this frequency range was not significantly changed. EEG power density in the higher slow wave range (>2.75 Hz) was significantly enhanced in inter val 2 in Fz (3–3.25 Hz, 3.75–4 Hz, 4.25–5 Hz) and Cz (3–3.25 Hz, 4.5–5.5 Hz), and in interval 3 in Fz (1.5–5 Hz), Cz (2.75–5 Hz) and Pz (3.5–5 Hz).. Alpha Range (8–12 Hz) EEG power density was significantly increased in some of the bins, particularly in the fronto-central region during interval 3. Spindle Frequency Range (12–16 Hz) EEG power density in the low and high spindle frequency range showed similar patterns after the NP protocol – either enhanced or unaffected – and did not show the bimodal pattern observed after SD. The increase was significant in inter val 1 for Fz (12.25–15.5 Hz), for Cz (13.25–15.25 Hz, 15.75–16.25 Hz) and for Pz (13.5–15 Hz), in interval 2 for Fz (12.25–16.5 Hz) and Cz (13.5–13.75 Hz, 14.5–14.75 Hz, 15.75–16 Hz) and in interval 3 for Fz (12.25–12.5 Hz, 12.75–13.75 Hz). Beta Range (>16 Hz) EEG power density above 16 Hz was not significantly affected by the NP for any of the derivations.. Fz. 50 0. 200. * 150. * 100 50. Cz °. *. 0. 200 150. * Pz *. 100 50. * 0. 200 150. Oz. 100. * 50 0. Theta Range (5–8 Hz) There was a significant increase in some frequency bins in the theta range in interval 2 (Fz and Cz) and in interval 3 (Fz, Cz and Pz).. *. 100. SWA (µV2/0.25 Hz). Spindle Frequency Range (12–16 Hz) A bimodal pattern emerged in the spindle frequency range. While spindle frequency activity (SFA) was unchanged in interval 1, EEG power density in the upper spindle frequency range was significantly decreased in interval 2 in Fz (14.25–14.5 Hz) and Cz (14.25–14.75 Hz) and in inter val 3 in Cz (14.25– 15.25 Hz) and Pz (14.25–15 Hz). A distinct peak in relative LSFA emerged in Cz, Pz and Oz during intervals 2–4. This increase was significant in interval 2 for Pz (13–13.25 Hz), in interval 3 for Oz (13–13.5 Hz) and in inter val 4 for Cz and Pz (13.25–13.75 Hz).. SD NP BL. 200. *. * 1. 2. 3. 4. 2 h interval Figure 5. Time course of SWA (0.5–5Hz) during the averaged baseline night (BL, 왔), the SD (쎲) and NP (쑗) recovery night in the midline derivations (Fz, Cz, Pz, Oz; mean ± SEM, n = 10). Asterisks and open circles indicate differences to corresponding baseline values (*P < 0.05, °P < 0.1, Duncan’s multiple range test).. Time Course of SWA Figure 5 shows the time course of SWA (0.5–5 Hz) throughout the sleep episodes for each derivation. A two-way rA NOVA with the factors condition × time (2 h intervals 1–4) yielded a significant interaction for all derivations [F(6,54) > 10; P < 0.05]. Post hoc comparisons revealed that during recovery sleep after SD, SWA was significantly enhanced in the 2 h intervals 1 and 2 in all derivations (P < 0.05, Duncan’s multiple range test). In the NP recovery night, SWA was significantly reduced in the first 2 h inter val in all derivations except for Fz (Fig. 5; P < 0.05, Duncan’s multiple range test). No significant change was obser ved in the remaining 2 h intervals. Post hoc comparisons indicated that the relative increase of SWA in interval 1 of the SD recovery night was more pronounced. Cerebral Cortex Oct 2002, V 12 N 10 1097.
(7) in the fronto-central than in the parieto-occipital derivations ([Fz + Cz] > [Pz + Oz]), P < 0.05, Duncan’s multiple range test), whereas the decrease in the NP recover y night showed a parieto-occipital dominance ([Fz + Cz] < [Pz + Oz], P < 0.05, Duncan’s multiple range test).. Discussion We could confirm that SWA in the range from 0.5 to 5 Hz, and SFA in the high frequency range (13.75–16.5 Hz) are affected oppositely by differential sleep pressure conditions. The homeostatic regulation of SWA and SFA depended strongly on brain location. A fter high sleep pressure (SD protocol), the rebound in SWA at the beginning of the night yielded a clear fronto-central predominance, whereas the decrease in SWA observed after low sleep pressure (NP protocol) showed a parieto-occipital predominance. Centro-parietal HSFA was enhanced after low sleep pressure and reduced after high sleep pressure. In contrast, LSFA was increased after both manipulations. Therefore, EEG power density within the range of SFA (12–16 Hz) exhibited a dissimilar homeostatic regulation. Taken together, frontal low EEG activity and centro-parietal HSFA were the bands with a clear homeostatic regulation, and therefore represent two distinct indexes of sleep pressure during human sleep. The balance between these indexes (SWA/HSFA) represents a very sensitive marker of changes in sleep homeostatic pressure. SWA The obser ved increases in SWA after high sleep pressure are in good accordance with previous studies in which the effects of sleep deprivation on EEG power spectra have been quantified (Borbély et al., 1981; Dijk et al., 1993). Furthermore, we could confirm recent reports (Cajochen et al., 1999a; Finelli et al., 2001) that this increase in SWA varies along the antero-posterior axis and shows a fronto-central predominance. The reduction of SWA in the recovery night after the nap protocol, particularly at the beginning of the night, is likely to be a result of the low level of sleep pressure. The obser ved decrease in SWA, although smaller, is in good accordance with a study in which the duration of prior wakefulness was reduced by a single early evening nap (Werth et al., 1996). The obser ved changes in SWA confirmed the visually scored SWS findings. Interestingly, the SWA reduction after low sleep pressure did not display the corresponding frontal predominance. It may be that the degree of sleep satiation obtained in the NP protocol was not strong enough to elicit regional differences. However, the occipital predominance in the SWA response after low sleep pressure may not support this hypothesis. Another explanation may be that frontal cortical areas of the brain are particularly affected by sleep deprivation, whereas after sleep satiation the negative rebound in SWA is not confined to frontal brain areas, and rather manifests itself in more occipital brain regions. In other words, challenging the sleep homeostat by an extension of wakefulness elicits ‘frontal deactivation’, whereas challenging the sleep homeostat by a reduction of wakefulness does not result in ‘frontal activation’. PET studies have demonstrated that the decline of regional cerebral blood f low (rCBF) during SWS is most prominent in frontal cortical areas (Maquet et al., 1997; Hof le et al., 1997), and rCBF in the anterior cingulate and orbitofrontal cortex are negatively correlated with EEG SWA during sleep (Hof le et al., 1997). Nevertheless, how the frontal rCBF decline during slow wave sleep is associated with the homeostatic regulation of SWS remains to be elucidated.. 1098 Homeostasis of Slow-wave and Sleep Spindle Frequency Activity • Knoblauch et al.. Spindle Frequency Activity Previous studies have suggested that spindle frequency activity, particularly in the high frequency range, may be under homeostatic control (Borbély et al., 1981; Dijk et al., 1987, 1993; Aeschbach and Borbély, 1993). Our present results are in accordance with this hypothesis. The reduction of HSFA after sleep deprivation was rather small. However, the negative peak in the shape of the generally enhanced relative spectra was outstanding. Besides the differential qualitative response of SWA and HSFA to high sleep pressure, the time course was also different. The increase of power density in the SWA range was most salient in the first 2 h interval and dissipated thereafter. The reduction in the HSFA range, on the other hand, only became evident after the second 2 h interval. This delayed response to sleep deprivation in the high spindle frequency range has also previously been described (Borbély et al., 1981; Dijk et al., 1993). A fter the nap protocol, when sleep pressure was low, HSFA increased markedly. This increase peaked in, but was not limited to the high-frequency range, as it was for the decrease after sleep deprivation, but also covered the lower sigma frequency range. There is evidence in the literature that homeostatic regulation may be weaker for LSFA than for HSFA. LSFA did not increase with time awake in a nap study, as did HSFA (Dijk et al., 1987, 1993). The results of an increase limited to the high spindle frequency range (13.25–15 Hz) in the course of a nocturnal sleep episode (Aeschbach and Borbély, 1993) would fit the idea that the same underlying process is present within a sleep episode (Borbély et al., 1981). However, in a forced desynchrony study where sleep occurred at all circadian phases, low-, intermediateand high-frequency SFA all increased with the progression of sleep, which would rather suggest homeostatic control of LSFA (Dijk et al., 1997). Here we report for the first time a dissimilar homeostatic regulation of LSFA and HSFA after sleep loss. Furthermore, we could show that the effects of differential levels of sleep pressure on SFA depend on brain location. We found the previously reported centro-parietal dominance of HSFA (Jankel and Niedermeyer, 1985; Jobert et al., 1992; Zeitlhofer et al., 1997) and could show that here, HSFA was sensitive to different levels of sleep pressure, but not in the frontal and occipital derivation. Our data confirm analyses of scalp-recorded sleep spindles with topographically distinct slowand fast-spindle waves (Gibbs and Gibbs, 1950; Scheuler et al., 1990; Jobert et al., 1992; Werth et al., 1997; Zeitlhofer et al., 1997; Zygierewicz et al., 1999). Theta and Alpha Activity EEG theta and alpha activity was significantly increased after the nap protocol, an effect usually seen after sleep deprivation, when sleep pressure is enhanced. The decrease of SWS and SWA at the beginning of the recovery night indicates that the subjects were indeed sleep satiated at the end of the nap schedule. The extent of this sleep satiation was, however, less pronounced than the extent of the 40 h sleep deprivation compared to baseline (note: TST was not significantly enhanced in the nap protocol compared with baseline conditions, and the reduced sleep pressure at the beginning of the recovery night may be due to the higher level of accumulated SWS and the short duration of wakefulness prior to sleep). When sleep pressure was considerably diminished by an evening nap, theta and alpha activity was reduced in the first two NREM sleep episodes during post-nap nocturnal sleep (Werth et al., 1996). This reduction in theta and alpha activity was not found after our NP protocol. However, the increase of EEG activity in these frequency bands.
(8) was hardly present in the NREM spectrum during the first 2 h interval, emerged slightly in interval 2 and more prominently in interval 3. This indicates that after an initial reduction of sleep pressure, there might have been an intra-night build-up of sleep pressure which led to a partial increase of EEG activity in the theta, alpha and slow wave range in the latter part of the night.. Conclusion Topographic analyses of the sleep EEG along the antero-posterior axis on the effects of differential sleep pressure revealed brain locations which are highly responsive to the process of homeostatic sleep regulation in a frequency-specific manner. Frontal regions of the brain show strong homeostatic control in the SWA range of the EEG, central–parietal brain regions in the high spindle frequency range. These data further support the idea that some aspects of human sleep may be local in nature as was previously demonstrated in animals (Oleksenko et al., 1992; Pigarev et al., 1997). Studies both in humans (Kattler et al., 1994) and rats (Vyazovskiy et al., 2000) where local cortical activation during wakefulness resulted in a local response in the EEG power density in the corresponding area during subsequent NREM sleep imply that the human sleep EEG exhibits use dependent characteristics as hypothesized by Krueger and Obál (Krueger and Obál, 1993). Further studies are needed to establish firmly whether the observed local differences in SWA and HSFA in response to differential sleep pressure are related to use-dependent phenomena.. Notes We thank Giovanni Balestrieri and Marie-France Dattler for their help in data acquisition, Drs A lexander Rösler and Tobias Müller for medical screening, and the subjects for participating. This research was supported by Swiss National Foundation Grants START no. 3130-054991.98 and no. 3100-055385.98 to C.C. Address correspondence to Christian Cajochen, Center for Chronobiology, Wilhelm Kleinstrasse 27, CH-4025 Basel, Switzerland. Email: [email protected].. References Aeschbach D, Borbély A A (1993) All-night dynamics of the human sleep EEG. J Sleep Res 2:70–81. Aeschbach D, Dijk DJ, Borbély A A (1997) Dynamics of EEG spindle frequency activity during extended sleep in humans: relationship to slow-wave activity and time of day. Brain Res 748:131–136. Borbély A A, Baumann F, Brandeis D, Strauch I, Lehmann D (1981) Sleep deprivation: effect on sleep stages and EEG power density in man. Electroencephalogr Clin Neurophysiol 51:483–495. Borbély A A, Mattmann P, Loepfe M, Strauch I, Lehmann D (1985) Effect of benzodiazepine hypnotics on all-night sleep EEG spectra. Hum Neurobiol 4:189–194. Brunner DP, Dijk DJ, Münch M, Borbèly A A (1991) Effect of zolpidem on sleep and sleep EEG spectra in healthy young men. Psychopharmacology 104:1–5. Cajochen C, Foy R, Dijk DJ (1999a) Frontal predominance of a relative increase in sleep delta and theta EEG activity after sleep loss in humans. Sleep Res Online 2:65–69. Cajochen C, Khalsa SBS, Wyatt JK, Czeisler CA, Dijk DJ (1999b) EEG and ocular correlates of circadian melatonin phase and human performance decrements during sleep loss. Am J Physiol Regul Integr Comp Physiol 277:R640–R649. Cajochen C, Knoblauch V, Kräuchi K, Renz C, Wirz-Justice A (2001) Dynamics of frontal EEG activity, sleepiness and body temperature under high and low sleep pressure. NeuroReport 12:2277–2281. Curran-Everett D (2000) Multiple comparisons: philosophies and illustrations. Am J Physiol Regul Integr Comp Physiol 279:R1–R8. Daan S, Beersma DGM, Borbély A A (1984) Timing of human sleep: recover y process gated by a circadian pacemaker. A m J Physiol Regulatory Integr Comp Physiol 246:R161–R183. Dijk DJ, Beersma DGM, Daan S (1987) EEG power density during nap. sleep: ref lection of an hourglass measuring the duration of prior wakefulness. J Biol Rhythms 2:207–219. Dijk DJ, Czeisler CA (1995) Contribution of the circadian pacemaker and the sleep homeostat to sleep propensity, sleep structure, electroencephalographic slow waves, and sleep spindle activity in humans. J Neurosci 15:3526–3538. Dijk DJ, Hayes B, Czeisler CA (1993) Dynamics of electroencephalographic sleep spindles and slow wave activity in men: effect of sleep deprivation. Brain Res 626:190–199. Dijk DJ, Shanahan TL, Duff y JF, Ronda JM, Czeisler CA (1997) Variation of electroencephalographic activity during non-rapid eye movement and rapid eye movement sleep with phase of circadian melatonin rhythm in humans. J Physiol 505:851–858. Finelli LA, Borbély A A, Achermann P (2001) Functional topography of the human nonREM sleep electroencephalogram. Eur J Neurosci 13:2282–2290. Gibbs FA, Gibbs EL (1950) Atlas of electroencephalography, 2 edn. Cambridge: Addison-Wesley. Hof le N, Paus T, Reutens D, Fiset P, Gotman J, Evans AC, Jones BE (1997) Regional cerebral blood f low changes as a function of delta and spindle activity during slow wave sleep in humans. J Neurosci 17:4800–4808. Jankel WR, Niedermeyer E (1985) Sleep spindles. J Clin Neurophysiol 2:1–35. Jobert M, Poiseau E, Jähnig P, Schulz H, Kubicki S (1992) Topographical analysis of sleep spindle activity. Neuropsychobiology 26:210–217. Johnson LC, Hanson K, Bickford RG (1976) Effect of f lurazepam on sleep spindles and K-complexes. Electroencephalogr Clin Neurophysiol 40:67–77. Kattler H, Dijk DJ, Borbély A A (1994) Effect of unilateral somatosensory stimulation prior to sleep on the sleep EEG in humans. J Sleep Res 3:159–164. Knoblauch V, Kräuchi K, Renz C, Müller T, Wirz-Justice A, Cajochen C (2001) Effect of a 75/150 minute sleep–wake schedule on the accumulation of slow-wave sleep and wakefulness after lights off. Sleep 24:A194. Krueger JM, Obál F (1993) A neuronal group theory of sleep function. J Sleep Res 2:63–69. Maquet P, Degueldre C, Delfiore G, Aerts J, Péters JM, Luxen A, Franck G (1997) Functional neuroanatomy of human slow wave sleep. J Neurosci 17:2807–2812. McCormick D, Bal T (1997) Sleep and arousal: thalamocortical mechanisms. Annu Rev Neurosci 20:185–215. Oleksenko AI, Mukhametov LM, Polyakova IG, Supin AY, Kovalzon VM (1992) Unihemispheric sleep deprivation in bottlenose dolphins. J Sleep Res 1:40–44. Pigarev IN, Nothdurft HC, Kastner S (1997) Evidence for asynchronous development of sleep in cortical areas. Neuroreport 8:2557–2560. Rechtschaffen A, Kales A (1968) A manual of standardized terminology, techniques and scoring system for sleep stages of human subjects. Bethesda, MD: US Department of Health, Education and Welfare, Public Health Service. Scheuler W, Kubicki S, Scholz G, Marquardt J (1990) Two different activities in the sleep spindle frequency band-discrimination based on the topographical distribution of spectral power and coherence. Sleep 90:13–16. Steriade M, McCormick DA, Sejnowski TJ (1993) Thalamocortical oscillations in the sleeping and aroused brain. Science 262:679–685. Tobler I, Borbély A A, Groos G (1983) The effect of sleep deprivation on sleep in rats with suprachiasmatic lesions. Neurosci Lett 21:49–54. Torsvall L, Akerstedt T (1980) A diurnal type scale. Construction, consistency and validation in shift work. Scand J Work Environ Health 6:283–290. Trachsel L, Dijk DJ, Brunner DP, Klene C, Borbély A A (1990) Effect of zopiclone and midazolam on sleep and EEG spectra in a phaseadvanced sleep schedule. Neuropsychopharmacology 3:11–18. Uchida S, Maloney T, March JD, Azari R, Feinberg I (1991) Sigma (12–15 Hz) and delta (0.3–3 Hz) EEG oscillate reciprocally within NREM sleep. Brain Res Bull 27:93–96. Vyazovskiy V, Borbély A A, Tobler I (2000) Unilateral vibrissae stimulation during waking induces interhemispheric EEG asymmetr y during subsequent sleep in the rat. J Sleep Res 9:367–371. Weitzman ED, Czeisler CA, Zimmermann JC, Ronda JM (1980) Timing of REM and stages 3 + 4 sleep during temporal isolation in man. Sleep 2:391–401.. Cerebral Cortex Oct 2002, V 12 N 10 1099.
(9) Werth E, Achermann P, Dijk DJ, Borbély A A (1997) Spindle frequency activity in the sleep EEG: individual differences and topographic distribution. Electroencephalogr Clin Neurophysiol 103:535–542. Werth E, Dijk DJ, Achermann P, Borbély A A (1996) Dynamics of the sleep EEG after an early evening nap: experimental data and simulations. Am J Physiol Regul Integr Comp Physiol 271:501–510.. 1100 Homeostasis of Slow-wave and Sleep Spindle Frequency Activity • Knoblauch et al.. Zeitlhofer J, Gruber G, Anderer P, Asenbaum S, Schimicek P, Saletu B (1997) Topographic distribution of sleep spindles in young healthy subjects. J Sleep Res 6:149–155. Zygierewicz J, Blinowska KJ, Durka PJ, Szelenberger W, Niemcewicz S, Androsiuk W (1999) High resolution study of sleep spindles. Clin Neurophysiol 110:2136–2147..
(10)
Figure
+2
Documents relatifs