Inheritance and Linkage Relationships of
Morphological and Isozyme Loci in
Lentil (Lens Miller)
F. J. Muehlbauer, N. F. Weeden, and D. L. Hoffman
Allozyme polymorphisms for 18 loci are described and their monogenic inheritance is demonstrated. We Investigated linkage relationships among the 18 isozyme loci as well as four genes controlling morphological traits. Six small linkage groups were identified, containing 14 of the loci analyzed. Several of these groups appear to be conserved between Lens and Plaum, indicating that this intergeneric comparison may expedite genetic studies and breeding programs in both crops.
From the USDA-ARS, Washington State University, Pullman, Washington (Muehlbauer); the Department of Horticulture, Cornell University, Geneva, New York (Weeden); and the USDA-ARS, Aberdeen, Idaho (Hoff-man). This work is from the Agricultural Research Ser-vice, U.S. Department of Agriculture, In cooperation wtth the College of Agriculture and Home Economics, Agricultural Research Center, Washington State Uni-versity, Pullman, Washington, and the New York State Agricultural Experiment Station, Cornell University, Geneva, New York. Address reprint requests to Dr. Muehlbauer, USDA-ARS, Washington State University, Pullman, WA 99164.
Journal of Heredity 1989-.80-.298-303; 0022-1503/89/S2.00
Lentil (Lens culinaris Medik.) is an impor-tant food legume in the Middle East, north-ern Africa, central and westnorth-ern Asia, and North and South America, where the crop is grown in semiarid regions, usually in rotation with cereals. The crop is valued as a high-protein food and for its residues, which are used in animal feeding. Germ plasm for breeding has been made avail-able from systematic collection of land races and indigenous wild species in cen-ters of diversity. Ladizinsky et al.5 showed that the wild species of Lens belong to two biological species: L. culinaris and L. ni-gricans. Hybridization within L. culinaris, the species containing the cultigen L cu-linaris ssp. cucu-linaris, and two closely re-lated subspecies, odemensis and orientalis, was easily accomplished, leading to fertile progenies. Hybridization across the bio-logical species could be accomplished only through the use of embryo rescue.3
Even though the lentil has been an im-portant food legume for centuries, genetic studies have been made only recently. Muehlbauer and Slinkard9 reviewed the genetics of Lens and listed 12 genes re-sponsible for morphological and seed variation. Skibinski et al.9 identified allo-zymic variation at an aspartate amino-transferase locus which they designated Aat-1. Zamir and Ladizinsky19 described the inheritance of eight allozyme poly-morphisms and the presence of two link-age groups. In one of these linklink-age groups, the gene for green epicotyl, Gs, was placed 14 map units from Got-2 (Aat-1 of Skibinski et al.9) and 25 map units from a gene cod-ing an isozyme of malic enzyme, Me-1. More recently, Tadmor et al." summarized link-age relationships among 15 isozyme loci,
four loci encoding seed proteins, two mor-phological markers, and a translocation break point Hoffman et al.4 identified sev-eral other allozyme polymorphisms within the L. culinaris subspecies. We report the further characterization and genetic anal-ysis of these and other polymorphisms us-ing hybrid F2 populations. Four morpho-logical characters, two of which have not been reported in previous studies, also were included in our analysis.
Materials and Methods
We used the F2 populations from seven different crosses for this investigation. Four crosses had L culinaris ssp. culinaris cv 'Brewer' as the maternal parent and one of four L. culinaris ssp. orientalis acces-sions (Nos. 4, 59, 66, and 77) as the pa-ternal parent. L culinaris ssp. culinaris cv 'Giza 9' was used twice as the maternal parent in crosses with L culinaris ssp. ori-entalis No. 78 and L. culinaris ssp. ode-mensis No. 61. The seventh cross was L. culinaris ssp. culinaris cv. 'Red Chief x L. culinaris ssp. orientalis No. 78. The parents of these crosses were known to differ for several morphological genes (Table 1) and several isozyme loci. Plants from the sev-en F2 populations were scSfe^vTsTRul^Tor morphological markers, and allozyme seg-regation was determined by means of hor-izontal starch gel electrophoresis.
We prepared samples for electropho-resis using two extraction buffers, as de-scribed by Weeden and Emmo.12 Samples extracted in TRIS-maleate (pH 8.0) buffer (Buffer I) were placed on a pH 8.1 TRIS-citrate/lithium borate system.7 The potas-sium phosphate extraction buffer (pH 7.0)
Table 1. Morphological markers In parental lines of Lent Marker genes' Parent Yc G/i Gs Pi 'Brewer' 'Giza9' 'Red Chief
L culinaris ssp. orientalis (No. 4) L culinaris ssp. onentalis (No. 59) L culinaris ssp. onentalis (No. 77) L culinaris ssp. orientalis (No. 78)
A. culinans ssp. orientalis (No. 66) i. culinaris spp. odemensis (No. 61)
1 For a description, see Muehlbauer and Slinkard.8
* + — dominance; — — recessiveness.
was used for samples placed on a pH 6.5 histidine gel1 and a pH 6.1 citrate/N-(3-aminopropyl)-morpholine gel.2 Slices from the TRIS-citrate/lithium borate, pH 8.1, gel were stained for aspartate aminotrans-ferase (AAT, EC 2.6.1.1), N-acetyl glucos-aminidase (NAG, EC 3.2.1.30), peroxidase (PRX, EC 1.11.1.7), leucine amino-pepti-dase (LAP, EC 3.4.11.1), alcohol dehydro-genase (ADH, EC 1.1.1.1), aldolase (ALDO, EC 4.1.2.13), /9-D-galactosidase (GAL, EC 3.2.1., pH 8.5), glucosephosphate isom-erase (GPI, EC 5.3.1.9), and phospho-glucomutase (PGM, EC 2.7.5.1). Slices from the histidine gel were stained for fructo-kinase (FK, EC 2.7.1.4), 6-phosphogluco-nate dehydrogenase (6PGD, EC 1.1.1.44), and shikimic dehydrogenase (SKDH, EC 1.1.1.25). We assayed the cathodal slide of the pH 6.1 gel for GAL, pH 4.5 (EC 3.2.1.23).
For most enzyme systems, we used ex-tracts from approximately 2 cm2 of young, newly expanding leaf tissue from green-house-grown plants for analysis. The leaf tissue was ground in approximately 0.2 ml of extraction buffer using a Plexiglas rod. Grinding was performed in 7-ml polysty-rene weigh boats that were kept on ice during the extraction. Extracts were used immediately after grinding. The green-house used to grow the plants was kept at 25°C during the day and lcFC at night. The natural photoperiod was extended to 16 h with supplemental cool white fluorescent lighting, which provided photosyntheti-cally active irradiance of at least 145 W m"2 (400 to 700 mm) at pot level. Extracts from root samples were used to assay for NAG, PRX, and ADH. To induce ADH, pots of plants were immersed in water for 18 h at room temperature before sampling. For the sampling of young root tissue, the pot was removed from the water and inverted, and the pot was gently removed from the clump of soil to expose young, actively growing roots. Approximately 2 g of young root tissue was sampled for each plant. For
analysis of PRX isozymes, 2-mercapto-ethanol was omitted from the extraction buffer.
The assays for ADH, 6PGD, and LAP were identical to or slight modifications of those described by Shaw and Prasad.8 The as-says we used for AAT, ALDO, GPI, PGM, and SKDH were described by Weeden and Gottlieb.13 PRX was assayed according to the method of Weeden and Marx.16 The NAG assay contained 10 ml 0.1 M sodium citrate, pH 4.5, and 5 mg N-acetyl-D-glu-cosaminide. The GAL, pH 4.5, assay con-tained 10 ml 0.1 M sodium citrate, pH 4.5, and 5 mg 4-methylumbelliferyl-D-galac-toside dissolved in 1 ml dimethylformam-ide. Both solutions were mixed together just before staining. The GAL, pH 8.5, assay was similar to the GAL, pH 4.5, assay ex-cept that the buffer was 10 ml 0.1 M TRIS-HC1, pH 8.5. The NAG, GAL, pH 4.5, and GAL, pH 8.5, assays were poured directly onto the gel slice on a glass plate. Assay solutions were poured off after 10 min, and the activity bands were then visualized un-der UV light (X - 302 nm).
An agarose overlay was used for the FK assay. The FK assay was prepared by mix-ing 9 ml 0.1 M TRIS-HC1, pH 7.1, and 1 ml 0.1 M MgCl2. Low-gelling-temperature aga-rose (SeaPlaque, FMC, Rockland, Maine, 80 mg) was added to 6 ml of buffer that was brought to a boil over low heat and held in a 37°C water bath. To the remaining 4 ml of buffer, 25 mg /S-D-fructose, 12 mg adenosine 5'-triphosphate, 30 units phos-phoglucose isomerase, 10 units glucose 6-phosphate dehydrogenase, 5 mg nico-tinamide-adenine dinucleotide phosphate (NADP), 0.5 mg MTT, and 0.5 mg meldola blue were added. The two solutions were combined and immediately poured onto the gel slice on a glass plate.
The subcellular compartmentalization of the individual isozymes of AAT, ALDO, GPI, 6PGD, PGM, and SKDH was deter-mined by the use of pollen extracts and
isolation of cell fractions greatly enriched for plastids or mitochondria. Pollen leach-ates were obtained from freshly collected pollen, as described by Weeden and Gott-lieb.14 Chloroplast and mitochondrial pel-lets were obtained by differential centrif-ugation of leaf extracts on a Sorvall RC-2B refrigerated centrifuge. Isolation of the chloroplast pellet was performed as de-scribed by Weeden and Robinson." The supernatant from the initial 1,000 g cen-trifugation step in the isolation of the chlo-roplast pellet was centrifuged for 2 min at 5,000 g, transferred to a clean tube, and centrifuged for 5 min at 20,000 g. The re-sulting mitochondrial pellet was resus-pended in 200 n\ of 50 mM TRIS/HC1, pH 8.0, containing 14 mM 2-mercaptoethanol and 0.3% Triton X-100.
Data from the F2 plants in each of six populations were tested for single-locus goodness of fit using chi-square. Devia-tions from random assortment and recom-bination frequencies for pairs of genes were determined using the LINKAGE-1 program of Suiter et al.10
Results
In all seven F2 populations, segregation of morphological markers and isozyme phe-notypes generally fit the expected 3:1 or 1:2:1 ratios (Table 2). Significant devia-tions from expected ratios were observed at several isozyme loci and one morpho-logical trait However, for each of the loci that displayed aberrant segregation within an F2 family, ratios within the normal range (/> > .05) were obtained in at least two other F2 families. Some partial sterility was observed in the Giza 9/LO61 population, possibly reflecting chromosomal rear-rangement.
The Mendelian segregation ratios shown by each of the allozyme polymorphisms indicated that each was coded by a single nuclear gene. In some cases these results represented confirmation of previous studies; however, other results were novel and are described in detail.
The four AAT isozymes (Figure 1) were located in different subcellular compart-ments, and each was encoded by a distinct locus. The fastest migrating isozyme, AAT-1, exhibited low activity relative to the oth-er three isozymes. It was weakly associ-ated with the mitochondrial pellet and, similar to all the other isozymes, was ob-served in the supernatant. Based on pre-vious results in p e a " " and Cucurbita,ls it
was postulated to be of microbody origin. The coding locus was therefore
Table 2. Single-locus goodness of fit to either a 3:1 or a 1:2:1 ratio for genes nsed In the linkage analysis
No. observed with designated phenotype Family Locus Br/LO4° Br/LO66 Br/LO77 Br/LO59 G9/LO78 G9/LO61 RC/LO78 Gs Yc Gh Pi Aat-mb Aat-p Aat< Gal-I Gal-2 Fk Spgd-P Skdh Yc Gh Pi Aat-p Adh-I Yc Gh Pi Aat-mb Aat-p Gal-1 Pgm-p Fk Yc Gh Pi Aat-p Gal-1 Fk Pgm-p Skdh Gh Pi Aat-mb Aat-m Gal-1 Gal-2 Pgm< Pgm-p Lap-1 Cpi-c Yt Pi Aat-mb Lap-1 Lap-2 PgfTK Spgd-p Aldo Skdh Nag Px-1 Aat-mb Lap-1 Gal-1 Pgm< Pgm-p Fk Gpi-c Dominant or fast 40 39 32 24 19 14 7 12 8 15 15 15 41 36 26 14 8 29 22 17 10 9 6 13 18 10 24 24 12 10 10 9 12 14 19 23 18 15 12 12 10 5 10 12 21 17 12 9 6 10 9 9 15 11 7 27 15 7 15 10 17 19 Heterozygous — — 23 30 35 38 14 25 23 26 W . ,—
ta
21 & 17 Ifw
—
19 19 22 12 16 ^ 14 15 19 15 17 20 15 15 . 16 23 16 17 17 17 11 17 18 13 38 21 22 13 32 32 Recessive or slow 16 17 15 11 12 12 14 6 16 16 18 13 9 10 12 11 8 8 13 9 9 9 7 7 7 7 12 11 10 7 7 5 12 6 10 8 4 6 5 4 8 10 11 9 12 9 8 4 6 9 10 10 10 8 11 10 11 9 4 12 5 13 X2 0J8 0.86 1.20 0.77 3.00 0.43 5.25 8.43s 6.00< 0.68 2.11 0.22 1.31 0.26 0.88 0.36 2.81 0.23 2.75 1.28 1.19 0.23 1.29 2.19 11.72' 0.61 1.33 0.77 4.91C 0.61 0.61 2.67 4.00 4.00 1.39 0.01 12.70* 5.50 2.83 4.16 0.26 2.14 1.06 1.50 2.27 1.28 1.33 4.17 0.57 0.17 0.17 0.17 6.83-0.61 0.88 23.08* 2.75 0.64 6.12-2.54 7.19-1.12• Abbreviations for families: Br/LO4 - Brewer/i. ailinaris ssp. oriental!* (No. 4); Br/LO66 - Brewer/L culinaris ssp. orientalis (No. 66); Br/LO77 - Brewer/L. ailinaris ssp. orientalis (No. 77); Br/LO59 - Brewer/L ailinaris ssp.
orientalis (No. 59); G9/LO78 - Giza 9/L. culinaris ssp. orientalis (No. 78); G9/LO61 - Giza 9/L. culinaris ssp. odemensis (No. 61); RC/LO78 - Red Chief/L culinaris ssp. orientalis (No. 78).
* / > < .01. <P< .05.
©
4 1
t t t t t
.t; Q) co CO •s "o ~2
-1 "5. s ** O O c ^ B ^ ^ " ^ * 1 ^ i O CD£ o a
Figure 1. Subcellular compartmentalization of
as-partate aminotransferase in lentil. 1 = microbody; 2 = plastid; 3 = mitochondria!; 4 = cytosolic.
ed Aat-mb to reflect this compartmental-ization. AAT-2 was the plastid-specific iso-zyme coded by Aat-p. AAT-3 and AAT-4 appeared to be the mitochondrial and cy-tosolic forms on the basis of the following observations: 1) The two isozymes did not form hybrid dimers with each other or with either plastid or microbody isozymes, in-dicating a different subcellular localiza-tion for each. 2) AAT-3 was strongly as-sociated with the mitochondrial pellet, whereas AAT-4 was not. 3) Extracts of root tissue showed a higher activity of AAT-3 (data not shown), paralleling a similar in-crease in the activity of the mitochondrial form in pea root extracts. The mitochon-drial pellet obtained for lentil was contam-inated by the plastid isozyme (Figure 1) because the centrifugation protocol used to obtain the plastid pellet did not remove all plastids from the extract However, contamination of the mitochondrial pellet by cytosolic enzymes should have been minimal because such enzymes would have remained in the supernatant Only a very low activity of the cytosolic GPI isozyme, GPI-2, was observed in the mitochondrial pellet, indicating the low level of cytosolic
F H F H S S H H F H S
px-1
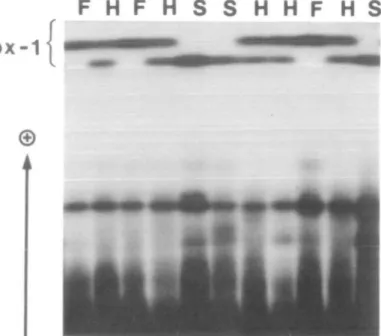
Flfore 2. Peroxldase phenotypes for Px-1 obtained from extracts of lentil roots submerged In water for 18 h
before extraction. Phenotype designations: F - fast; S - slow; H - heterozygous.
contamination. None of the AAT isozymes were observed in pollen leachates; again, this was similar to previous results in pea. Only one isozyme each was resolved for ALDO and SKDH, both of which were lo-cated in the plastid compartment In con-trast, two isozymes each were resolved for GPI, 6GPD, and PGM. In all cases, using an analysis of pollen extracts, one was shown to be located in the cytosol (GPI-2,6PGD-2, and PGM-1); the other isozyme was locat-ed in the plastid. Because allozyme poly-morphism was observed for only four of the isozymes, only the loci Gpi-c, 6pgd-p, Pgm<, and Pgm-p could be rigorously de-fined by segregation analysis (Table 2). Two loci also were expressed in the ADH, GAL, and LAP enzyme systems. In ADH the familiar triplet of bands was observed in inbred lines. A variant in the more an-odal ADH-1 was found in L. culinaris ssp.
orientalis (No. 66), and the segregation pattern in the Br/LO66 population con-firmed that the variation was produced by allelic polymorphism at Adh-1. Both Lap-] and Lap-2 exhibited normal segregation in theG9/LO61 family. In addition, Lap-1 seg-regated in the G9/LO78 and RC/LO78 pop-ulations. The two isozymes of /3-D-galacto-sidase displayed different pH optima and were best resolved in different buffer sys-tems. The anodal isozyme with an alkaline pH optimum (GAL-1) produced sharp ac-tivity bands on the TRIS-HCl/lithium bo-rate system, whereas the cathodally mi-grating isozyme (GAL-2) with an acid pH optimum was better resolved on the pH 6.1 gel. The loci encoding GAL-1 and GAL-2 were designated Gal-1 and Gal-2, respec-tively.
The most anodal zone of peroxidase ac-tivity, PX-1, displayed clear segregation in
the G9/LO61 family (Figure 2). Other zones of activity did not differ between the par-ents. The fructokinase assay gave a single zone of activity that segregated in four F2 populations. The locus responsible for this polymorphism was designated Fk. A single NAG isozyme was observed in lentil ex-tracts, encoded by the locus Nag.
Linkages Observed
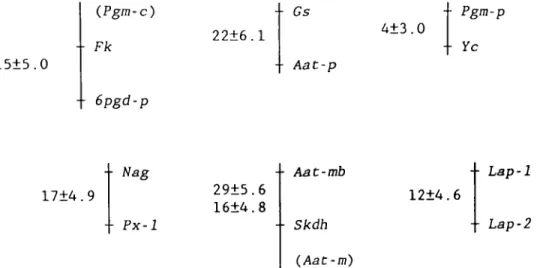
Segregation data for individual loci and joint segregation of pairs of loci are shown in Table 3. A number of pairs of loci de-viated significantly from random assort-ment. Recombination frequencies be-tween pairs of loci were used to construct several linkage groups (Figure 3). The gene encoding for the plastid-specific form of phosphoglucomutase {Pgm-p) was closely linked to the gene for cotyledon color ( Yc) in two families that showed segregation concurrently for the two genes. In the Br/ LO59 and Br/LO77 families, the recombi-nation fractions were 0% and 4%, respec-tively, indicating very close linkage. The Yc gene also appeared to be linked to the gene encoding for N-acetylglucosamini-dase {Nag) in the Br/LO66 family; how-ever, this linkage could not be confirmed in any of the other families.
The linkage of green epicotyl QGs) with the plastid-specific form of aspartate ami-notransferase {Aat-p) was found in the Br/ LO4 family and is the same linkage re-ported previously by Zamir and Ladizin-sky.19 Their data indicated that the two genes are 14 map units apart. Gswas also linked in their study to an isozyme of malic enzyme (Me-/); however, we did not ob-serve segregation for Me-1 in any of the families we studied.
The locus coding the plastid-specific form of 6-phosphogluconate dehydroge-nase (6pgd-p) was linked to the gene en-coding for fructokinase (/ft) in two of the Table 3. Joint F, segregation of palra of lod that exhibited (Ignlflcant devlatloiu from random auortment
Loci Fk:6pgd-p GsiAal-p Aat-mb.Skdh YcPgm-p Fk.6pgd-p YcPgm-p Aat-mb:Aat-m Nag.Px-1 Lap-l:Lap-2 Aat-mb:Skdh FkPgm< Family 0 0 0 0 0 0 Br/LO77 Br/LO77 Br/LO59 G9/LO78 G9/LO61 G9/LO61 G9/LO61 RC/LO78 No. F, N 56 56 52 37 36 36 36 36 28 36 38
plants observed with designated phenotypes'
/ -13 8 6 7 5 12 3 1 3 7 2 - / H 3 8 4 1 2 0 1 0 0 0 3 - / + O O C O 0 0 0 0 7 0 1 0 H/-4 4 1 — 3 4 2 2 1 H/H 19 15 13 — 9 13 15 10 16 H/+ 2 2 5 — 2 0 1 4 3 + / -1 4 2 0 0 0 0 6 1 1 1 +/H 1 22 7 11 2 12 5 5 1 1 1 +/+ 13 14 9 0 0 0 0 12 13 0 5 10 11 Recombi-nation fraction 11 22 29 4 15 0 16 17 12 16 14 SE 3.2 6.1 5.6 3.0 5.0 0.0 4.8 4.9 4.6 4.7 4.3
1 — ~ recessive phenotypes or homozygous slow; H — heterozygous; + — dominant phenotype or homozygous fast
15±5.0
(Pgm-c)
-• Fk •• 6pgd-p 22±6.1 -• Gs -• Aat-p4±3.0
•• Pgm-p -• Yc17±4.9
-• Nag •- Px-129±5.6
16±4.8
-• Aat-mb •• Skdh12±4.6
- • Lap -1 -• Lap-2(Aat-m)
Figure 3. Six linkage groups in lentil as determined by joint segregation of isozyme and morphological markers.
families. The recombination fractions were 15% and 11% in the Br/LO77 and Br/LO4 families, respectively. Pgm-c also dis-played linkage with Fk (Table 3) and be-longs in this linkage group. Unfortunately, none of the families had all three loci seg-regating simultaneously, and so the se-quence of the loci could not be determined unambiguously.
The loci Aat-mb, Aat-m, and Skdh con-stitute another set of linked loci for which the relative sequence could not be deter-mined. Aat-mb and Skdh displayed linkage in two segregating families (Br/LO4 and G9/LO61), with recombination fractions of 29% and 16%, respectively. Aat-mb and Aat-m showed a 16% recombination in the G9/LO78 family.
Two small linkage groups each contain-ing two isozyme loci were identified in the G9/LO61 family (Table 3). The loci Nag and Px-1 showed a 17% recombination fre-quency, and L1 and L2 were ap-proximately 12 recombinant units apart
Discussion
The genetics of lentil has only recently received much attention; however, these studies have revealed a large number of morphological genes and polymorphic isozyme loci.4'619 We used several of these genes as well as some undescribed vari-ants in our study to identify six linkage groups, four of which have not been re-ported previously. Comparison of the iso-zyme phenotypes and linkages among loci found in Lens with those described in the garden pea (Pisum sativum L.) revealed a number of parallels, providing additional support for our linkage results.15-18 Four AAT isozymes have been identified in the
garden pea, including one each in the mi-crobody, the mitochondrion, the plastid, and the cytosol.1115 Because the organelle isolation was more extensively performed in the pea studies, we used the results in pea to support our subcellular assign-ments of lentil AAT isozymes. In both gen-era the plastid isozyme is the most in-tensely staining isozyme in leaf extracts, whereas the microbody isozyme is the most anodal and displays the weakest ac-tivity. The relative mobilities of the AAT isozymes change slightly between the len-til and the pea. In the lenlen-til the mitochon-drial allozymes migrated slightly slower than or comigrated with the plastid allo-zymes, whereas in the pea the mitochon-drial allozymes were always cathodal to the plastid forms and one allozyme comi-grated with a cytosolic allozyme.
Other lentil enzyme systems, including ADH, ALDO, FK, GPI, 6PGD, NAG, PGM, and SKDH, are very similar to those in the pea, with homologous forms being easily identified.1518 Similarly, the anodal Px-1 has its counterpart in Pisum (Figure 2C in ref-erence 16). An anodal /3-galactosidase with an alkaline pH optimum is also found in the pea, but the pea has two cathodal iso-zymes with acid pH optima.16 We have not found in lentil an isozyme corresponding to the Gal-3 of the pea.
The ease with which homologous iso-zyme loci can be identified between Lens and Pisum makes it possible to look for linkage groups that may be conserved be-tween these two members of the Viceae. For instance, the locus coding the cyto-solic PGM (Pgm-c) was linked to that cod-ing the plastid 6PGD (6pgd-p) in the lentil, as it is in the pea.16 Tadmor et al.11 dem-onstrated that the locus coding the plas-tid-specific 6PGD is linked to a locus
cod-ing a peptidase. In the pea 6pgd-p also shows linkage to a peptidase locus.16
Other linkages in the pea paralleling those reported here for lentil include that between Aat-m and Skdhis and one
be-tween Px-1 and Nag.16 Finally, in the pea Lap-1 and Lap-2 are both on chromosome 3 but are too far apart to display nonran-dom assortment15 The significant dispar-ity in linkage distance between the two Lap loci in the two species would indicate that the parallel linkages are coincidental rath-er than consrath-erved.
The clear parallel between enzyme sys-tems in the lentil and the pea provides an opportunity to establish a consistent no-menclature for isozyme loci at least in the Viceae. Thus, we have used locus desig-nations in the lentil that will clearly iden-tify the homologous locus in Pisum. We feel that such a practice will promote in-teraction between geneticists and breed-ers working on these crops as well as on sweet pea (Lathyrus ssp.) and faba bean (Vicia faba), all members of the Viceae. In our system the Aat-1 of Skibinski et al.9 becomes Aat-p, and the Got-1, Got-2, and
Got-3 of Tadmor et al.11 are equivalent to Aat-mb, Aat-p, and Aat-m, respectively. The practicality of this convention is particu-larly apparent in cases in which commer-cially important genes have been tagged by isozyme loci in one of the species. For instance, in the pea Pgm-p has been shown to be a closely linked marker for the Mo gene, which confers resistance to bean yellow mosaic virus.17 Such closely linked markers can be used as tags for important genes in breeding programs.
The formulation of detailed gene maps should facilitate marker-assisted selection methods for these crops. It may also be possible to analyze the genetic variation present in germ plasm collections to syn-thesize segregating populations with unique combinations of traits.
Reference*
1. Cardy BJ, Stuber CW, and Goodman MM. Techniques for starch gel electrophoresis of enzymes from maize
(Zea maysL.'). Raleigh, North Carolina: North Carolina
State University Department of Statistics Mimeo Series No. 1317. 1980.
2. Clayton JW, and Tretlak DN. Amlne-citrate buffers for pH control in starch geJ electrophoresis. J Fish Res Bd Can 1972; 29:1169-1172.
3. Cohen D, Ladizinsky G, ZW M, and Muehlbauer FJ. Rescue of interspecific Lens hybrids by means of em-bryo culture. Plant Cell Tissue Organ Culture 1984; 3: 343-347.
4. Hoffman DL, Soltis DF, Muehlbauer FJ, and Ladizin-sky G. Isozyme polymorphism in Lens (Leguminosae). SystBot 1986; 11:392^02.
5. Ladizinsky G, Braun D, Goshen D, and Muehlbauer FJ. The biological species of the genus Lens. Bot Gaz 1984; 145:253-261.
6. Muehlbauer FJ, and Sllnkard AE. Genetics and breeding methodology. In. Lentils (Webb C and Hawtin G, eds). London: Commonwealth Agricultural Bureau; 1981*9-90.
7. Selander RK, Smith MH, Yang, SY, Johnson WE, and Gentry JB. Biochemical polymorphism and systemat-ics In the genus Peromyscus. I. Variation in the old-field mouse (Peromyscus potionotus). Austin: Univer-sity of Texas Publication 7103. 1971:49-90.
8. Shaw CR, and Prasad R. Starch gel electrophoresls— a compilation of recipes. Biochem Genet 1970, 4:297-320.
9. Sklblnsld DOF, Rassol D, and Ersldne W. Aspartate amino transferase allozyme variation in a germplasm collection of the domesticated lentil {Lens culinans). Theor Appl Genet 1984; 68:441-448.
10. Suiter KA, Wendel JF, and Case JS. J Hered 1983; 74:203-204.
11. Tadmor Y, Zamir D, and Ladizinsky G. Genetic map-ping of an ancient translocation in the genus Lens. Theor Appl Genet 1987; 73:883-892.
12. Weeden NF, and Emmo AC. Isozyme characteriza-tion of Kentucky bluegrass cultivars. Can J Plant Sci 1985; 65:985-994.
13. Weeden NF, and Gottlieb LD. The genetics of chlo-roplast enzymes. J Hered 1980; 71:392-396.
14. Weeden NF, and Gottlieb LD. Isolation of cyto-plasmic enzymes from pollen. Plant Physlol 1980; 66: 400-403.
15. Weeden NF, and Marx GA. Chromosomal locations of twelve isozyme loci in Pisum sativum J Hered 1984; 75:365-370.
16. Weeden NF, and Marx GA. Further genetic analysis and linkage relationships of isozyme loci in the pea. J Hered 1987; 78:153-159.
17. Weeden NF, Prowidenti R, and Marx GA. An iso-zyme marker for resistance to bean yellow mosaic vi-rus in Pisum sativum J Hered 1984; 75:411-412. 18. Weeden NF, and Robinson RF. Allozyme segrega-tion ratios in the interspecific cross Cucurbita maxima
x C ecuadorensis suggest that hybrid breakdown is not caused by minor alteration in chromosome struc-ture. Genetics 1987; 114:593-609.
19. Zamlr D, and Ladizinsky G. Genetics of allozyme variants and linkage groups In lentil. Euphytica 1984; 33:329-336.