V. Demangea)
Laboratoire de Science et Génie des Matériaux et de Métallurgie, UMR CNRS-INPL-UHP 7584, Ecole des Mines, Parc de Saurupt, F-54042 Nancy, France
J. Ghanbaja
Service Commun de Microscopie Electronique à Transmission, UHP Nancy I, F-54042 Vandoeuvre-les-Nancy Cedex, France
C. Beeli
Laboratory of Solid State Physics. ETH Zürich, CH-8093, Zurich, Switzerland F. Machizaud and J.M. Dubois
Laboratoire de Science et Génie des Matériaux et de Métallurgie, UMR CNRS-INPL-UHP 7584, Ecole des Mines, Parc de Saurupt, F-54042 Nancy, France
(Received 20 February 2004; accepted 6 April 2004)
This paper reports the preparation conditions and structure characteristics of Al–Cr–Fe very thin films (10–30 nm) obtained by the flash evaporation technique. The films are either amorphous or crystallized, depending on the thickness of the sample and temperature of the substrate. Annealing of amorphous films leads to crystallization of intermetallic phases that are all linked with quasicrystals. In particular, we have identified by transmission electron microscopy the following structures:
body-centered-cubic (bcc)␥-brass phase, monoclinic –Al13(Cr,Fe)4phase, and
orthorhombic O1-phase, all of them already observed in this system, together with four
new structures, i.e., a face-centered-cubic (fcc) ␥-brass phase (superstructure of the bcc phase), monoclinic ⬘-phase (related to the -phase) and two orthorhombic phases (1/1/; 1/1) and (1/0; 2/1) approximants of the decagonal phase). In this study, we point out the occurrence of twin defects of the–Al13(Cr,Fe)4 phase. Films prepared directly
in the crystalline state comprise the O1approximant. Electron energy loss spectroscopy
measurements show that all films are not oxidized except for the presence of a native oxide layer that forms in ambient atmosphere with a thickness that cannot exceed 0.3 nm. Optical properties were investigated and show that films need to be large enough (>30 nm) to reproduce the properties of bulk alloys. Finally, contact angle wetting measurements reveal that the presence of such films on a substrate, even at very low thickness, considerably decreases the wetting behavior by water.
I. INTRODUCTION
In the last decade, intensive experimental effort was devoted to the preparation of quasicrystalline and ap-proximant thin films. Indeed, these materials present a restricted interest in view of applications when used in bulk form due to their brittleness. Our aim in the present
study was therefore focused at the preparation of very thin films for optical applications. Recently, we have reported results of ellipsometry measurements of Al–Cr– Fe films on a glass substrate.1
In this paper, we will focus on the different preparation procedures used to prepare Al–Cr–Fe thin films. In a second part, we will present the results of a structure investigation on these films, using transmission electron microscopy (TEM). In a final sec-tion, we will discuss the optical and wetting properties on the films.
II. EXPERIMENTAL DETAILS
All films were prepared by flash evaporation tech-nique. The Al–Cr–Fe ingots were obtained by melting
a)
Address all correspondence to this author.
Present address: Laboratoire de Science et Génie des Surfaces, UMR CNRS 7570, Ecole des Mines, Parc de Saurupt, F-54042 Nancy, France.
e-mail: [email protected] DOI: 10.1557/JMR.2004.0311
the pure constituents in a levitation induction furnace. Compositions (obtained by microprobe analysis) that lead reproducibly to the formation of films of the wanted phases are respectively: A ⳱ Al67.6Cr23.3Fe9.1; B ⳱
Al70Cr22Fe8; C⳱ Al72.5Cr19.5Fe8; D⳱ Al75.5Cr15.8Fe8.7
and E⳱ Al77.5Cr14.5Fe8(in at.%). The so-obtained bulk
alloys were characterized by transmission electron microscopy (TEM) and will be the subject of a forthcom-ing article.2
Some details are nevertheless already avail-able in Refs. 3 and 4.
Small fractions of about 25 mg of the chosen alloy were evaporated with the help of a hot tungsten filament, under secondary vacuum (10−7 mbar). The films were deposited simultaneously on a glass substrate and on a carbon coated nickel microscopy grids. This device was able to operate at room temperature but also to pre-heat the substrate up to 584 °C. The films obtained at room temperature were systematically found amorphous (to-tally or partially, depending on the thickness of the as-deposited coating). Subsequently, some of them were annealed in situ in the electron microscope. Conventional electron microscopy was performed on Philips CM 12 (120 kV) and Philips (Eindhoven, Netherlands) CM 200 Double-twin instruments whereas high resolution microscopy was performed on a Philips CM200 Super-twin microscope.
In addition to structural characterization, we per-formed electron dispersive spectroscopy (EDS) measure-ments on each film to compare nominal composition of bulk alloys and composition of corresponding films. To this end, a calibration bulk sample was primarily char-acterized by microprobe analysis.
III. RESULTS
A. Thickness and microstructure induced by the preparation conditions
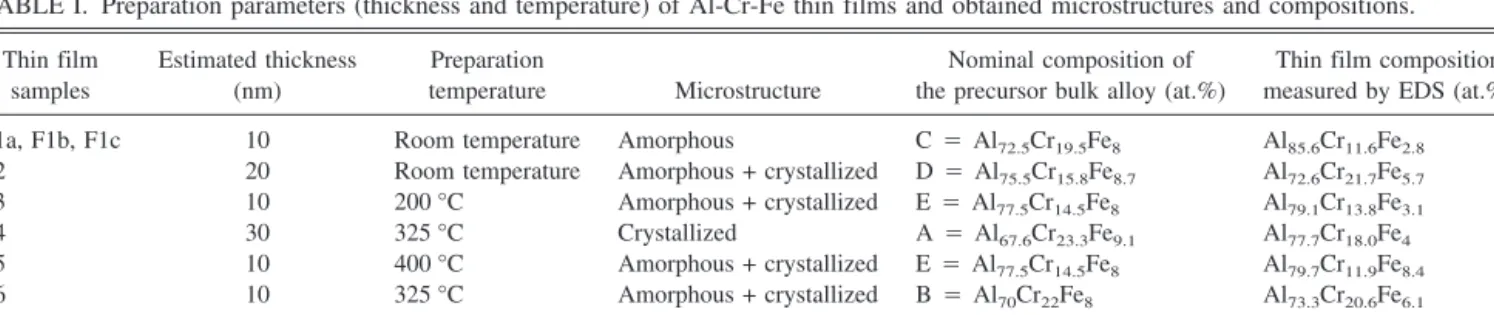
Table I gives data on films thickness, deposition tem-perature, and microstructure of TEM samples together with composition of the ingot and films composition. The thickness was obtained by TEM and by calibration of a quartz balance used during the preparation process.
Crystallization of films is strongly dependent on the preparation parameters. Films are partially crystallized
even when deposited at room temperature if the thickness is important enough. Otherwise, films remain completely amorphous. In addition, heating the substrate prior to evaporation is favorable to crystallization as expected. Finally, a rather thick film (30 nm) is completely crys-tallized for a substrate heated up to 300 °C, whereas complete crystallization of a thinner film (10 nm) re-quires heating the substrate at 584 °C.
Except for the F2 sample (see Table I for the coding of the specimens), the films composition is systematically richer in aluminum compared to the bulk alloy. The amount of aluminum in the films varies from 72.6 to 85.6 at.% and plays an important role in the resulting structure as we show in the next section.
B. In situ annealed amorphous films
To know if it was possible to obtain crystallized films by heating as deposited amorphous samples, we per-formed postannealing in situ in the electron microscope, using F1a, F1b, and F1c samples (Table I). The annealing treatment occurs at 460 °C during 24 h for F1a sample and at 600 °C for F1b and F1c films for 38 and 20 h, respectively.
The first step of crystallization occurs after 2 h of annealing; it is followed by the growth of crystallites, but the major part of the layer remains amorphous even after several hours of annealing.
A bright-field image of the F1a sample is shown in Fig. 1(a). This micrograph points out the growth of small crystals in an amorphous matrix. Most crystals possess a square shape, showing a preferential growth texture, namely the〈100 〉 zone axis of a cubic phase with a lattice parameter a⳱ 9.12 Å. This phase corresponds precisely to the cubic␥-brass ␥–Al9(Cr,Fe)4, isostructural with the
binary Al9Cr4compound. The phase composition
meas-ured by EDS is precisely close this stœchiometric com-position (Table II), with a poor amount of iron. This phase, which was identified in the binary system by Brad-ley and Lu5and in the ternary one by Palm,6crystallizes in the I4¯3m space group. Its complete structure was de-scribed by Brandon et al.7
The ␥-brass phases were ob-served in several binary alloys. Their structure is built up by atomic clusters of 26 atoms. The cluster is a sequence
TABLE I. Preparation parameters (thickness and temperature) of Al-Cr-Fe thin films and obtained microstructures and compositions.
Thin film samples Estimated thickness (nm) Preparation temperature Microstructure Nominal composition of the precursor bulk alloy (at.%)
Thin film composition measured by EDS (at.%)
F1a, F1b, F1c 10 Room temperature Amorphous C⳱ Al72.5Cr19.5Fe8 Al85.6Cr11.6Fe2.8
F2 20 Room temperature Amorphous + crystallized D⳱ Al75.5Cr15.8Fe8.7 Al72.6Cr21.7Fe5.7
F3 10 200 °C Amorphous + crystallized E⳱ Al77.5Cr14.5Fe8 Al79.1Cr13.8Fe3.1
F4 30 325 °C Crystallized A⳱ Al67.6Cr23.3Fe9.1 Al77.7Cr18.0Fe4
F5 10 400 °C Amorphous + crystallized E⳱ Al77.5Cr14.5Fe8 Al79.7Cr11.9Fe8.4
F6 10 325 °C Amorphous + crystallized B⳱ Al70Cr22Fe8 Al73.3Cr20.6Fe6.1
of atomic shells, i.e., an inner tetrahedron of 4 atoms, surrounded by an outer tetrahedron, then by an octahe-dron of 6 atoms, and finally by a cuboctaheoctahe-dron of 12 atoms. The cubic␥-brass phases are either primitive with a CsCl-type of cell (containing two clusters with different atomic decoration),8 or body-centered (two
identical clusters) or face-centered (clusters with 4 dif-ferent atomic compositions).9 If the two first types ex-hibit a lattice parameter around a⳱ 9 Å, the last type corresponds to a superstructure of the two former ones with a larger lattice parameter (a⯝ 18 Å).
An alternative description of these structures was pro-posed by Brandon et al.10
The ␥-brass phases are also approximations of the tetrahedral stacking. Each atom in the structure is surrounded by 12 atoms forming a dis-torted icosahedron. This polyhedron is convex, with no internal atoms except the central one and possesses 20 triangular facets. All atoms on the external shell have a surface coordination number 5 so that each atom is the common vertex of 20 tetrahedra. The icosahedra sur-rounding the outer tetrahedron (first description scheme) are coupled into a tetrahedral arrangement by mutual face sharing.11This icosahedra arrangement forms a 38-atom cluster with an icosahedric symmetry of higher dimension.12
We have already observed a rhombohedral ␥-brass phase (distortion of the cubic lattice) in an Al–Cr–Fe bulk alloy.4
The [001], [110], [115], [113], [111], and [22¯1] zone axes electron-diffraction patterns (EDPs) of the cubic ␥–Al9(Cr,Fe)4phase are presented in Fig. 1. The␥-brass
phases are considered approximants of both decagonal and icosahedral phases. In particular, the [113] and [110] directions possess orientation relationships with the 10-fold and the 5-10-fold axes of quasicrystalline phases, re-spectively. Indeed, these directions correspond to two different 5-fold axes of the icosahedra building up the structure. For example, particular plane angles can be measured on EDPs, like 36°⳱ /5 [Figs. 1(c) and 1(e)]. The second sample F1b is a mixture of two phases. The first one is the orthorhombic O1 approximant,
pri-mary discovered in the Al–Cu-Cr–Fe system13 and also observed in the Al–Cr–Fe system.3 Figure 2 shows a bright-field image of the sample and the EDPs along the [011], [1¯01], [101], and [001] zone axes of this approxi-mant. This phase is a (3/2; 2/1) approximant of the de-cagonal phase with rather large lattice parameters: a⳱ 32.3 Å, b⳱ 12.4 Å, c ⳱ 23.6 Å. The measured com-position (Al78.4Cr17.6Fe4) for this phase is close to the
nominal composition of bulk alloy (i.e., Al77.5Cr16.5Fe6)
where the O1structure was primarly observed. 3
The second phase we observed in this sample is again a cubic␥-brass phase, which could be indexed in three different ways by considering either a primitive cell with a ⳱ 9.12 Å or a body-centered cell with a doubled parameter (18.24 Å), or a face-centered cell with a doubled parameter as well. We believe that this phase is face-centered because of the occurrence of a similar structure in the Al–Cu–Cr system, usually called –Al-CuCr.14–18 In addition, no primitive ␥-brass phase was ever quoted in the two systems under consideration
FIG. 1. (a) Dark-field micrograph of F1a thin film; (b) electron dif-fraction pattern (EDP) along the [001] zone axis of the cubic ␥–Al9(Cr,Fe)4 ␥-brass phase; (c) same, for the [110] zone axis;
(d) same, for the [115] zone axis; (e) same, for the [113] zone axis; (f) same, for the [111] zone axis; and (g) same, for the [22¯1] zone axis.
(Al–Cr and Al–Cu–Cr). Concerning the second possibil-ity, no body-centered cell with a lattice parameter around 18 Å was discovered to our knowledge in any system known to contain␥-brass phases. Moreover, all the cubic superstructures already characterized in several systems (like Al–Cu–Cr, Pt-Zn, Rh-Mg, Cu–Sn, Fe–Ni–Zn, and Ga–Fe–Cu–Si) are face-centered.9,11,12,18–22
Figure 3 presents the EDPs along the [001], [111], and [1¯10] zone axes of the cubic superstructure. Comparison between Figs. 1 and 2 shows strong structural relationships be-tween the two cubic ␥-brass phases observed in this work. In particular, {330} and {600} spots of the body-centered-cubic (bcc) phase fall at the same distance than {660} and {12 00} planes of the face-centered-cubic (fcc) superstructure. This phase is poor in iron as the bcc structure but is richer in aluminum, and is then closer to the composition of the O1approximant.
In the last annealed sample (F1c), we have identified 3 phases, namely O1–AlCrFe phase,␥–Al9(Cr,Fe)4 phase
and the monoclinic –Al1 3(Cr,Fe)4 phase. The
–Al13Fe4 phase is a well-known approximant of both
decagonal and icosahedral phases.23 This structure was previously observed in the Al–Cr–Fe system by Palm.6 Figure 4 presents a few EDPs of this phase taken along the [100], [301], [101], [010], and [110] zone axes. In the mean time, we have observed a structure that is clearly derived from that of the of –Al13(Cr,Fe)4 phase. The
EDPs of this new phase (called hereafter⬘) can be in-dexed by considering a primitive monoclinic cell with the same parameters as in. In other terms, the
extinc-tions due to the C-based cell are not visible anymore in the EDPs taken along the [100], [101], and [110] zone axes (Fig. 5). Compositions of these two phases are close (Table II), and richer in aluminum than the stoichiometric Al13(Cr,Fe)4phase.
B o t h E D P s a l o n g t h e [ 0 1 0 ] z o n e a x e s o f –Al13(Cr,Fe)4show twins on (100) planes: in Fig. 4(d),
the two exciting crystal lattices in twin relationship are underlined in the pattern (spots marked A and B) together with the trace of the orthorhombic cell of this phase (C). In Fig. 4(e), the number of twins is too large to distin-guish the two lattices. Another kind of twins is visible in the EDP along [110] [Fig. 4(f)]; i.e., the twin plane is (001). The EDP along the [101] direction [Fig. 4(c)] shows twins along a 10-fold symmetry. This can be un-derstood by considering a composite EDP of twins. Fi-nally, the elongated shape of the spots in Fig. 4(b) reveals the presence of planar defects perpendicularly to the [010] direction. In this case, the twins lie on either a (100) or a (001) plane.
The [010] direction –Al13(Cr,Fe)4is known to be in
orientation relationship with the 10-fold axis of the de-cagonal phase. Actually the angle between (100) and (001) planes is 72° (which is related to the golden mean). The occurrence of twins showing a 10-fold symmetry along this zone axis is a well known effect as well.24 Another point is that the (100) planes of the lattices in twin relationship do no have all their spots superimposed. The coincidence of spots occurs only for l⳱ 0, 3, 5, 8, … [Fig. 4(e)]. This sequence defines the beginning of the
TABLE II. Designation, cell parameters, space group and composition of phases observed in the present work.
Designation Lattice parameters Space group Composition measured
by EDS (at.%) Remarks References
␥–Al9(Cr,Fe)4 a⳱ 9.12 Å Cubic I 4 3 m Al71.5Cr27.5Fe1.0 Approximant of icosahedral and decagonal phase 7
O1–AlCrFe a⳱ 32.3 Å Orthorhombic Bmm2 Al78.4Cr17.6Fe4.0 (3/2; 2/1) approximant of decagonal phase 4
b⳱ 12.4 Å c⳱ 23.6 Å
–AlCrFe a⳱ 18.24 Å Cubic Fm3m Al77.1Cr21.2Fe1.7 Superstructure of␥–Al9(Cr,Fe)4 This work
–Al13(Cr,Fe)4 a⳱ 15.49 Å Monoclinic C2/m Al81.4Cr3.3Fe15.3 Approximant of icosahedral and decagonal phases 8 b⳱ 8.09 Å
c⳱ 12.35 Å
 ⳱ 107.7°
⬘–Al13(Cr,Fe)4 a⳱ 15.49 Å Monoclinic P Al80.9Cr4.1Fe15.0 This work
b⳱ 8.09 Å c⳱ 12.35 Å
 ⳱ 107.7°
X–AlCrFe a⳱ 10.6 Å Monoclinic C ⭈⭈⭈ b lattice parameter could not be determined This work
b⳱ ? Å
c⳱ 27.0 Å
 ⳱ 112°
OE–AlCrFe a⳱ 12.5 Å Orthorhombic P Al75.0Cr6.5Fe18.5 (1/1; 1/1) approximant of decagonal phase This work
b⳱ 12.4 Å c⳱ 14.3 Å
OF–AlCrFe a⳱ 7.7 Å Orthorhombic P Al81.2Cr12.6Fe6.2 (1/0; 2/1) approximant of decagonal phase This work
b⳱ 12.4 Å c⳱ 23.7 Å
Finonacci series, known to be related to approximants of quasicrystals. This effect was also observed for twins in the monoclinic 2-Al13Co4 phase.
25
This phenomenon can be explained via the occurrence of angles related to the golden mean. Indeed, when the two lattices are in coincidence, the following relationship takes place
cos 72°⳱ lda/2hdc ,
where da and dc are the distances between two spots
along the [100] direction and the [001] direction, respec-tively, and h and l are the Miller indices. This relation-ship leads to the following one: l⳱ (2 − )h. For h ⳱ 1, 2, 3, … , the two lattices are therefore in coincidence for l≈ 3, 5, 8, …
Figures 6(a) and 6(c) show high-resolution electron microscopy micrographs of the–Al13(Cr,Fe)4phase
re-corded along the [010] and [110] direction, respectively. On both pictures, twin defects on planes (100) and (001)
are clearly visible. From Fig. 6(b), we are able to deduce the presence of two kinds of defects on (100) planes. A defect of type 1 corresponds to a mirror operation to-gether with a glide component, whereas a defect of type 2 is given by a glide operation without mirror symmetry and introducing a new orthorhombic lattice between two monoclinic cells. Structural models of both kinds of twins were deduced from the structure of–Al13(Cr,Fe)4.
Figure 7(a) presents this structure along the [010] direc-tion according to the structure determinadirec-tion make by Grin et al.26
If the clusters of the structure are represented by pentagons, the monoclinic lattice is described by a parallel tiling of elongated hexagons. The type 1 of twin defects is drawn in Fig. 7(b) and shows that hexagons are locally arranged in staggered rows. The glide vector is then equal to
FIG. 2. (a) Bright-field micrograph of F1b thin film; (b) EDP along the [011] zone axis of the O1approximant phase observed in an
an-nealed Al–Cr–Fe film; (c) same, for the [1¯01] zone axis; (d) same, for
the [101] zone axis; and (e) same, for the [001] zone axis. FIG. 3. (a) EDP along the [001] zone axis of the face-centered cubic superstructure; (b) same, for the [111] zone axis; and (c) same, for the [1¯10] zone axis.
T= d
冋
0 0 1册
,
with d, the pentagon edge length and, the golden ratio. Therefore the magnitude of the glide vector is T ⳱ -2
c⳱ d ⳱ 4.768 Å.
A second type of twin defect was already observed in
this structure.27–29 This twin mechanism introduces an orthorhombic phase with the following parameters: a⳱ 14.45 Å, b⳱ 8.089 Å, c ⳱ 12.485 Å [Fig. 7(c)]. This new primitive structure corresponds to the Al13Co4phase
and is a (1/1; 1/1) approximant of the decagonal phase. Actually, we also observed this structure in our sample [Fig. 8(a)].
These twins mechanisms explain the occurrence of
FIG. 4. (a) EDP along the [100] zone axis of the monoclinic–Al13(Cr,Fe)4phase; (b) same, for the [301] zone axis; (c) same, for the [101] zone
axis; and (d) same, for the [010] zone axis. A twin defect is visible on the (100) plane. Both crystals in twin relationship are drawn (A and B); the rectangular cell (C) of crystallite A is shown on the EDP as well. (e) EDP along the [010] zone axis showing a large amount of twins on (100) planes and (f) EDP along the [110] zone axis showing a large amount of twins on (001) planes.
10-fold symmetry in EDPs along the [010] zone axis. Indeed, the glide operation corresponds to a diagonal length of a pentagon and allows sharing of pentagons of neighboring lattices through the twin.25This sharing, to-gether with a rotation by 36° of elongated hexagons at twin boundaries, induces strong spots in EDPs in 10-fold symmetry at distances, in reciprocal space, that corre-spond to the edge length of a pentagon in direct space.
We also performed high-resolution electron micros-copy (HREM) on the other phases. In particular, we focused on a part of the sample as shown in Fig. 3(a). This zone corresponds to four grains in orientation
FIG. 5. (a) EDP along the [100] zone axis of the monoclinic ⬘-Al13(Cr,Fe)4phase; (b) same, for the [101] zone axis; and (c) same, for
the [110] zone axis.
FIG. 6. (a) High-resolution electron microscopy (HREM) micrograph of–Al13(Cr,Fe)4phase along the [010] zone axis showing twins on
the (100) plane. (b) Same at higher magnification: both monoclinic and corresponding orthorhombic lattices are drawn. Two different kinds of twins are visible (note 1 and 2 on the picture). (c) HREM micrograph of–Al13(Cr,Fe)4phase along the [110] zone axis showing twins on
relationships as illustrated in Fig. 3. All EDPs are repre-sented at the same scale and orientation. It clearly ap-pears that a strong crystallographic link exists between these phases along their respective pseudo-3-fold axis, since the stronger spots forming a hexagonal pattern fall exactly at the same position. These phases are –Al13(Cr,Fe)4, ␥–Al9(Cr,Fe)4, O1–AlCrFe, and
X–Al-CrFe. This last phase is unidentified yet and can be in-dexed by considering a monoclinic C-based lattice, with
parameters a⳱ 10.6 Å, c ⳱ 27.0 Å, and  ⳱ 112°. The following orientation relationships are then deduced from the EDPs:
关100兴Ⲑ Ⲑ关111兴␥Ⲑ Ⲑ关101兴O1Ⲑ Ⲑ关010兴X
共010兲Ⲑ Ⲑ共01¯1兲␥Ⲑ Ⲑ共909¯兲O1Ⲑ Ⲑ共102兲X 共025兲Ⲑ Ⲑ共101兲␥Ⲑ Ⲑ共55¯5¯兲O1Ⲑ Ⲑ共500兲X
共02¯5兲Ⲑ Ⲑ共11¯0兲␥Ⲑ Ⲑ共555¯兲O1Ⲑ Ⲑ共1¯05兲X .
We notice the presence of twins in the ␥–Al9(Cr,Fe)4
phase, as shown by the satellite spots on each EDP and on HREM micrographs. These defects will be studied more in details in another paper.2
Finally, we observed two news approximants in this system, which we named OE and OF phases (Fig. 8).
Both phases possess primitive orthorhombic cells, with the following lattice parameters: aE ⳱ 12.5 Å, bE ⳱
12.4 Å, cE⳱ 14.3 Å; aF⳱ 7.7 Å, bF⳱ 12.4 Å, cF⳱
23.7 Å. These phases are therefore, respectively, the (1/1; 1/1) and (1/0; 2/1) approximants of the decagonal phase. Their respective compositions (OE: Al75.0Cr6.5Fe18.5and
OF: Al81.2Cr12.6Fe6.2) show that OF-phase leads in the
same part of the ternary diagram as O1-phase, but that
OE-phase is located in the chromium rich part of the
diagram which is known to contain also approximant structures.
The samples we studied include a large number of phases, some of them being necessarily metastable ac-cording to the rules of thermodynamics. Table II sum-marizes the features of all the phases observed in this work. Obviously the composition plays an essential role during the growth: diffusion of elements allows crystal-lisation of phases rich in aluminum (like approximants) together with stable phases belonging to the equilibrium phase diagram (like␥-brass phases).
C. Crystallized films
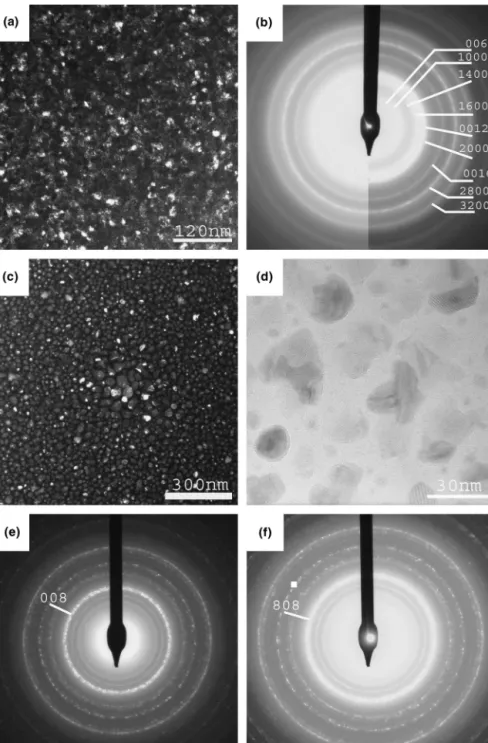
The F4 and F7 films were crystallized in situ during preparation. Figures 10(a), 10(c), and 10(d) present bright-field micrographs of both samples. The grain size is slightly different in each film (5–10 nm for F4; 5–20 nm for F7) and the second film does not cover totally the substrate, probably due to a weaker thickness in the coating. This last point is confirmed by the micro-graph in Fig. 10(d) showing the film at high magnifica-tion. We can also see periodic arrays of planes in some grains. The corresponding EDPs are shown in Fig. 10(b), 10(e), and 10(f). Indexing of the observed diffraction rings shows that both films are constituted of the O1
approximant (alternatively, by a mixture of close ap-proximants or nanodomains of apap-proximants). Concern-ing the second film, the rConcern-ings are dotted, showConcern-ing that the dimensions of the crystallites are larger in this sample. Moreover, comparison between EDPs taken in
FIG. 7. (a) Structural model of the monoclinic–Al13(Cr,Fe)4phase
along the [010] zone axis. White circles: Al atoms, full circles: tran-sition metal atoms. (b) Structural model of twin defects (type 1) on plane (100). (c) Same, for type 2 of twins on plane (100) [see Fig. 6(b)].
two different parts of the sample shows that diffraction from (0 0 8) planes is the most intense in the first case [Fig. 10(e)] whereas the contribution of (8 0 8) planes is the most important in the second part [Fig. 10(f)]. We suggest that a texture effect takes place and explains this phenomenon which is in agreement with the ob-servation done by brightfield diffraction [Fig. 10(d)]. The composition measured by EDS (Table I) is in agree-ment with this structural characterization, since both samples possess a composition close to that of the O1
approximant.3
IV. PROPERTIES
A. Electron energy loss spectra measurements Figure 11 presents aluminum electron energy loss spectra (EELS) of sample F4 (thick and crystallized), F6 (thinner and partially crystallized), and F7 (thin and crystallized after annealing), together with an aluminum
FIG. 8. (a) EDP along the [010] zone axis of the OE approximant
phase and (b) EDP along the [010] zone axis of the OFapproximant
phase.
>
FIG. 9. (a) Bright-field micrograph of F1c thin film; (b) EDP along the [100] zone axis of the monoclinic-Al13(Cr,Fe)4phase; (c) EDP
along the [111] zone axis of the cubic␥–Al9(Cr,Fe)4␥–brass phase;
(d) EDP along the [101] zone axis of the O1 approximant phase;
(e) EDP along the [010] zone axis of the monoclinic X-AlCrFe phase (see text); (f) HREM image of–Al13(Cr,Fe)4phase; (g) same, for
Al9(Cr,Fe)4␥-brass phase; (h) same, for the O1approximant phase;
metal thin film (10 nm) obtained using the same pro-cedure. These spectra are compared with those of alumi-num and alumina according to Ref. 30. All the samples present the same features than those experienced on bulk aluminum. In contrast, the aluminum spectrum is rather similar to that of alumina, in particular with the presence of the Al L2,3 peaks of the oxide. AlCrFe samples are therefore less oxidized than the pure aluminum film, even if they are very thin whatever the preparation
process used. This point was also observed for bulk samples.4,31
B. Optical properties
Figures 12(a) and 12(b) show optical reflectivity and transmission measurements of F4, F6, and F7 samples together with the glass substrate within a large range of wavenumbers. The spectra are similar, with a difference in intensity in agreement with thickness differences
FIG. 10. (a) Bright-field micrograph of F4 thin film; (b) EDP of the F4 thin film indexed by considering the orthorhombic O1approximant;
(c) bright-field micrograph of F7 thin film; (d) same, at higher magnification showing isolated grains; (e) EDP of F7 thin film indexed by considering the orthorhombic O1phase; and (f) same in another part of the sample showing a texture effect.
(thinner samples are more transparent and therefore the reflective). Nevertheless, the reflectivity for the thicker sample decreases weakly between 3 × 10⁴ and 5 × 104 cm−1. This behavior is comparable to the one ob-served on bulk approximants.32The transmission of the glass substrate is almost constant except between 0 and 2 × 103 cm−1 (no transmission) and around 104 cm−1 where an absorption depression occurs. In contrast, trans-mission of the Al–Cr–Fe samples decreases slowly from infrared to visible range. Due to the substrate, all samples are totally opaque in the ultraviolet range.
The absorption value was deduced from these spectra after correction for the substrate contribution [Fig. 12(c)] according to the relationship: A ⳱ 1 – (R + T). We simply do not consider here any loss contribution. The behavior of samples F6 and F7 is comparable, with an increasing absorption from low frequencies to higher val-ues. The absorption of the thicker sample is also increas-ing between 1.4 × 10⁴
and 2.3 × 10⁴
cm−1
but is weaker than in the other films. Conversely, the absorption is strongly decreasing from infrared to 1.4 104 cm−1. In conclusion, there is no noticeable difference between a crystallized film (F7 sample) and an amorphous one (F6). To probe the optical properties of the material, the film must be thick enough (at least 30 nm) as, e.g., sample F4. In this case, the transmission is too weak and does not allow any applications.
C. Wetting properties
By means of contact-angle measurements, we have studied the wetting of our samples (F4, F6, F7) by water together with that of the glass substrate and the alumi-num thin film. Table III presents wetting angles of pure water at the surface of these five samples. The first set of data corresponds to measurements performed a short time (less than 24 h) after preparation whereas the second
set of data was obtained 8 weeks after preparation. The wetting angle is systematically larger for all Al–Cr–Fe samples than for the aluminum film. The larger angle corresponds to the thicker sample. It appears that the wetting angle has considerably increased between the two sets of measurements. In this case, larger values of wetting angles are obtained for the F4 and F7 samples,
FIG. 11. Comparison of Al L2,3 EELS spectra of F4, F6, and F7 thin films, bulk aluminium metal, aluminum thin film, and alumina.
FIG. 12. (a) Reflectivity of F4, F6, and F7 thin films and glass sub-strate, (b) same, for transmission, and (c) same, for absorption.
which are both crystallised and constituted of approxi-mate phases. Therefore, it seems that composition, thick-ness and crystalline structure play together a role in de-termining the wetting mechanisms. Whatever the coating that was deposited at the surface of the glass substrate, the wetting angle is largely increased in comparison to the angle measured on a free-surface substrate.
V. CONCLUSION
We were able to produce approximant thin films by using the flash evaporation technique. The Al–Cr–Fe system we chose contains several intermetallic phases known to be approximants of both decagonal and icosa-hedral quasicrystals. Composition of the bulk alloys used for evaporation has to be close to the one looked at for making the films. The preparation technique allows the growth of metastable phases that are not listed in the phase diagram (i.e., O1-, OE-, OF-, ⬘-, -phases) and
stable phases as well (-, ␥-phases). Twin defects occur frequently in at least two structures (i.e., and ␥) and should be related with the preparation technique. It ap-pears also that preferential growth orientation occurs, de-spite the substrate is amorphous. Moreover, the phases present orientation relationships between each other, which suggest the possibility of epitaxial growth on well-defined substrates.
Optical applications for such films can possibly be considered if the thickness is large enough so that film properties would be those of bulk approximants. In all cases, the wetting properties against water are rather sat-isfactory compared to those of glass substrates or alumi-num thin films.
ACKNOWLEDGMENTS
The authors would like to thank gratefully M. Vergnat and F. Mouginet for their fruitful help to produce thin films, and J.B. Ledeuil for microprobe analysis. We gratefully acknowledge the financial support offered to one of us (V. Demange) by Région Lorraine and Saint-Gobain Recherche as well as by the French Ministry of
Research and New Technologies under contract “ERT Quasicristaux Industriels.”
REFERENCES
1. L. Johann, A. En Naciri, L. Broch, V. Demange, F. Machizaud, and J.M. Dubois: Spectroscopic ellipsometric characterization of approximant thin films of Al–Cr–Fe deposited on glass substrates.
Physica E. 17, 552 (2003).
2. V. Demange, PhD, Thesis Dissertation, INPL, (unpublished). 3. V. Demange, J.S. Wu, V. Brien, F. Machizaud, and J.M. Dubois:
New approximant phases in AlCrFe. Mater. Sci. Eng. A 294-296, 79 (2000).
4. V. Demange, J.W. Anderegg, J. Ghanbaja, F. Machizaud, D.J. Sordelet, M. Besser, P.A. Thiel, and J.M. Dubois: Surface oxidation of AlCrFe alloys characterized by x-ray photoelectron spectroscopy. Appl. Surf. Sci. 173, 327 (2001).
5. A.J. Bradley and S.S. Lu: An x-ray study of the chromium-aluminium equilibrium diagram. J. Inst. Met. 60, 319 (1937). 6. M. Palm: The Al–Cr–Fe system-phases and phase equilibria in the
Al–rich corner. J. Alloys Compd. 252, 192 (1997).
7. J.K. Brandon, W.B. Pearson, P.W. Riley, P.C. Chieh, and R. Stokhuyzen: ␥-brasses with R cells. Acta Crystallogr. B 33, 1088 (1977).
8. A.J. Bradley and S.S. Lu: The crystal structures of Cr2Al and
Cr5Al8. Z. Krist. 96, 20 (1937).
9. M.H. Booth, J.K. Brandon, R.Y. Brizard, C. Chieh, and W.B. Pearson:␥-brasses with F cells. Acta Crystallogr. B 33, 30 (1977).
10. J.K. Brandon, P.C. Chieh, W.B. Pearson, and P.W. Riley: An er-ror parameter analysis of tetrahedral configurations in ␥ brass structures. Acta Crystallogr. A 31, 236 (1975).
11. L. Arnberg, A. Jonsson, and S. Westman: The structure of the ␦-phase in the Cu–Sn system: A phase of ␥-brass type with an 18Å superstructure. Acta Crystallogr. A 31, S98 (1975).
12. S.P. Ge and H.K. Kuo: Ordered␥-brass structures coexisting with the decagonal quasicrystal in a Ga46Fe23Cu23Si8alloy. J. Mater.
Res. 14, 2799 (1999).
13. C. Dong and J.M. Dubois: Quasicrystals and crystalline phases in Al65Cu10Fe10Cr5alloy. J. Mater. Sci. 26, 1647 (1991).
14. H. Selke, U. Vogg, and P.L. Ryder: Approximants of the icosahe-dral phase in as-cast Al65Cu20Cr15. Philos. Mag. B 65, 421 (1992).
15. W. Liu and U. Köster: Eutectoid decomposition of the icosahedral quasicrystals in melt-spun Al65Cu20Cr15alloys. Mater. Sci. Eng. A
154,193 (1992).
16. V. Khare, N.P. Lalla, R.S. Tiwari, and O.N. Srivastava: On the new structural phases in Al65Cu20Cr15 quasicrystalline alloy.
J. Mater. Res. 10, 1905 (1995).
17. K. Sugiyama, H. Saito, and K. Hiraga: On the crystal structures of the Al–Cu–Cr alloy system. J. Alloy. Comp. 342, 148 (2002). 18. Y.H. Qi, Z.P. Zhang, Z.K. Hei, and C. Dong: The microstructure
analysis of Al–Cu–Cr phases in Al65Cu20Cr15 quasicrystalline
particles/Al base composites. J. Alloys Compd. 285, 221 (1999). 19. A. Johansson and S. Westman: Determination of the structure of cubic gamma-Pt,Zn: A phase of gamma brass type with Å super-structure. Acta Chem. Scand. A 24, 3471 (1970).
20. L. Westin and L.E. Edshammar: On the crystal structure of RhMg6. Acta Chem. Scand. A 25, 1480 (1971).
21. L. Arnberg, A. Jonsson, and S. Westman: The structure of the ␦-phase in the Cu–Sn system. A phase of ␥-brass type with an 18 Å superstructure. Acta Chem. Scand. A 30, 187 (1976). 22. S. Lidin, M. Jacob, and A.K. Larsson: (Fe,Ni)Zn6.5, a
superstruc-ture of␥-brass. Acta Crystallogr. C 50, 340 (1994).
23. J.N. Barbier, N. Tamura, and J.L. Verger-Gaugry: Monoclinic TABLE III. Contact angle measurements on different samples with an
interval of 8 weeks between the two sets of experiments.
Sample Contact angle (°) First set of measurement Second set of measurement F4 66 ± 1 90 ± 2 F6 85 ± 2 94 ± 2 F7 65 ± 1 94 ± 2 Aluminum film 62 ± 1 85 ± 2 Glass substrate 20 ± 0.5 20 ± 0.5
Al13Fe4approximant phase: A link between icosahedral and
de-cagonal phases. J. Non-Cryst. Solids 153–154, 126 (1993). 24. X.D. Zou, K.K. Fung, and K.H. Kuo: Orientation relationship of
decagonal quasicrystal and tenfold twins in rapidly cooled Al–Fe alloy. Phys. Rev. B 35, 4526 (1987).
25. X.L. Ma and K.H. Kuo: Crystallographic characteristics of the Al–Co decagonal quasicrystal and its monoclinic approximant2
-Al13Co4. Metall. Mater. Trans. A 25, 47 (1994).
26. J. Grin, U. Burkhardt, and M. Ellner: Refinement of the Fe4Al13
structure and its relationships to the quasihomologocal homeo-typical structures. Z. Kristall. 209, 479 (1994).
27. J. Grin, U. Burkhardt, M. Ellner, and K. Peters: Crystal structure of orthorhombic Co4Al13. J. Alloys Compd. 206, 243 (1994).
28. K. Saito, K. Sugiyama, and K. Hiraga: Al13M4-type structures and
atomic models of their twins. Mater. Sci. Eng. A 294–296, 279 (2000).
29. X.L. Ma, H. Liebertz, and U. Köster: Multiple twins of mono-clinic Al13Fe4showing pseudo-orthorhombic and fivefold
sym-metries. Phys. Status Solidi 158, 359 (1996).
30. C. Cahn and O.L. Krivanek: EELS Atlas. Edited by ASU HREM Facility, Tempe, AZ and Gatan Warrendale, PA (1983). 31. V. Demange, J.W. Anderegg, F. Machizaud, D.J. Sordelet,
P.A. Thiel, and J.M. Dubois: New approximants in the Al–Cr–Fe system and their oxidation resistance. J. Alloys Compd. 342, 24 (2002).
32. V. Demange, A. Milandri, M.C. de Weerd, F. Machizaud, G. Jeandel, and J.M. Dubois: Optical conductivity of Al–Cr–Fe approximant compounds. Phys. Rev. B 65, 144205 (2002).
![FIG. 1. (a) Dark-field micrograph of F1a thin film; (b) electron dif- dif-fraction pattern (EDP) along the [001] zone axis of the cubic](https://thumb-eu.123doks.com/thumbv2/123doknet/14927454.664236/3.945.101.461.145.909/fig-dark-field-micrograph-electron-fraction-pattern-cubic.webp)
![Figure 3 presents the EDPs along the [001], [111], and [1¯10] zone axes of the cubic superstructure](https://thumb-eu.123doks.com/thumbv2/123doknet/14927454.664236/4.945.104.848.162.562/figure-presents-edps-zone-axes-cubic-superstructure.webp)
![FIG. 2. (a) Bright-field micrograph of F1b thin film; (b) EDP along the [011] zone axis of the O 1 approximant phase observed in an an-nealed Al–Cr–Fe film; (c) same, for the [1¯01] zone axis; (d) same, for](https://thumb-eu.123doks.com/thumbv2/123doknet/14927454.664236/5.945.573.753.147.756/fig-bright-field-micrograph-approximant-phase-observed-nealed.webp)
![FIG. 5. (a) EDP along the [100] zone axis of the monoclinic ⬘ - -Al 13 (Cr,Fe) 4 phase; (b) same, for the [101] zone axis; and (c) same, for the [110] zone axis.](https://thumb-eu.123doks.com/thumbv2/123doknet/14927454.664236/7.945.547.784.136.912/fig-edp-zone-axis-monoclinic-phase-zone-axis.webp)
![FIG. 8. (a) EDP along the [010] zone axis of the O E approximant phase and (b) EDP along the [010] zone axis of the O F approximant phase.](https://thumb-eu.123doks.com/thumbv2/123doknet/14927454.664236/9.945.495.838.133.1123/fig-edp-zone-axis-approximant-phase-approximant-phase.webp)