International Immunology, Vol. 1, No. 5 © 1989 Oxford University Press 0953-8178/89 $3 00
A large proportion of bovine T cells
express the yd T cell receptor and show a
distinct tissue distribution and surface
phenotype
Charles R. Mackay and Wayne R. Hein
Base) Institute for Immunology, Grenzacherstrasse 487, CH-4058 Basel, Switzerland
Key words: y8 T cells, tissue distribution, surface phenotype
Abstract
The numbers, phenotype, and tissue distribution of y8 T cells In cattle were studied using two monoclonal antibodies (mAbs) which react with the bovine yd T cell receptor (TCR). Both mAbs stained 2 0 - 4 0 % of T cells In peripheral blood, and immunopreclpitated molecules of 44 and 36 kd (reduced) and 70 - 80 kd (non-reduced). In cattle the majority of circulating y8 T cells showed a distinct surface phenotype; they expressed T19, a 215 kd molecule described In sheep and cattle which marks only y6 T cells. Bovine y8 T cells were also CD2-, CD4-, and mostly C D 8 - , and failed to express CD6, a molecule possibly Involved In T cell activation. The
distribution of 76 T cells in cattle lymphoid tissues differed markedly from that in humans, in that bovine yd T cells were concentrated around lymph node trabeculae and were usually sparse or absent from the B cell and T cell domains of lymph nodes. Like most other species studied, y8 T cells In cattle were localized to epithelial surfaces, particularly within the skin and Intestine, indicating that it was at these sites where 76 T cells functioned. Our results provide further evidence for the unusual localization, reclrculatlon pattern, and phenotype of 76 T cells, and also show that some features of y& T cells can differ quite markedly from species to species.
T cells bearing the 76 T cell receptor (TCR) were identified only 3 years ago (1 - 6 ) , and their function is still uncertain. However, one distinguishing feature of 76 T cells is their specific homing and localization to certain epithelial surfaces (7-12), which suggests that they play a role in the elimination of infected or transformed epithelial cells. Unlike the a/3 T cell subset, at least a proportion of 76 T cells recognize antigen in a major histo-compatibility complex (MHC)-unrestricted fashion (13,14), or in the context of non-classical class I antigens such as Qa-1 (15). Moreover, 76 T cells usually lack CD4 or CD8, two accessory molecules employed by a/3 T cells for the recognition of antigen plus MHC
The relative contributions of 76 versus a/3 T cells towards immune defense may differ significantly between species since the proportions of these two T cell types can vary quite widely (12,16,17). We have characterized 76 T cells in animals in one evolutionary niche, the ruminants, and have examined which properties of 76 T cells are conserved through evolution. Here
we show that cattle, like sheep, have very large numbers of y& T cells, and that these cells differ in many ways from 76 T cells of other species.
To characterize the 76 TCR and 76 T cells in cattle, we took advantage of the cross-reactivity of anti-75 monoclonal antibodies (mAbs) which were originally raised against the 76 TCR of sheep (12). A FACS analysis of bovine peripheral blood lymphocytes (PBL) with several mAbs is shown on the right side of Fig. 1. The mAb 86D (anti-y5) reacted with a large proportion of bovine PBL (18% in this experiment), and another yd mAb, 69C, showed a similar fluorescence profile (not shown). Both mAbs immuno-precipitated from surface-labeled PBL the bovine 76 TCR (Fig. 1) which migrated on sodium dodecyl sulfate - polyacrylamide gel electrophoresis (SDS - PAGE) with a molecular size of 44 and 36 kd (reduced) and 70 - 80 kd (non-reduced). In addition to the 44 and 36 kd bands, bands of 55 and 32 kd were also evident when an anti-C4 serum was used ( la n e 3. arrows). This antiserum was raised against a peptde corresponding to a highly
Correspondence to- C. R Mackay, as above
Bovine yS T cells 541 O) 0) 86 D a E 06 9 E 1 eo Q
o
i CO 86 D < E 06 9 a E CD 3 CO 19 7 E ILA -n <E 19-1 < E 19 7 .o Ef
»«»|
t
- C D 3 mAb 8 6 0 18% mAb 197 18 % anti-CD4 24:•A
an»l-CD8 20 XFig. 1. SDS - PAGE analysis of the 76 TCR and the T19 molecule immunoprecipitated from surface-labeled bovine PBL. The lymphocyte preparation
used to prepare the lysate contained 24% CD4, 20% CD8, and 18% 76 T cells, as assessed by immunofluorescence staining (see right hand side) Lanes 1 - 4 show material immunoprecipitated by mAbs 86D and 69C (both anti-fJ), an anti-5 serum (11), and an anti-CD3 serum (see ref 19) All four lanes were run under reducing conditions The anti-6 serum (lane 3) immunoprecipitated two bands (arrowed) which were absent from lanes 1 or 2. In lane 4 two bands were present (arrowed) which were absent from lane 3, and presumably represent a[i TCR bands. Lanes 5 - 7 were run under non-reducing conditions. Lanes 8 - 1 0 show material immunoprecipitated by three independently denved mAbs, all of which recognize the 215-220 kdT19 molecule Under non-reducing conditions, the T19 molecule migrated slightly faster (lane 11) The procedure fonmmunopreciprtation and SDS-PAGE followed previously described methods (4), except that in the present experiments the lysis buffer consisted of 10 mM Tris, pH 8 0, 10 mM CHAPS (BioRad), 10 mM lodoacetamide, and 2 mM PMSF Procedures for immunofluorescence staining and flow cytometry were as previously described (4)
log green fluorescence («ntl-y6TCR|
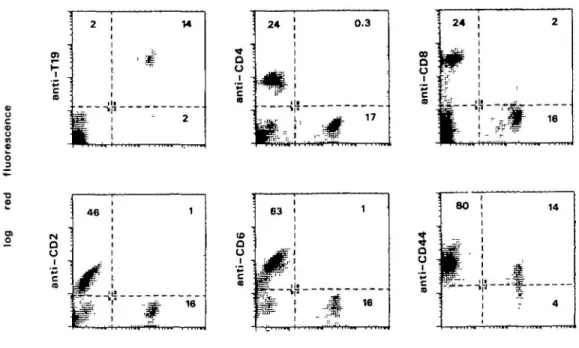
Fig. 2. Two-color immunofluorescence analysis of cattle PBL with the anti-y5 mAb 86D and various other markers. Green fluorescence in all plots
represents staining with FITC-labeled anti-76 mAb 86D Red fluorescence represents staining with biotinytated mAb (as indicated) followed by avidin-PE. Quadrants were constructed in each plot according to control antibody staining, and the percentage of cells stained red only, dual stained, or stained green only is indicated in each quadrant. Sixty per cent Percoll was used for preparation of mononudear cells from cattle blood. Immunofluorescence staining of single cell suspensions was as described (4), except that a FACScan flow cytometer was used (Becton Dickinson, Sunnyvale, CA) Lymphocytes were gated according to their forward and side scatter. In this preparation of PBL, y& T cells identified by mAb 86D comprised - 1 7 % of cells. Other mAbs used were 197 (anti-T19) (19), ILA-11 (anti-CD4) (25), 38-65 (anti-CD8) (4), CH128A (anti-CD2) (26), ILA-27 (anti-CD6) (22), and 25-32 (anti-CD44) (27).
542 Bovine yS T cells A
B
t b B Lp M 'IFig. 3. Distribution of y8 T cells within bovine tissues. Frozen sections were prepared from snap-frozen tissue, and were stained with mAb 86D
using the immunoperoxidase technique, as described (4). (a) Skin. The majority of 86D+ cells were of an irregular shape, and localized to the dermis (D). Small numbers of stained cells were also situated within the epidermis (E) and usually occurred as clusters (arrowed). Magnification x 240. (b) Intestinal epithelium, showing 86D+ cells situated within the lamina propria (LP) and within the epithelium (E). x 150. (c) Thymus tissue section stained with mAb 86D, showing positively stained cells localized mainly within the medulla (M) and also scattered throughout the cortex (C). In the medulla an accumulation of stained cells can be seen surrounding Hasall's corpuscles (arrowed), x 100. ( d - f ) Serial lymph node tissue sections stained with mAb 86D, anti-CD4, and anti-CD8, respectively. B = B cell follicle; T = T cell area; tb = trabecula. x150.
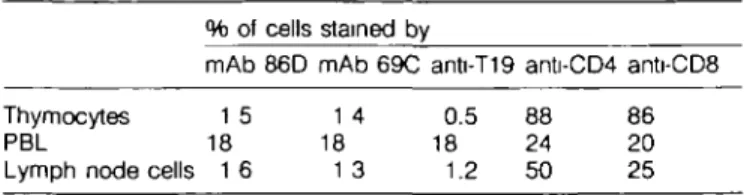
Table 1 . Reactivity of mAbs with bovine thymocytes, PBL, and lymph node cells
Thymocytes PBL
Lymph node cells % of mAb 1 5 18 1 6 cells 86D stained by mAb 69C 1 4 18 1 3 anti-T19 0.5 18 1.2 anti-CD4 88 24 50 anti-CD8 86 20 25 Figures are from a single, representative animal, ~ 8 months of age Lymph node cells were from the parathymic lymph node. Cells were reacted with mAb, foftowed by goat anti-mouse Ig-FITC and were analyzed on a FACScan flow cytometer At least five animals, 8 - 1 2 months of age, were examined, and in all cases the staining values were similar to those reported here for this one animal
conserved region of mammalian C4 [amino acids 159-187 of human C5 (11)]. When an anti-CD3 serum was used to isolate TCR material, the 55, 44, 36, and 32 kd bands (all presumably
yd TCR) were present, as were other bands which presumably
represent a/3 TCR (lane 4, arrowed). The presence of the 55 and 32 kd bands in the immunoprecipitations with anti-6 or anti-CD3 indicates that mAbs 86D and 69C may not recognize all species of 76 TCR molecules. Only the anti-CD3 serum immunoprecipi-tated CD3 molecules, which migrated at - 1 9 - 2 1 kd (lane 4). In ruminants a unique feature of 76 T cells is that they express a surface molecule termed T19, for which no human or mouse homolog has yet been defined (4,12; see below) This molecule is highly immunogenic in mice, and several mAbs to T19 have been produced. Figure 1, lanes 8 - 1 1 , shows SDS-PAGE analysis of the bovine T19 molecule, immunoprecipitated using three different mAbs, 197, ILA-29, and 19-19. Under reducing conditions all mAbs immunoprecipitated the same sized molecule of ~ 2 1 5 - 2 2 0 k d . Under non-reducing conditions the T19 molecule migrated slightly faster, equivalent to - 2 0 0 kd (lane 11), indicating that the T19 molecule consists of a single polypeptide chain and most likely contains intra-chain disulfide bonds. The three antibodies almost certainly recognize the same 215 kd T19 molecule, since all three mAbs show an identical cellular reactivity, staining only yd T cells (see below).
The large proportion of yd T cells in bovine blood and the wide range of available surface markers (reviewed in 18) allowed us to assess the phenotype of bovine 76 T cells. Figure 2 shows the typical two-color immunofluorescence pattern observed. Expression of the 215 kd T19 molecule was restricted almost entirely to the 86D+ 76 subset. The very small number of T19 + cells that do not bind mAb 86D may represent 76 T cells which use a form of the receptor not recognized by this mAb. Also, a small percentage of yd (86D+) T cells lacked the T19 molecule. Functional studies on T19- and T19+ 76 T cells in sheep have so far shown no differences between these subsets, although the T19- subset did preferentially localize to intestinal epithelium (12).
CD8 was expressed at low levels on - 1 0 - 2 0 % of bovine 86D+ lymphocytes, and the proportion of CD8+ yd T cells varied from animal to animal. CD4, CD2, and CD6 were expressed on only a very small proportion of 76 (86D+) lymphocytes (Fig. 2). The absence of the CD2 molecule from bovine 76 T cells is similar to results reported in sheep (12,19,20) and the implications of this for 76 T cell behavior have been discussed (19,20). The significance of CD6 expression on afi but
Bovine yd T cells 543
not 76 T cells is still unclear, since the function of this molecule has not yet been determined, although in humans and cattle it has been implicated in T cell activation (21,22).
We also analyzed 76 T cells for the expression of CD44, a molecule known to be involved in lymphocyte recirculation (23) since y8 T cells in sheep show a specific recirculation pattern (24). 78 T cells in cattle expressed only moderate levels of CD44 (Fig 2), lower than the levels found on CD4+ or CD8+ cells (not shown). It is therefore possible that the lower expression of CD44 on 76 T cells contributes to their relatively sluggish traffic through lymph nodes (see below).
We next analyzed the distribution of yd T cells within skin, gut lymph nodes, and thymus, on the premise that this might clarify the cellular interactions and physiological significance of 76 T cells
in vivo. Figure 3(a) shows a frozen section of bovine skin stained
with the anti^5 mAb 86D by the immunoperoxidase technique.
yd+ cells were present in large numbers, and were usually of an irregular shape with abundant cytoplasm, in contrast to 76 + T cells in lymph nodes and thymus, where they were usually small and round. 76 T cells were localized within two areas of the skin. The majority accumulated as clusters within the dermis, sometimes close to the epidermis, and were also found inter-spersed between hair follicles. A minority of yd+ cells were distributed within the epidermis, although not randomly, rather, they appeared to have infiltrated the epidermis at specific sites (Fig. 3a, arrows). In most instances the accumulations of 76+ cells within the dermis merged with those in the epidermis. Staining of skin sections with anti-CD4 or anti-CD8 revealed few stained cells, indicating that the majority of 76+ cells in skin were CD4-CD8-.
Within intestinal villi, 76 T cells were numerous and were present in both the lamina propna and the epithelium (Fig. 3b). 76 T cells within intestinal epithelium were mostly large, blast-like cells with an irregular shape. Most, if not all, intra-epithelial lymphocytes were CD8 + . CD4+ lymphocytes were confined entirely to the lamina propna.
Lung tissue sections were stained with a panel of mAbs. Unlike skin or intestinal epithelium, 76 T cells comprised only a low proportion of all T cells, and showed no specific localization compared with CD4+ or CD8+ cells.
In bovine thymus the distribution of 76 T cells was identical to that previously described for sheep thymus (12). A remarkable feature of both bovine and ovine thymus was the large proportion of medullary thymocytes that were of the 76 type (Fig. 3c). This may reflect the high numbers of 76 T cells in peripheral blood of sheep and cattle, and so this feature may not hold for all species. A second feature was the characteristic clustering of
yd T cells around Hassall's corpuscles, which we have also shown
in sheep (12), suggesting that Hassall's corpuscles may play a role in the maturation of yd T cells, at least in these species.
We next examined cattle lymph nodes to see if yd T cells were localized to any particular cellular compartment. Staining with mAb 86D revealed that 76 T cells were situated around the trabeculae which penetrate from the capsule into the node (Fig. 3d). 76 T cells also were localized to medullary sinuses but were usually absent from B cell follicles, whereas CD4+ cells were present in these sites (Fig. 3e), which probably relates to the helper role of CD4+ cells during T - B interactions. The T cell areas of the lymph node contained large numbers of CD4+ and CD8+ cells (Fig. 3e and f), but 76 T cells were sparse-to-absent
544 Bovine yd T cells
The absence of yd T cells from B cell follicles was a general finding; however, in one of five lymph nodes examined, some
yd T cells were found within germinal centers.
The number of 76 T cells within lymph nodes was usually very low, much less than the numbers of CD4+ or CD8+ T cells, which is in contrast to the high proportion of yd T cells found in the blood. This indicates that yS T cells do not pass from blood to lymph nodes as freely as CD4+ or CD8+ cells. To demonstrate this more formally, we analyzed blood and lymph node cells from the same animals, and the typical reactivity pattern is shown in Table 1. yd T cells within lymph nodes usually comprised 1 - 3 % of cells in animals of 6 - 1 0 months of age, although higher values were seen in older animals. 76 T cells usually comprised 15 - 30% of PBL, although on one occasion 53% of cells were stained. The localization of 76 T cells in the lymph node, i.e. in areas adjacent to trabeculae and within medullary sinuses, suggests that the cells were purely in transit. Taken together with their low numbers, these findings imply that 76 T cells play little or no immunological role within lymph nodes. The studies reported here in cattle provide further evidence that the numbers, phenotype, and distribution of 76 T cells can vary considerably from species to species. The presence of high numbers of yS T cells in the skin of cattle and mice ( 7 - 9 ) is in marked contrast to the very low numbers found in the skin of humans (17), chickens (10), and sheep (unpublished). Secondly, the CD2 molecule, which promotes adhesion and activation of T cells, is expressed on circulating 76 T cells of humans (17) but not on those of cattle, sheep (12,19), or chickens (O. Vainio, personal communication). Thirdly, 76 T cells are distributed evenly throughout the human lymphoid system (17), whereas in cattle and sheep lymph nodes, these cells are concentrated around trabeculae and within the medulla. Fourthly 76 T cells show an association with Hassall's corpuscles within the thymic medulla of cattle and sheep, whereas no such association has been noted in humans (17). Lastly, in ruminants the yd subset represents a numerous T cell type, particularly during the perinatal period of development (28). 76 T cells also represent a numerous T cell type in chickens (16) and in pigs (29; M. J. Reddehase and A. Saalmuller, personal communication), whereas humans and mice have low numbers of circulating 76 T cells.
Prominence of 76 T cells at epithelial surfaces is a feature which has been described in all species examined (7-12), although humans have relatively fewer 76 T cells at these sites (17). This conserved feature points towards the function of yd T cells as a 'first line' defense for the elimination of infected or transformed epithelial cells (30). Our results certainly support this proposition, although it is not yet clear why species as diverse as cattle or sheep, chickens, and pigs have such high numbers of 76 T cells within the circulation. Environmental conditions could dictate that certain species need a more extensive repertoire for the 76 TCR. Alternatively, the function(s) of 76 T cells might overlap with those of or/3 T cells, so that the relative proportions of these two T cell types in different species might be somewhat random and inconsequential. In any event, cattle join a growing list of species in which 76 T cells represent a numerous lymphoid cell type, which would indicate that 76 T cells are not just a minor redundant T cell subset.
The in vivo function of the 76 subset probably relates to those features of y6 T cells that are clearly distinct from a/3 T cells. These include the recognition of antigen in an MHC-unrestncted fashion
(12,13) or in the context of elements such as Qa-1 (15), the exclusive use of certan cell surface molecules such as T19, and the preferential localization to epithelial surfaces (7 -12). A fuller analysis of the evolutionary history of 76 TCR and its usage among different species of animals, together with functional studies, may be required for a complete understanding of the physiological significance of 76 T cells in immune responses.
Acknowledgements
We thank Ms W. Marsden and L Dudler for technical assistance, Dr M.-F Beya for helpful discussions, and Drs R. Kubo and J. Allison for supplying anti-CD3 and anti-5 sera respectively. mAbs to bovine leukocyte molecules were kindly provided by the organizers of the 1st International Workshop on differentiation antigens on bovine and ovine leukocytes. We thank Miss K. Zurcher and Nicole Schoepflin for preparing the manuscript and Drs A de la Hera, R Palacios, I. R Mackay, and P Matzinger for critical review of the manuscript. The Basel Institute for Immunology was founded and is supported by F. Hoffmann-La Roche &Co Ltd, Basel, Switzerland Monoclonal antibodies ILA-11, ILA-27 and ILA-29 were produced at ILRAD, Nairobi, Kenya and monoclonal antibody CH128A was provided by Dr W C Davis, Pullman, WA, USA
Abbreviations mAb MHC PBL SDS-PAGE TCR monoclonal antibody
major histocompatibility complex peripheral blood lymphocyte^)
sodium dodecyl sulfate-polyacrylamide gel elec trophoresis
T cell receptor
References
1 Allison, J P and Lamer, L. L. 1987. Structure, function and serology of the T-ce)l antigen receptor complex Annu. Rev Immunol 5:503 2 Brenner, M B., McLean, J., Dialynas, D. P., Strominger, J. L.,
Smith, J. A., Owen, F. L, Seidman, J G , Ip, S , Rosen, F , and Krangel, M. S. 1986 Identification of a putative second T-cell receptor. Nature 322.145.
3 Moingeon, P , Ythier, A , Goubn, G., Faure, F., Novill, A., Delmon, L., Reinaud, M., Forestier, F., Daffos, F., Bohuon, C , and Hercend, T. 1986. A unique T-cell receptor complex expressed on human fetal lymphocytes displaying natural killer-like activity. Nature 323:638. 4 Mackay, C. R., Maddox, J. F , and Brandon, M. R 1986. Three distinct
subpopulations of sheep T lymphocytes. Eur. J. Immunol. 16.19. 5 Lamer, L L and Weiss, A. 1986. Presence of Ti (WT31) negative T
lymphocytes in normal blood and thymus. Nature 324.268. 6 Lamer, L. L , Federspiel, N. A., Ruietenberg, J J , Phillips, J. H ,
Allison, J. P., Littman, D., and Weiss, A 1987. The T cell antigen receptor complex expressed on normal peripheral blood CD4-, CD8~ T lymphocytes. A CD3-associated disulfide-lmked 7 chain heterodimer. J. Exp. Med. 165:1076.
7 Stingl, G., Koning, F., Yamada, H., Yokoyama, W. M , Tschachler, E , Bluestone, J. A., Steiner, G., Samelson, L. E., Lew, A. M., Coligan, J. E., and Shevach, E. M 1987. Thy-1 + dendritic epidermal
cells express T3 antigen and the T-cell receptor 7 chain Proc. Natl. Acad. Sci. USA 844586.
8 Bonneville, M , Janeway, C. A., Ito, K., Haser, W., Ishida, I, Nakanishi, N., and Tonegawa, S. 1988. Intestinal intraepithetial lymphocytes are a distinct set of 7* T cells. Nature 336.497 9 Goodman, T. and Lefrancois, L. 1988. Expression of the 7-* T-cell
receptor on intestinal CD8+ intraepithelial lymphocytes. Nature 333:855.
10 Bucy, R. P , Chen, C.-L H., Cihak, J., Losch, U., and Cooper, M. D 1988. Avian T cells expressing 76 receptors localize in the splenic sinusoids and the intestinal epithelium. J. Immunol. 141 2200. 11 Bonyhadi, M., Weiss, A., Tucker, P. W., Tigelaar, R E., and
Bovine yS T cells 545
epidermal cells identification of S as the Cx gene product Nature 330.574.
12 Mackay, C. Ft, Beya, M. F , and Matzinger, P. 1989. y6 T cells express a unique surface molecule which appears late during thymic development Eur J. Immunol, in press
13 Brenner, M B., McLean, J., Scheft, H , Riberdy, J., Ang, S-L , Seidman, J. G , Devlin, P , and Krangel, M. S. 1987 Two forms of the T-cell receptor 7 protein found on peripheral blood cytotoxic lymphocytes Nature 325:689.
14 Borst, J., van de Griend, R J., van Oostveen, J W., Ang, S.-L, Melief, C. J., Seidman, J G , and Bolhuis, R J L 1987. A T cell receptor 7/CD3 complex found on cloned functional lymphocytes. Nature 325 683.
15 Vidovic, D , Roglic, M., McKune, K , Guerder, S , Mackay, C , and Dembic, Z 1989 Qa-1 restricted recognition of foreign antigen by a 76 T cell hybndoma. Nature 340646.
16 Sowder, J. T , Chen, C. H., Lamer Ager, L., Chan, M M., and Cooper, M. D 1988. A large subpopulation of avian T cells express a homdogue of the mammalian T 7/6 receptor J. Exp Med. 167315 17Groh, V., Porcelli, S, Fabbi, M., Lanier, L L, Picker, L J , Anderson, T , Warnke, R. A., Bhan, A K , Stommger, J L., and Brenner, M B. 1989 Human lymphocytes bearing T cell receptor 7/5 are phenotypically diverse and evenly distributed throughout the lymphoid system J Exp Med. 169 1277
18 Baldwin, C. L, Morrison, W. I , and Naessens, J 1988 Differentiation antigens and functional characteristics of bovine leukocytes In Miyasaka, M , and Trnka, Z., eds, Differentiation Antigen in Lympho-hemopoietic Tissues, p. 55 Marcel Dekker, New York.
19 Mackay, C. R., Hem, W Ft., Brown, M. R , and Matzinger, P. 1988 Unusual expression of CD2 in sheep implications for T cell interactions. Eur J. Immunol 181681
20 Giegench, G W., Hem, W R., Miyasaka, M , Tiefenthauler, G., and Humg, T. 1989 Restriction expression of CD2 among subsets of sheep thymocytes and T lymphocytes Immunology 66.354
21 Rieber, P, Rank, G , Wirth, S., Wilhelm, M , Kopp, E, and Riethmuller, G 1986 In Remherz, E L, Haynes, B F , Nadler, L M ,
and Bernstein,! D , eds, Leukocyte Typing II, p. 233 Springer-Verlag, Berlin.
22 Baldwin. C. L, MacHugh, N. D , Ellis, J. A., Naessens, J., Newson, J., and Morrison, W. I. 1988. Monoclonal antibodies which react with bovine T-lymphocyte antigens and induce blastogenesis: tissue distribution and functional characteristics of the target antigens Immunology 63439.
23 Stoolman, L. M. 1989. Adhesion molecules controlling lymphocyte migration. Cell 56:907.
24 Mackay, C. R., Kimpton, W. G., Brandon, M. Ft., and Cahill, R. N. P 1988. Lymphocyte subsets show marked differences in their distribution between blood, and afferent and efferent lymph draining peripheral lymph nodes. J. Exp. Med. 167:1755
25 Baldwin, C. L, Teale, A. J., Naessens, J. G., Goddeeris, B. M., MacHugh, N. D., and Morrison, W I. 1986 Charactenzation of a subset of bovine T lymphocytes that express BoT4 by monoclonal antibodies and function: similarity to lymphocytes defined by human T4 and murine L3T4. J Immunol. 136 4385.
26 Davis, W C , Ellis, J A., MacHugh, N. D , and Baldwin, C. L. 1988. Bovine pan T-cell monoclonal antibodies reactive with a molecule similar to CD2. Immunology 63.165.
27 Mackay, C Ft., Maddox, J F , Wipes, G L, Mackay, I. R , and Walker, I. D. 1988. Characterization of a 95,000 molecule on sheep leukocytes homologous to murine Pgp-1 and human CD44 Immunology 65.93.
28 McClure, S. J , Hein, W R , Yamaguchi, K., Dudler, L, Beya, M.-F , and Miyasaka, M 1989. Ontogeny, morphology and tissue distribution of a unique subset of CD4-CD8" TCR 6+ sheep T lymphocytes. Immunol. Cell B10I. in press.
29 SaalmOller, A , Reddehase, M J., Buhnng, H -J , Jonjic, S., and Koszinowski, U. H 1987. Simultaneous expression of CD4 and CDS by a substantial proportion of resting porcine T lymphocytes. Eur J. Immunol 17.1297
30 Janeway, C A , Jones, B , and Hayday, A 1988. Specificrty and function of T cells bearing yS receptors Immunoi. Today 9:73.